. 2020 Sep 8;16(9):e1008799.
doi: 10.1371/journal.ppat.1008799. eCollection 2020 Sep.

Plasmodium sporozoites induce regulatory macrophages

Affiliations

Plasmodium sporozoites induce regulatory macrophages

Béatrice M F Winkel et al. PLoS Pathog. .

Abstract

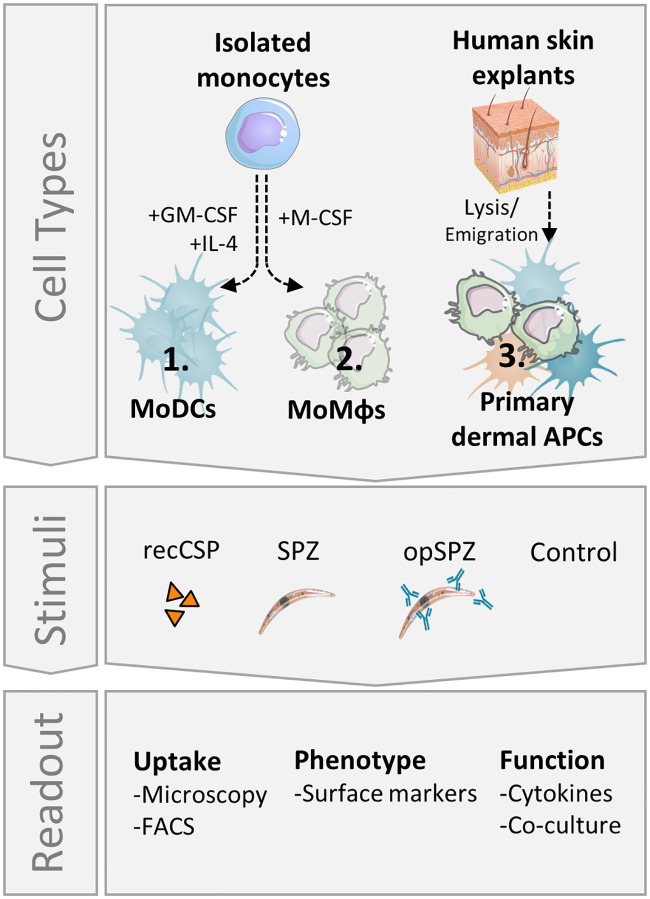
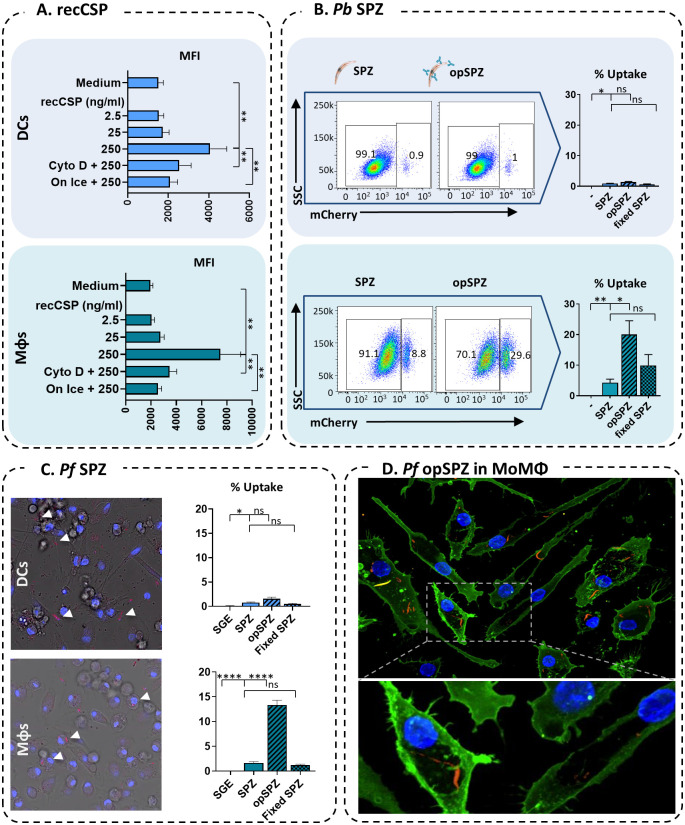
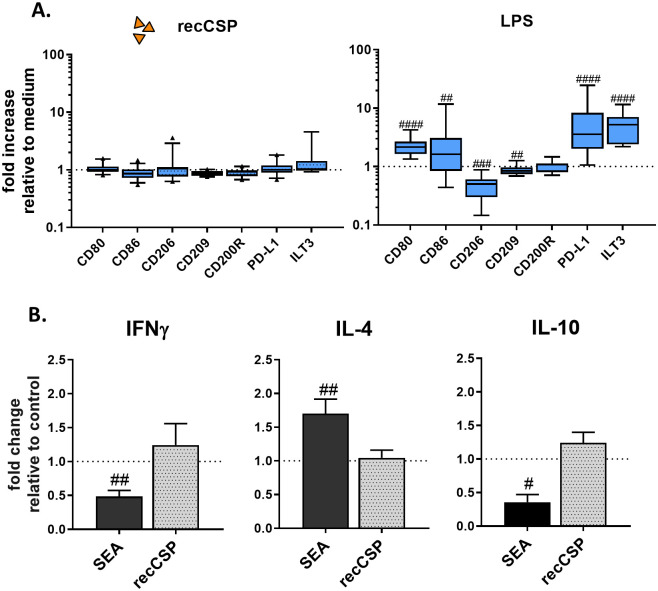
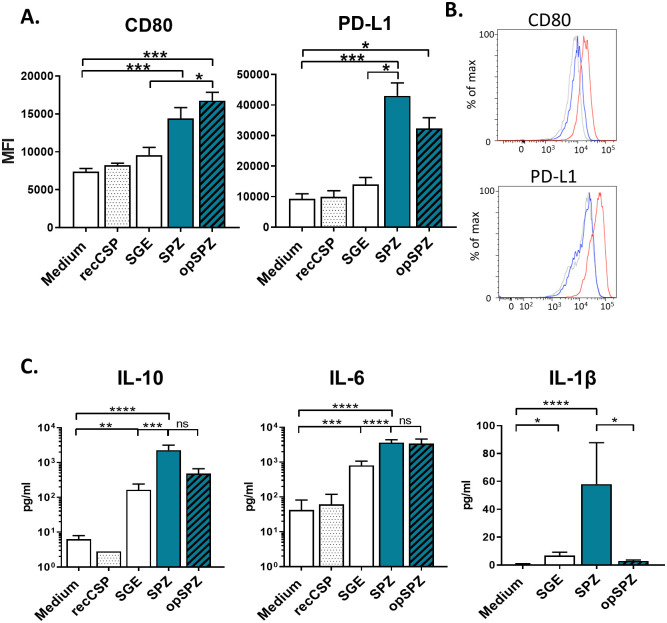
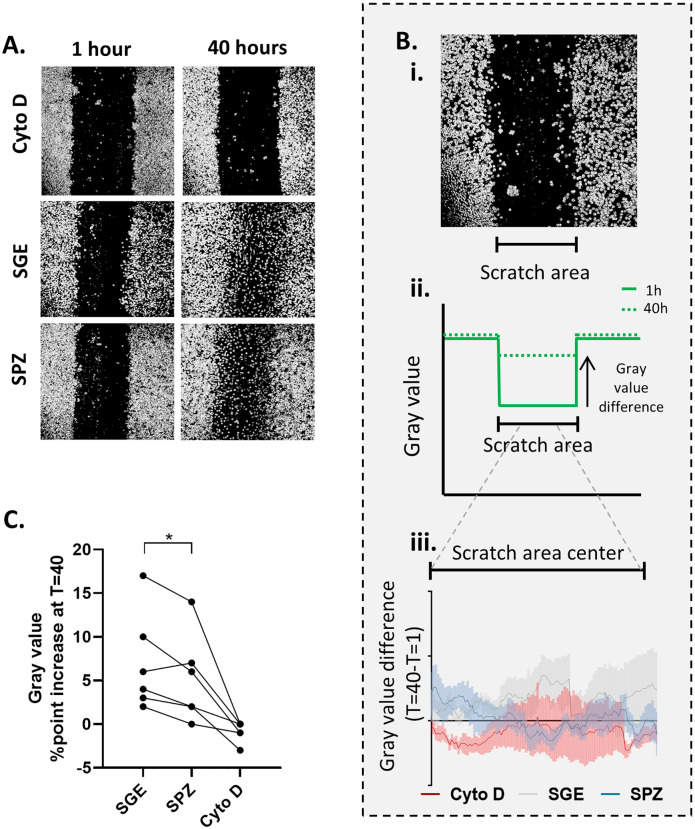
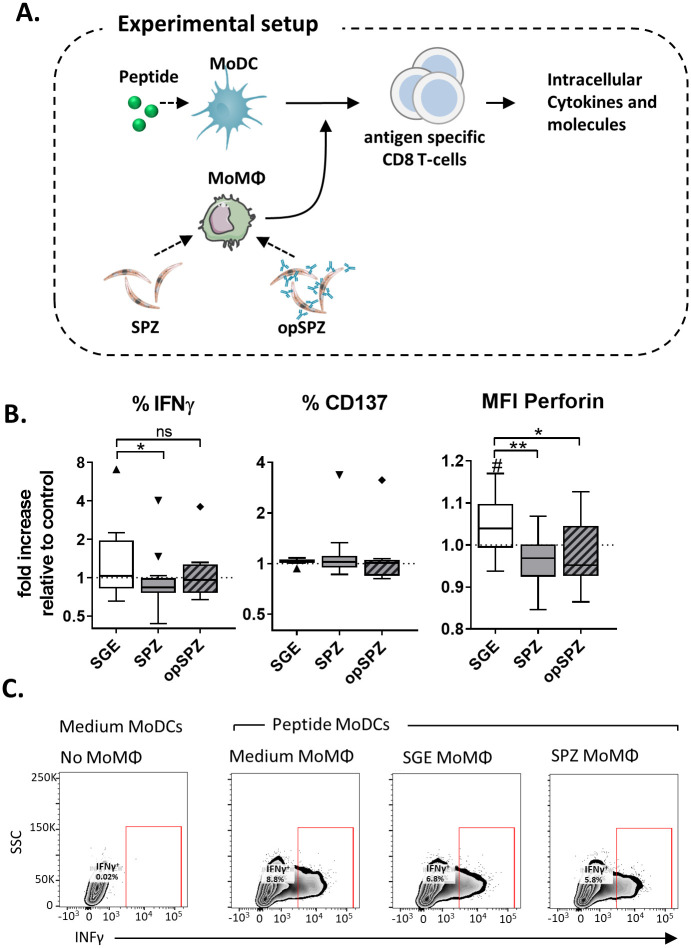
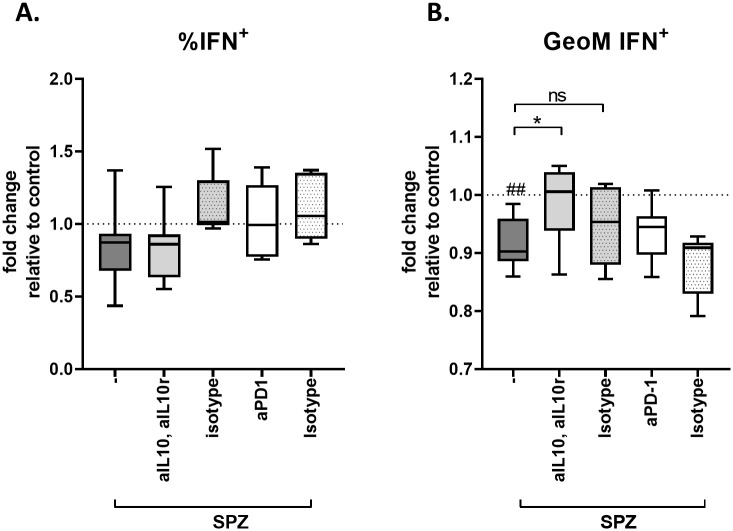
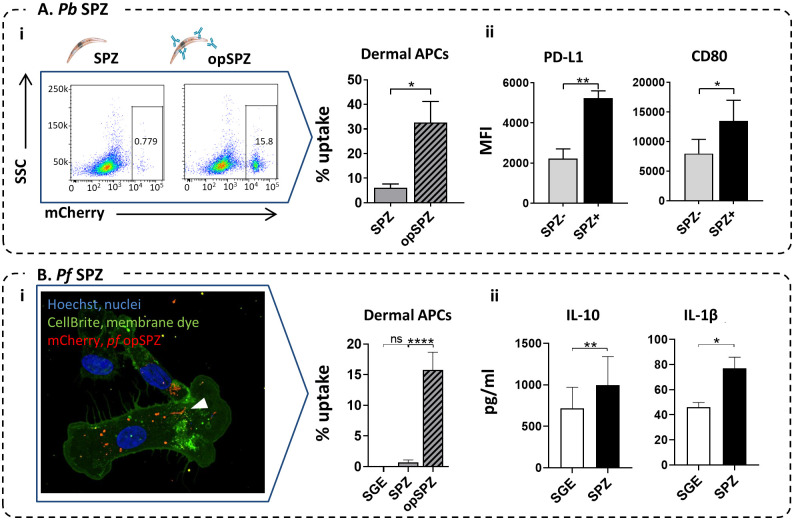
Professional antigen-presenting cells (APCs), like macrophages (Mϕs) and dendritic cells (DCs), are central players in the induction of natural and vaccine-induced immunity to malaria, yet very little is known about the interaction of SPZ with human APCs. Intradermal delivery of whole-sporozoite vaccines reduces their effectivity, possibly due to dermal immunoregulatory effects. Therefore, understanding these interactions could prove pivotal to malaria vaccination. We investigated human APC responses to recombinant circumsporozoite protein (recCSP), SPZ and anti-CSP opsonized SPZ both in monocyte derived MoDCs and MoMϕs. Both MoDCs and MoMϕs readily took up recCSP but did not change phenotype or function upon doing so. SPZ are preferentially phagocytosed by MoMϕs instead of DCs and phagocytosis greatly increased after opsonization. Subsequently MoMϕs show increased surface marker expression of activation markers as well as tolerogenic markers such as Programmed Death-Ligand 1 (PD-L1). Additionally they show reduced motility, produce interleukin 10 and suppressed interferon gamma (IFNγ) production by antigen specific CD8+ T cells. Importantly, we investigated phenotypic responses to SPZ in primary dermal APCs isolated from human skin explants, which respond similarly to their monocyte-derived counterparts. These findings are a first step in enhancing our understanding of pre-erythrocytic natural immunity and the pitfalls of intradermal vaccination-induced immunity.


Conflict of interest statement

The authors have declared that no competing interests exist.

Figures

Fig 1
Fig 1. Experimental setup.
MoDCs and MoMϕs were differentiated in vitro from freshly isolated monocytes. Additionally, fresh human skin explants containing primary dermal APCs were lysed to form a single cell suspension. All cell types were stimulated in vitro with recombinant SPZ surface antigen, circumsporozoite protein (recCSP) or whole sporozoites (untreated: SPZ or opsonized: opSPZ). Uptake of recCSP and (op)SPZ was determined by confocal microscopy and flow cytometry. Subsequently, cells were analyzed for their phenotype and function. Images of skin and sporozoite were reproduced. They were purchased for publication at Turbosquid.com.
Fig 2
Fig 2. Uptake of recCSP and whole SPZ by MoDCs and MoMϕs.
A. Quantification of fluorescent recCSP uptake (ng/ml) in MoDCs (top) and MoMϕs (bottom); MFI: median fluorescence intensity. N = 2, 4 donors. B. Uptake of whole Pb sporozoites by MoDCs and MoMϕs. Representative flow cytometry plots showing mCherry expression in MoDCs (top) and MoMϕs (bottom) after stimulation with SPZ or opsonized SPZ using an anti-CSP antibody (opSPZ). Quantification of SPZ uptake (% of mCherry+ APCs) by flow cytometry. N = 3, 9 donors (fixed SPZ: 4 donors). C. Uptake of whole Pf sporozoites by MoDCs and MoMϕs quantified by confocal microscopy. N = 2, 4 donors, on average 1150 MoMacs and 550 MoDCs per donor per condition. D. Confocal microscopy image of Pf SPZ uptake by MoMϕs.
Fig 3
Fig 3. MoDC responses to recCSP.
A. RecCSP stimulation (250 ng/ml) does not alter MoDC surface markers. Responses to control LPS are shown on the right. Data shown as fold changes compared to medium stimulated control. N = 8, 10–19 donors per marker. B. CD4+ T cell polarization after recCSP stimulation. RecCSP stimulation of LPS-matured MoDCs does not polarize naïve T cells towards a Th1 (IFNγ), Th2 (IL-4; both measured by intracellular staining, N = 2, 6 donors.) or Treg (IL-10; measured by ELISA after CD3/28 restimulation, N = 2, 4 donors) response. Soluble Schistosome Egg Antigen (SEA) used as a Th2 inducing control. Data shown relative to LPS-matured MoDC control. A and B: # indicates comparison to control. #: P = <0.05, ##: P = <0.005, ###: P = <0.0005 and ####: P = <0.0001.
Fig 4
Fig 4. MoMϕ responses to (opsonized) Pf SPZ.
A. SPZ and opSPZ upregulate activation marker CD80 as well as regulatory marker PD-L1. Analysis using one way ANOVA. N = 9, at least 20 donors. B. Representative histograms of CD80 and PD-L1 surface marker expression. Medium stimulated MoMϕs in grey, SGE stimulated MoMϕs in blue and SPZ stimulated MoMϕs in red. C. MoMϕs produce IL-10, IL-6 and IL1β in response to (op)SPZ stimulation. Analysis using one way ANOVA on log transformed data. *: P = <0.05, **: P = <0.005, ***: P = <0.0005 and ****: P = <0.0001, ns = not significant. IL-10: N = 8, 25 donors; IL-6: N = 5, 17 donors; IL1β: N = 3, 7 donors.
Fig 5
Fig 5. MoMϕ migration upon Pf SPZ stimulation.
A. Representative examples of wound closing assay. The images show wells containing MoMϕs (grey) with a central “wound” (black), where MoMϕs have been scratched away. After 40 hours, blurring of the scratch indicates migrated MoMϕs. Cytochalasin D (Cyto D) blocks all cell migration as control. B. i. example of a scratch with indication of scratch area to be analyzed. ii. Schematic of a surface plot of entire microscopic image. An increase in the gray value is seen over the scratch area over time, as cells fill up the wound. iii. Difference in gray value between T = 40 and T = 1 over the scratch area center, where an increased difference reflects higher migration. Lines indicate the mean of three independent experiments including six donors. Line width indicates Standard Error of the Mean (SEM). As cells migrate from the outside inward, a decrease in migration is seen primarily in the center of the scratch area. Pf SPZ stimulated MoMϕs display reduced wound closure after 40 hours. Statistical analysis using two way ANOVA with Tukey test for multiple comparison, SPZ compared to SGE p = <0.0001. C. Mean percent point difference in gray value over the scratch area (T = 40-T = 1) over time per donor. Analysis using paired student’s T test *: p = <0.05.
Fig 6
Fig 6. Immune suppression by Pf SPZ stimulated macrophages.
A. Experimental setup. Peptide stimulated MoDCs are co-cultured with a peptide specific CD8+ T cell clone in the presence or absence of parasite or control stimulated MoMϕs (information in materials and methods). B. CD8 + cell phenotype after overnight co-culture with MoDCs and MoMϕs. Intracellular IFNγ, activation marker CD137 and Perforin expression. Analysis using Wilcoxon test, N = 4, 8 donors. #: P = <0.05 compared to medium control. *: P = <0.05, **: P = <0.005. C. Representative cytometry plots showing percentage of IFNγ+ CD8 + T cells.
Fig 7
Fig 7. Blocking the IL10 pathway partially restores IFNγ production in IFNγ+ CD8+ T cells.
A. Blocking IL-10 and its receptor, or PD-1 does not restore the percentage of IFNγ producing CD8 T cells. Data shows % of IFNγ+ antigen specific CD8+ T cells after co-culture with antigen pulsed MoDCs in the presence of macrophages stimulated with Pf SPZ alone (-) or Pf SPZ and anti IL-10(R) or PD-1 antibodies or their isotype controls. B. Blocking IL-10 and its receptor, but not PD-1 restores the levels of IFNγ produced by IFNγ+ CD8 T cells (data shown in Mean Fluorescent intensity compared to medium control). # indicates comparison to control (standardized to 1). ##: p = <0.01, *: p = <0.05.
Fig 8
Fig 8. Human skin APC responses to SPZ.
A. i. Pb SPZ uptake in dermal APCs (HLA-DR+, CD11c+) from lysed skin explants. Representative plots and quantification of flow cytometric results. N = 4, 6 donors. Ii. PD-L1 and CD80 expression in lysed dermal APCs in the SPZ+ (after uptake of Pb opSPZ) or SPZ- subset. N = 3, 3 donors. B. i. Pf SPZ uptake in dermal APCs (emigrated from human skin explants) Representative image and quantification of confocal microscopy results. N = 3, 3 donors. ii. IL-10 and IL-1β production by Pf SPZ or SGE stimulated lysed skin cells. *: p = <0.05, **: p = <0.01, ****: p = <0.0001. N = 3, 4 donors.

References

    1. [Internet] WHO: Geneva Switzerland, 19 November 2018, World Malaria report 2018. https://www.who.int/malaria/media/world-malaria-report-2018/en/.
    1. Doolan D.L., Dobano C., and Baird J.K., Acquired immunity to malaria. Clin Microbiol Rev, 2009. 22(1): p. 13–36, Table of Contents. - PMC - PubMed
    1. Graves P. and Gelband H., Vaccines for preventing malaria (pre-erythrocytic). Cochrane Database Syst Rev, 2006(4): p. CD006198. - PMC - PubMed
    1. Rts S.C.T.P., et al., A phase 3 trial of RTS,S/AS01 malaria vaccine in African infants. N Engl J Med, 2012. 367(24): p. 2284–95. - PMC - PubMed
    1. Seder R.A., et al., Protection against malaria by intravenous immunization with a nonreplicating sporozoite vaccine. Science, 2013. 341(6152): p. 1359–65. - PubMed

Publication types

Substances