. 2020 Sep 8;4(17):4217-4231.
doi: 10.1182/bloodadvances.2020001584.

PI3Kδ inhibition reshapes follicular lymphoma-immune microenvironment cross talk and unleashes the activity of venetoclax

Affiliations

PI3Kδ inhibition reshapes follicular lymphoma-immune microenvironment cross talk and unleashes the activity of venetoclax

Neus Serrat et al. Blood Adv. .

Abstract

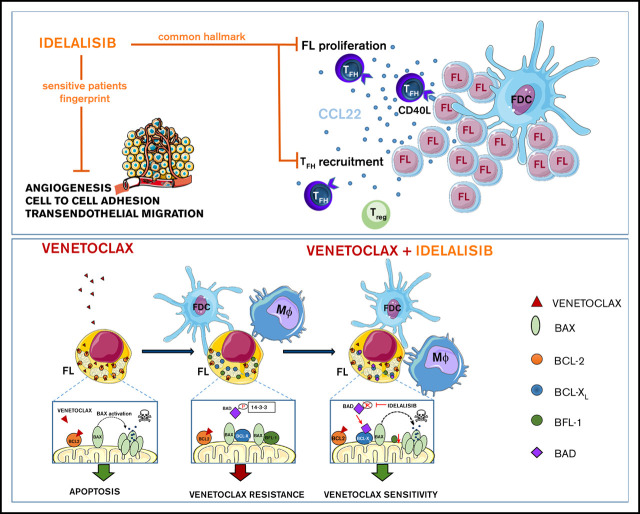
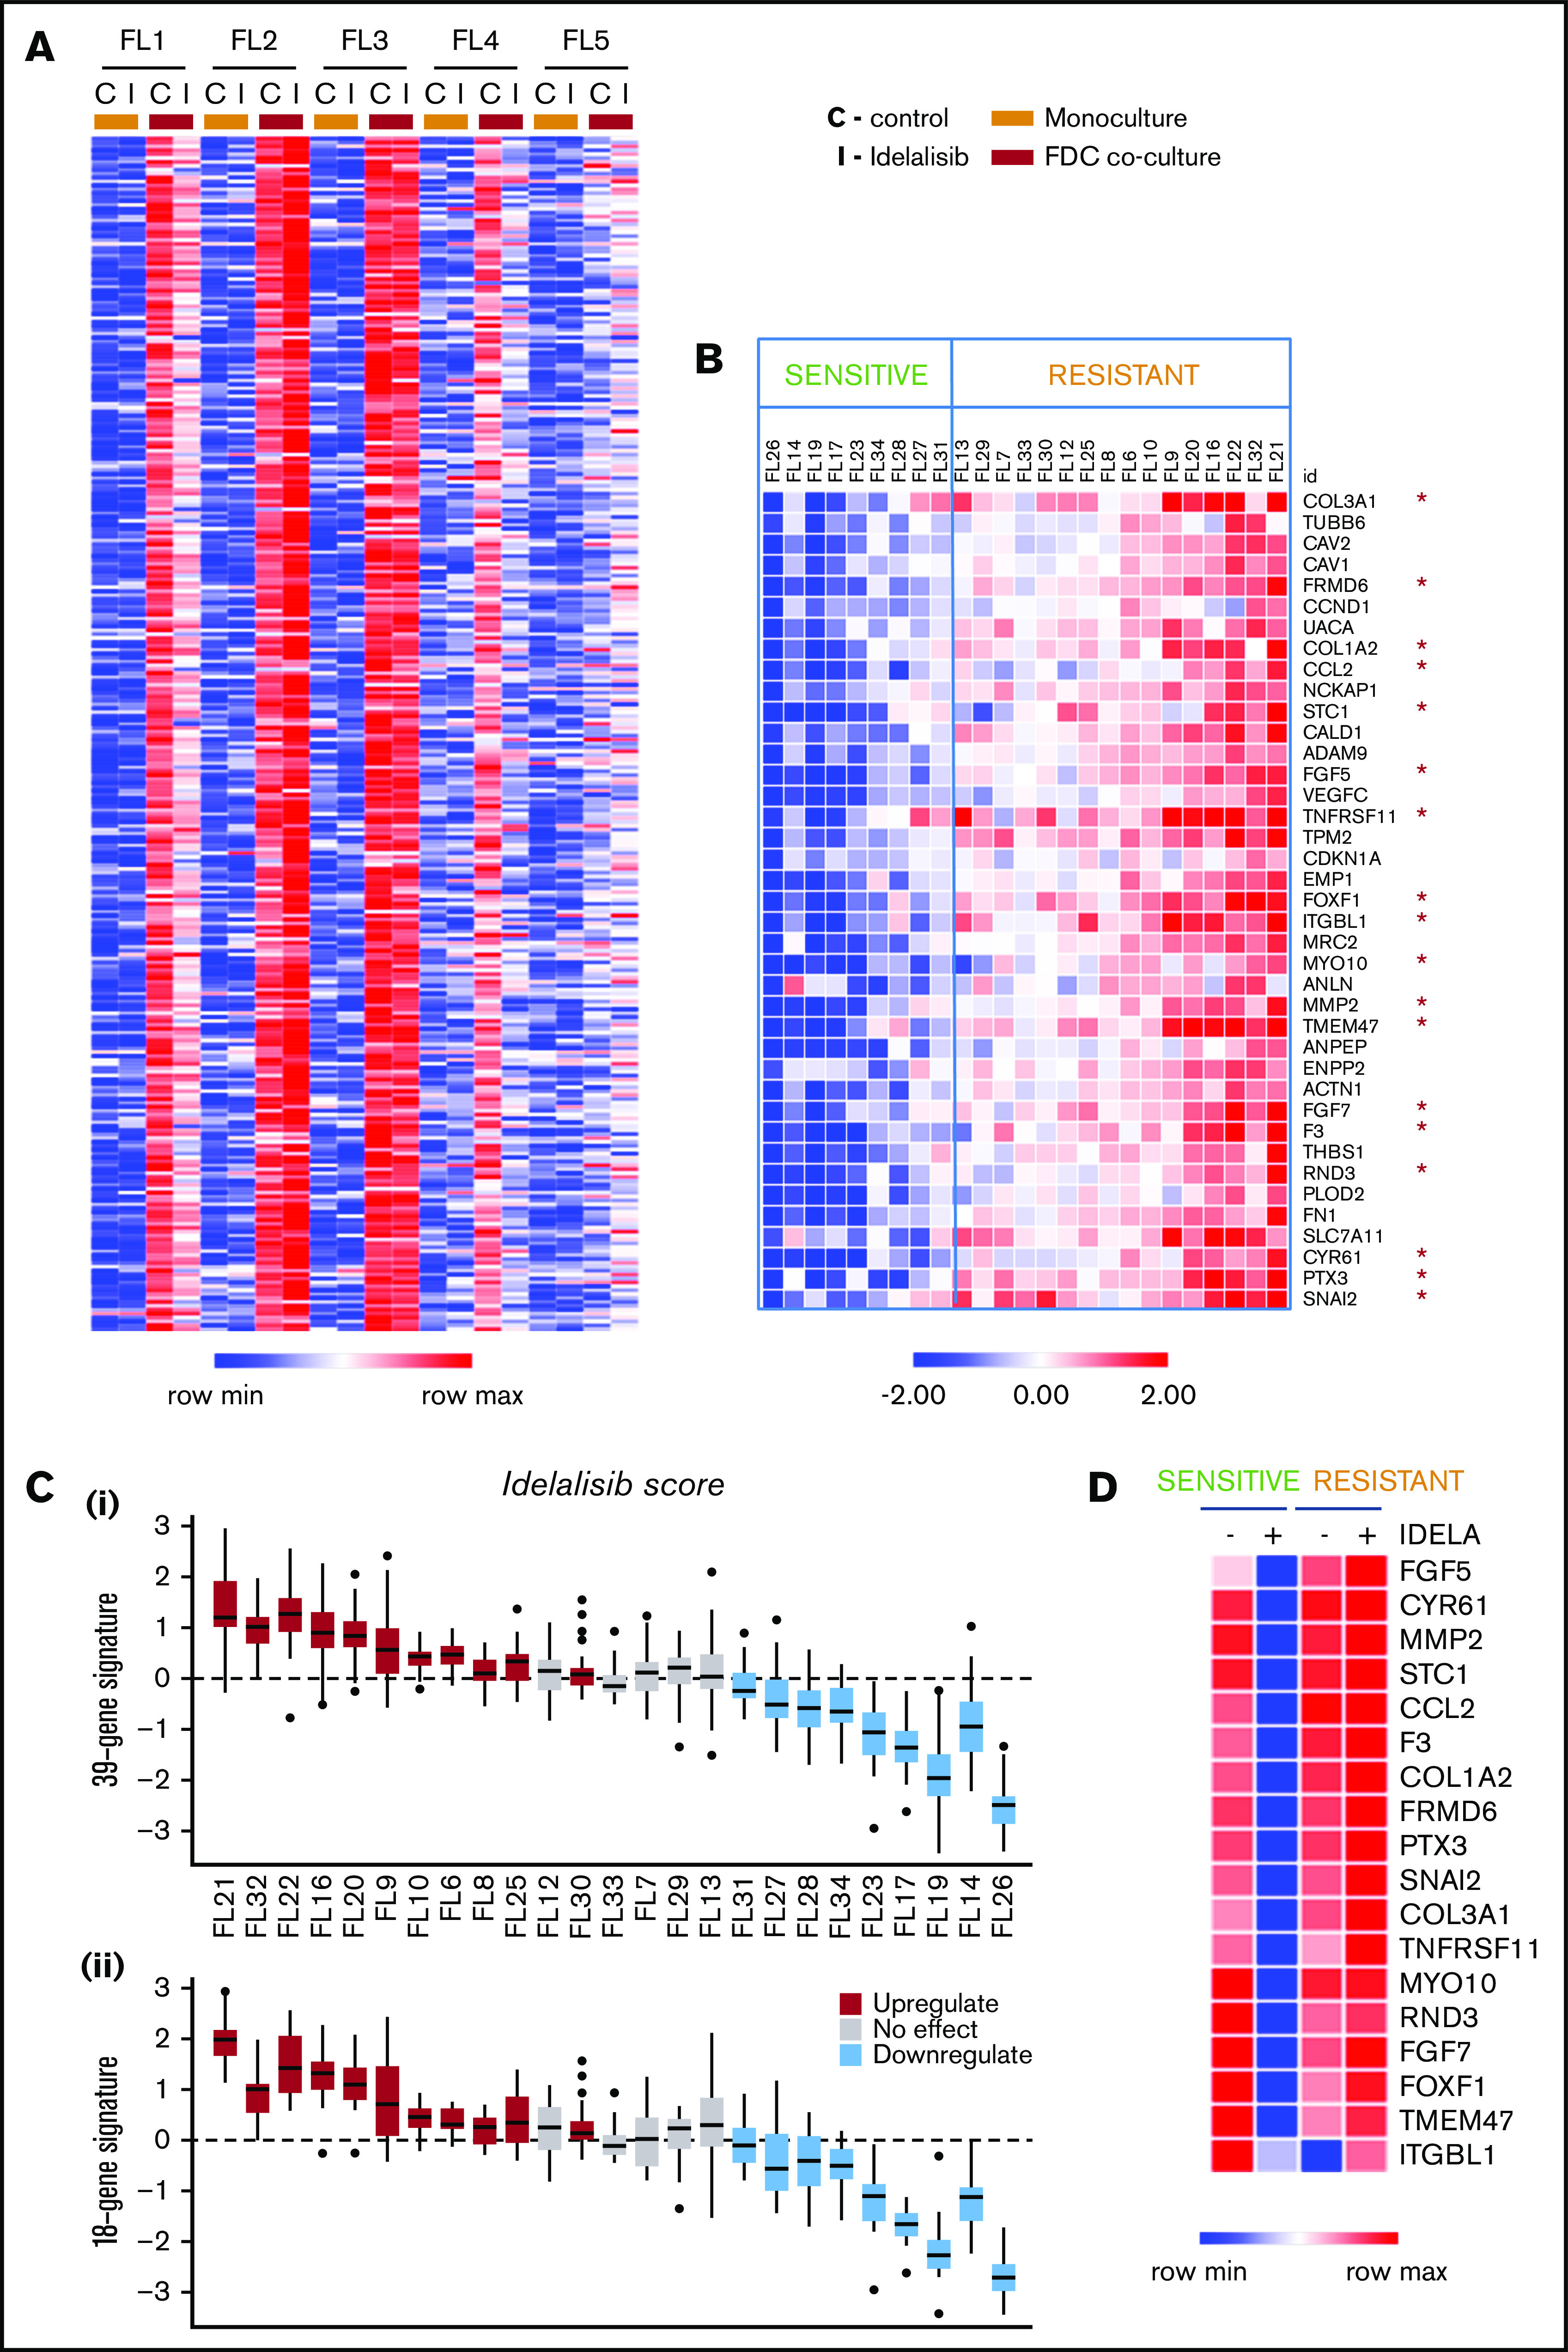
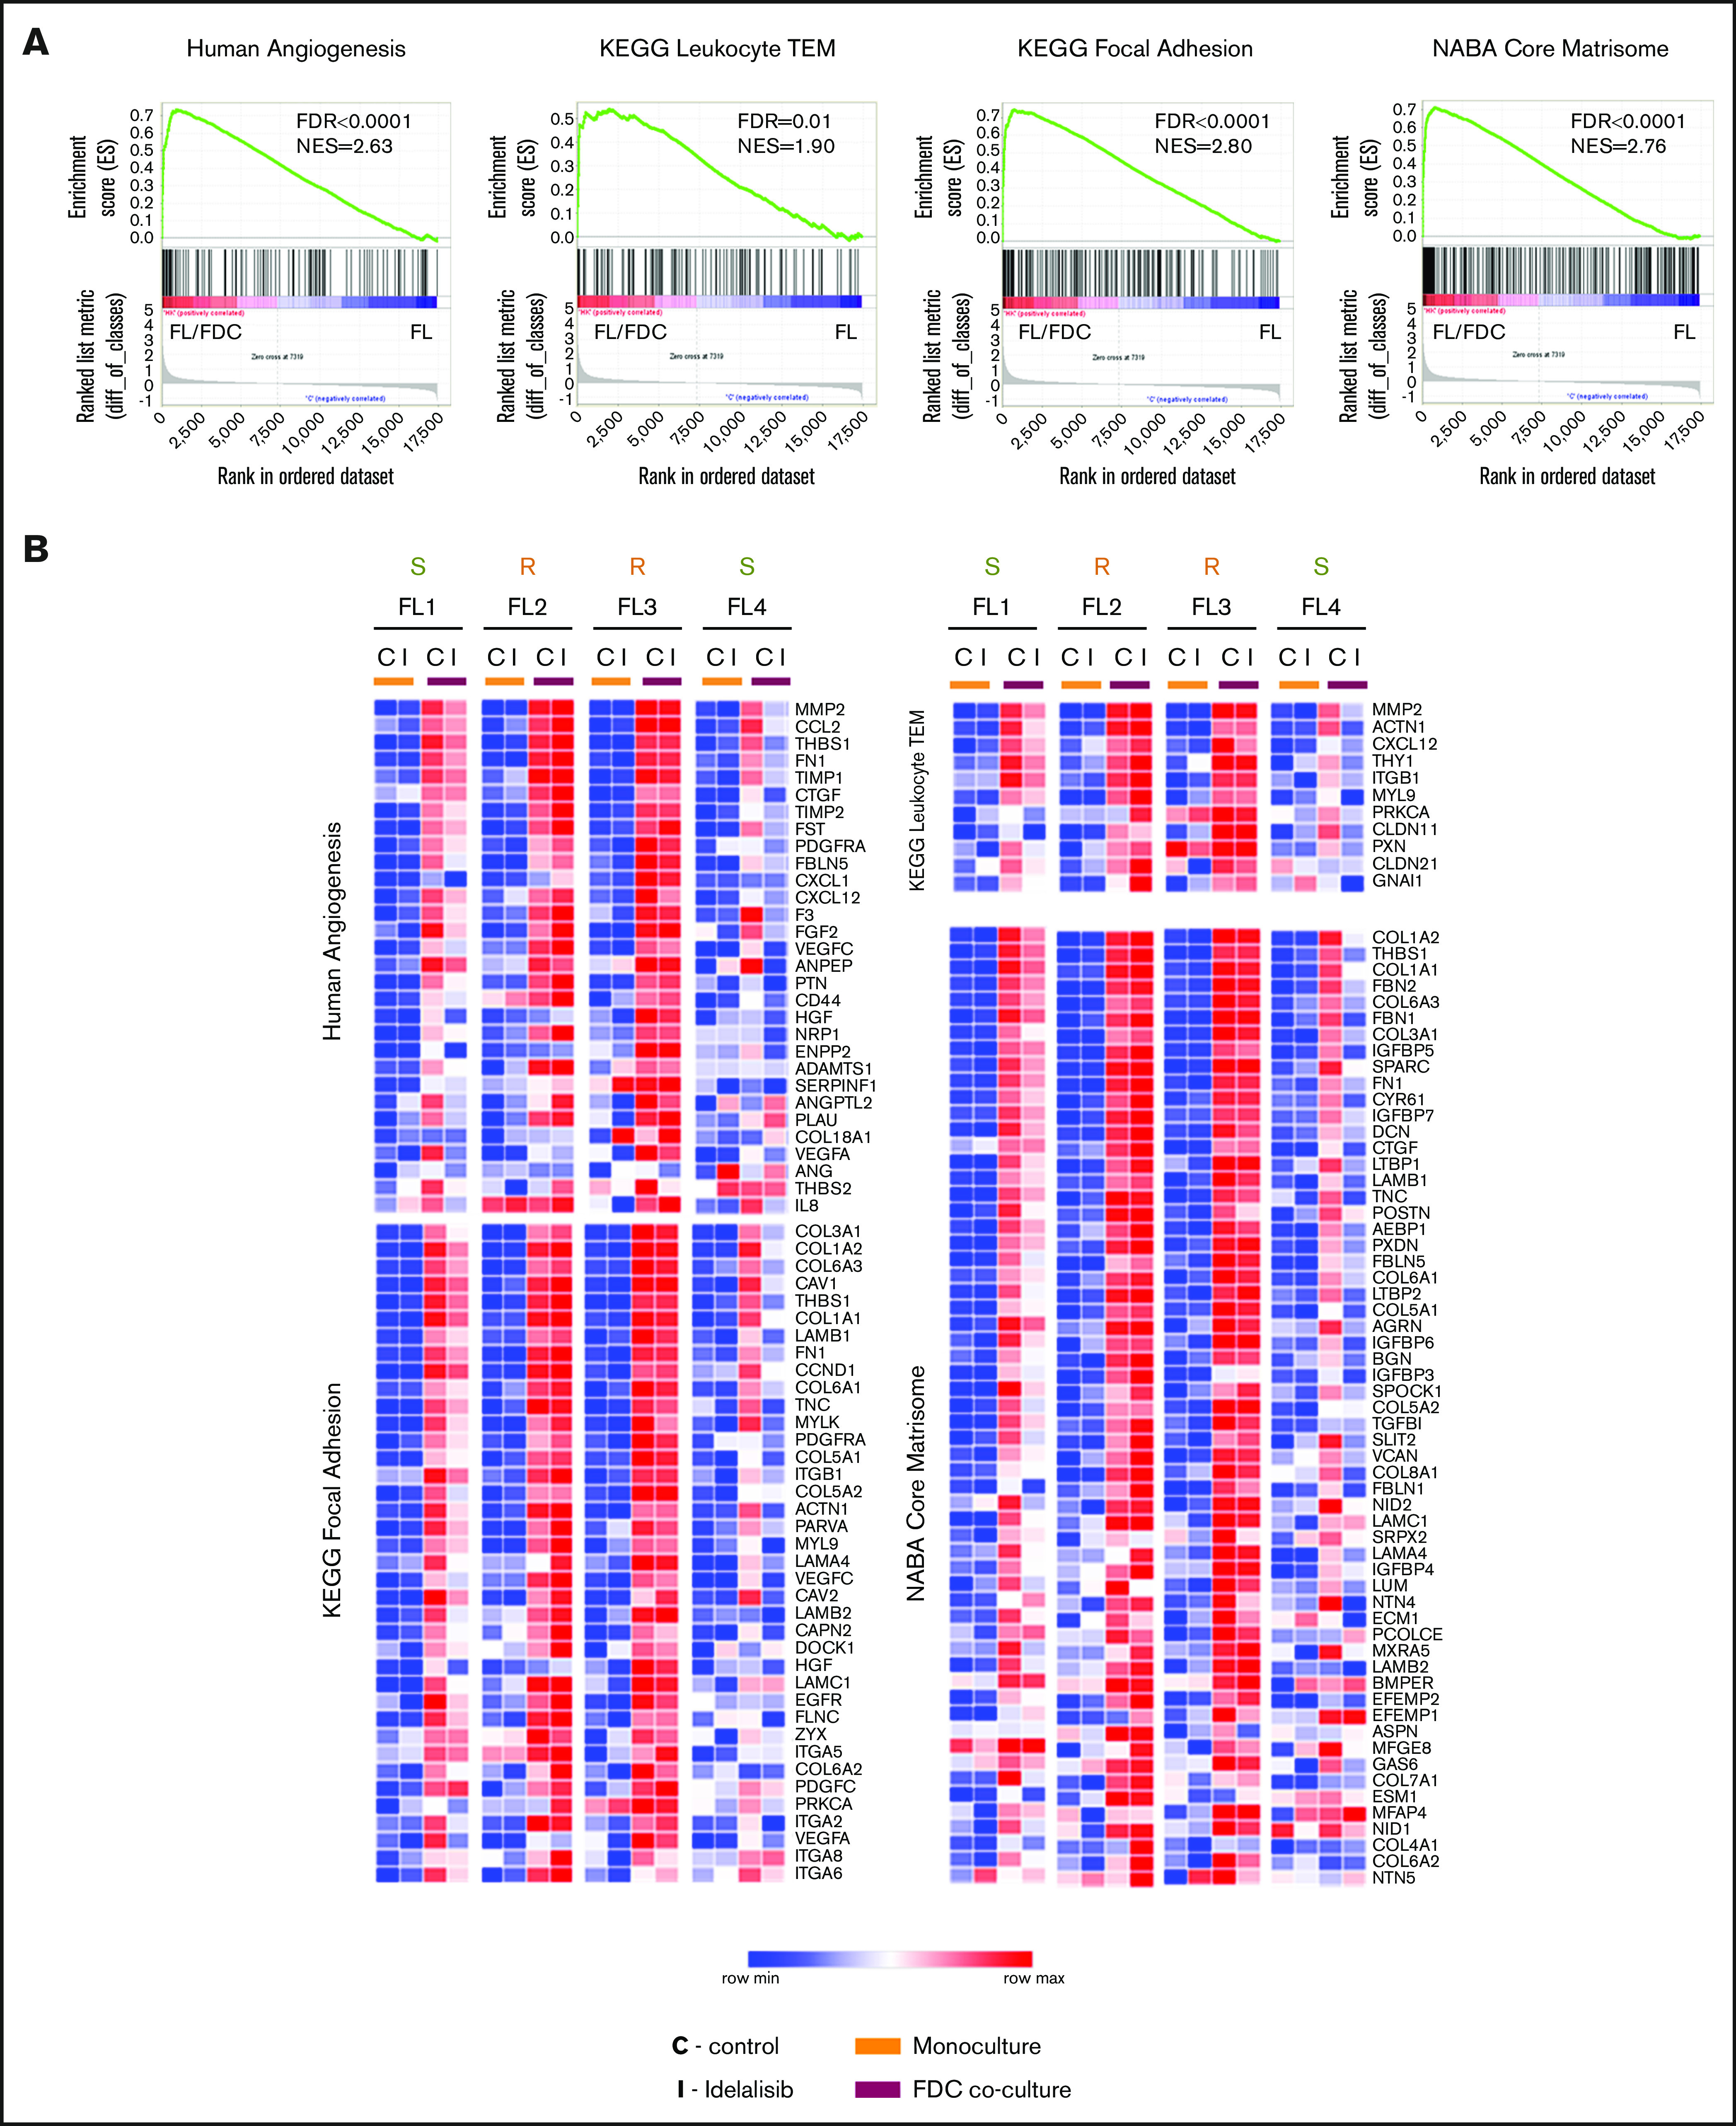
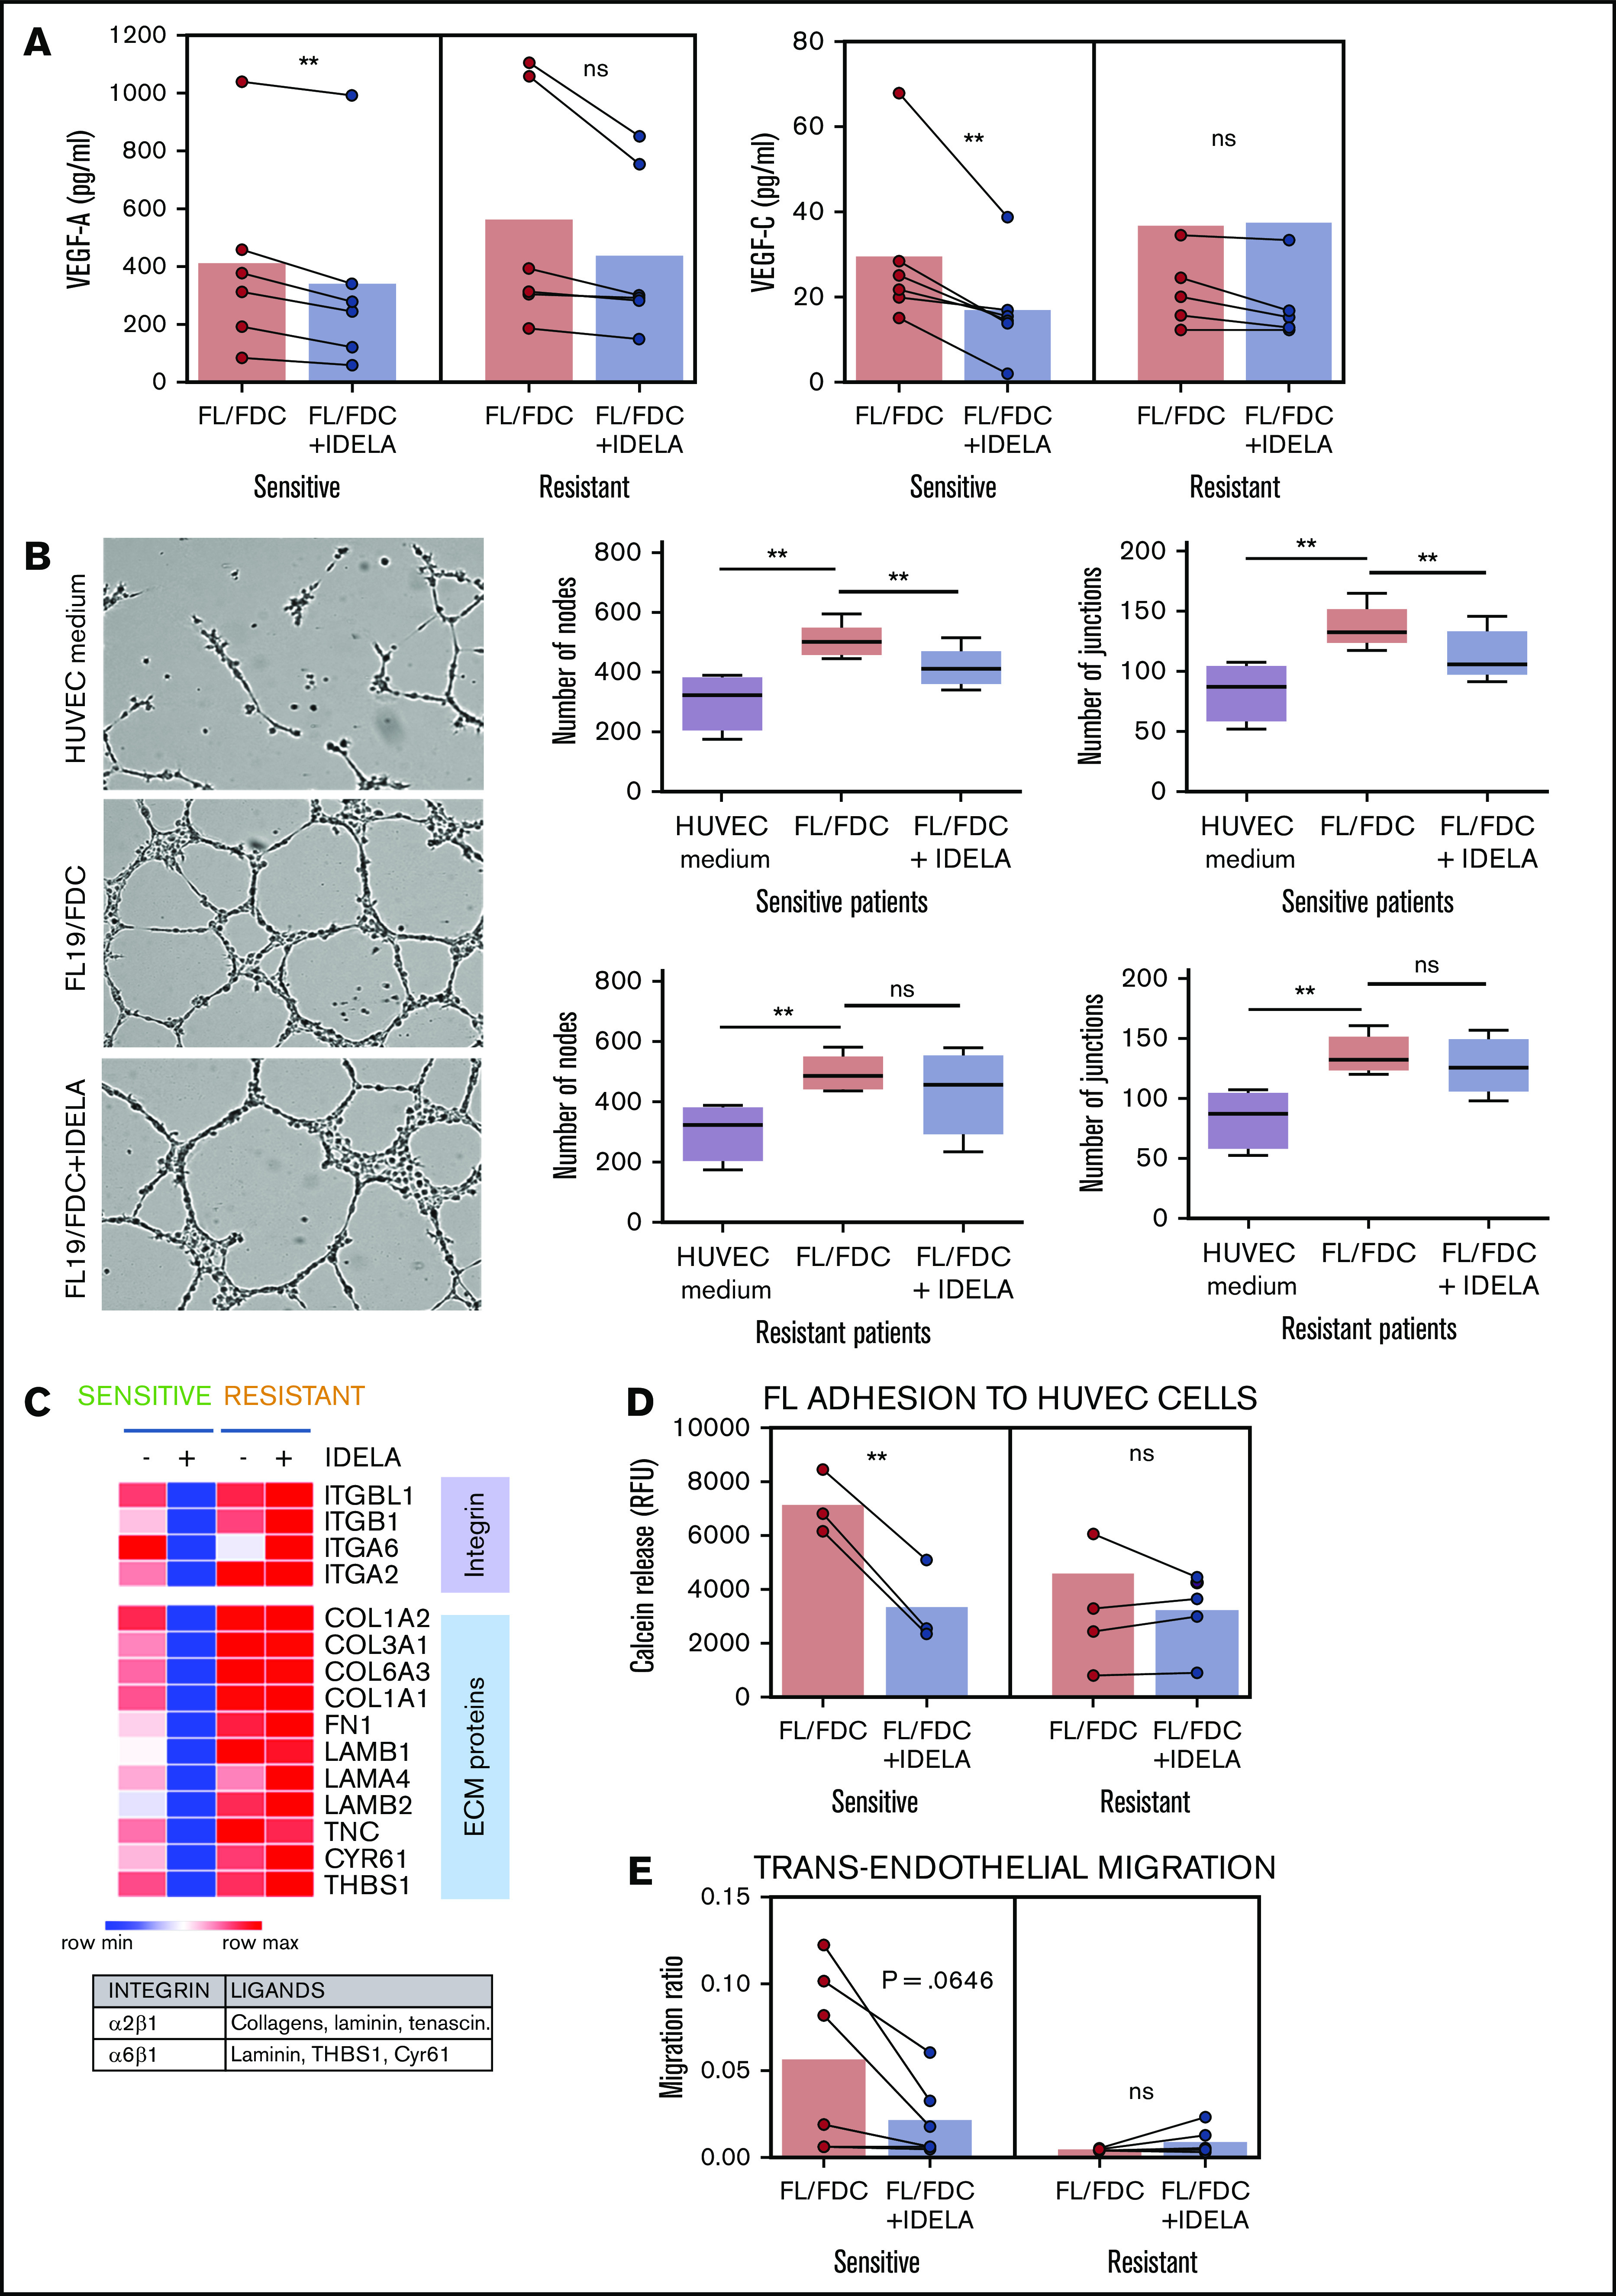
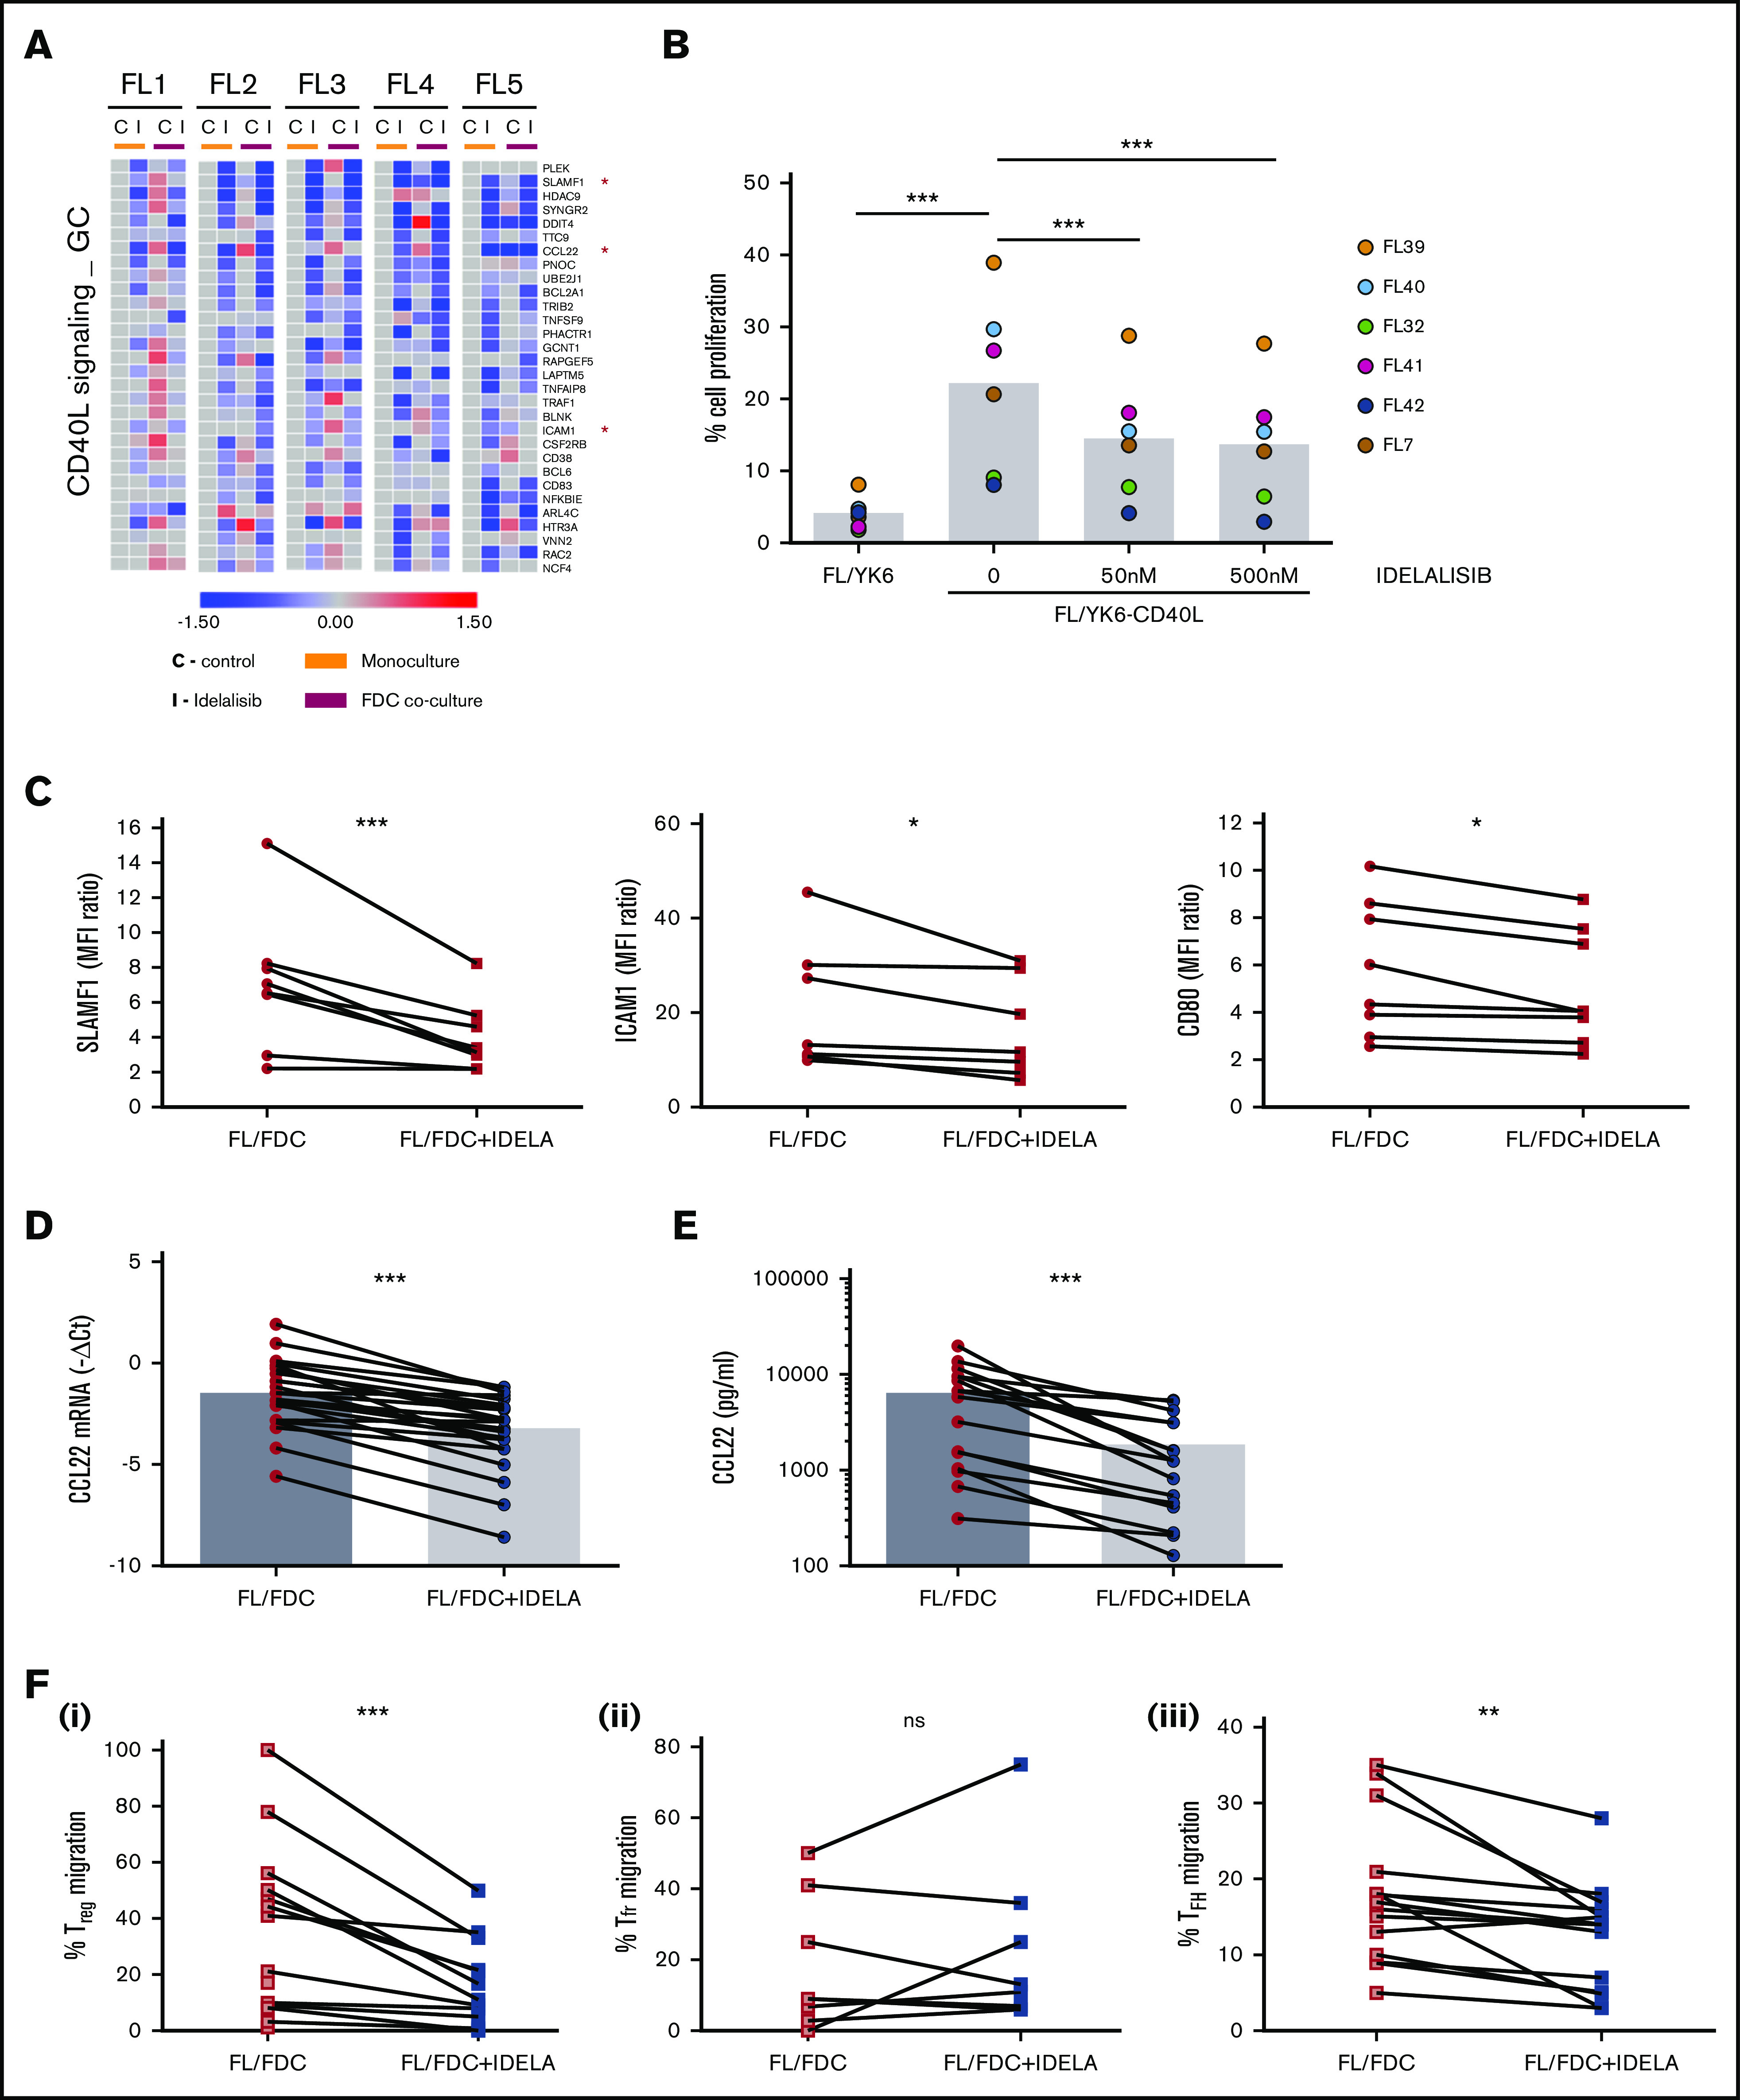
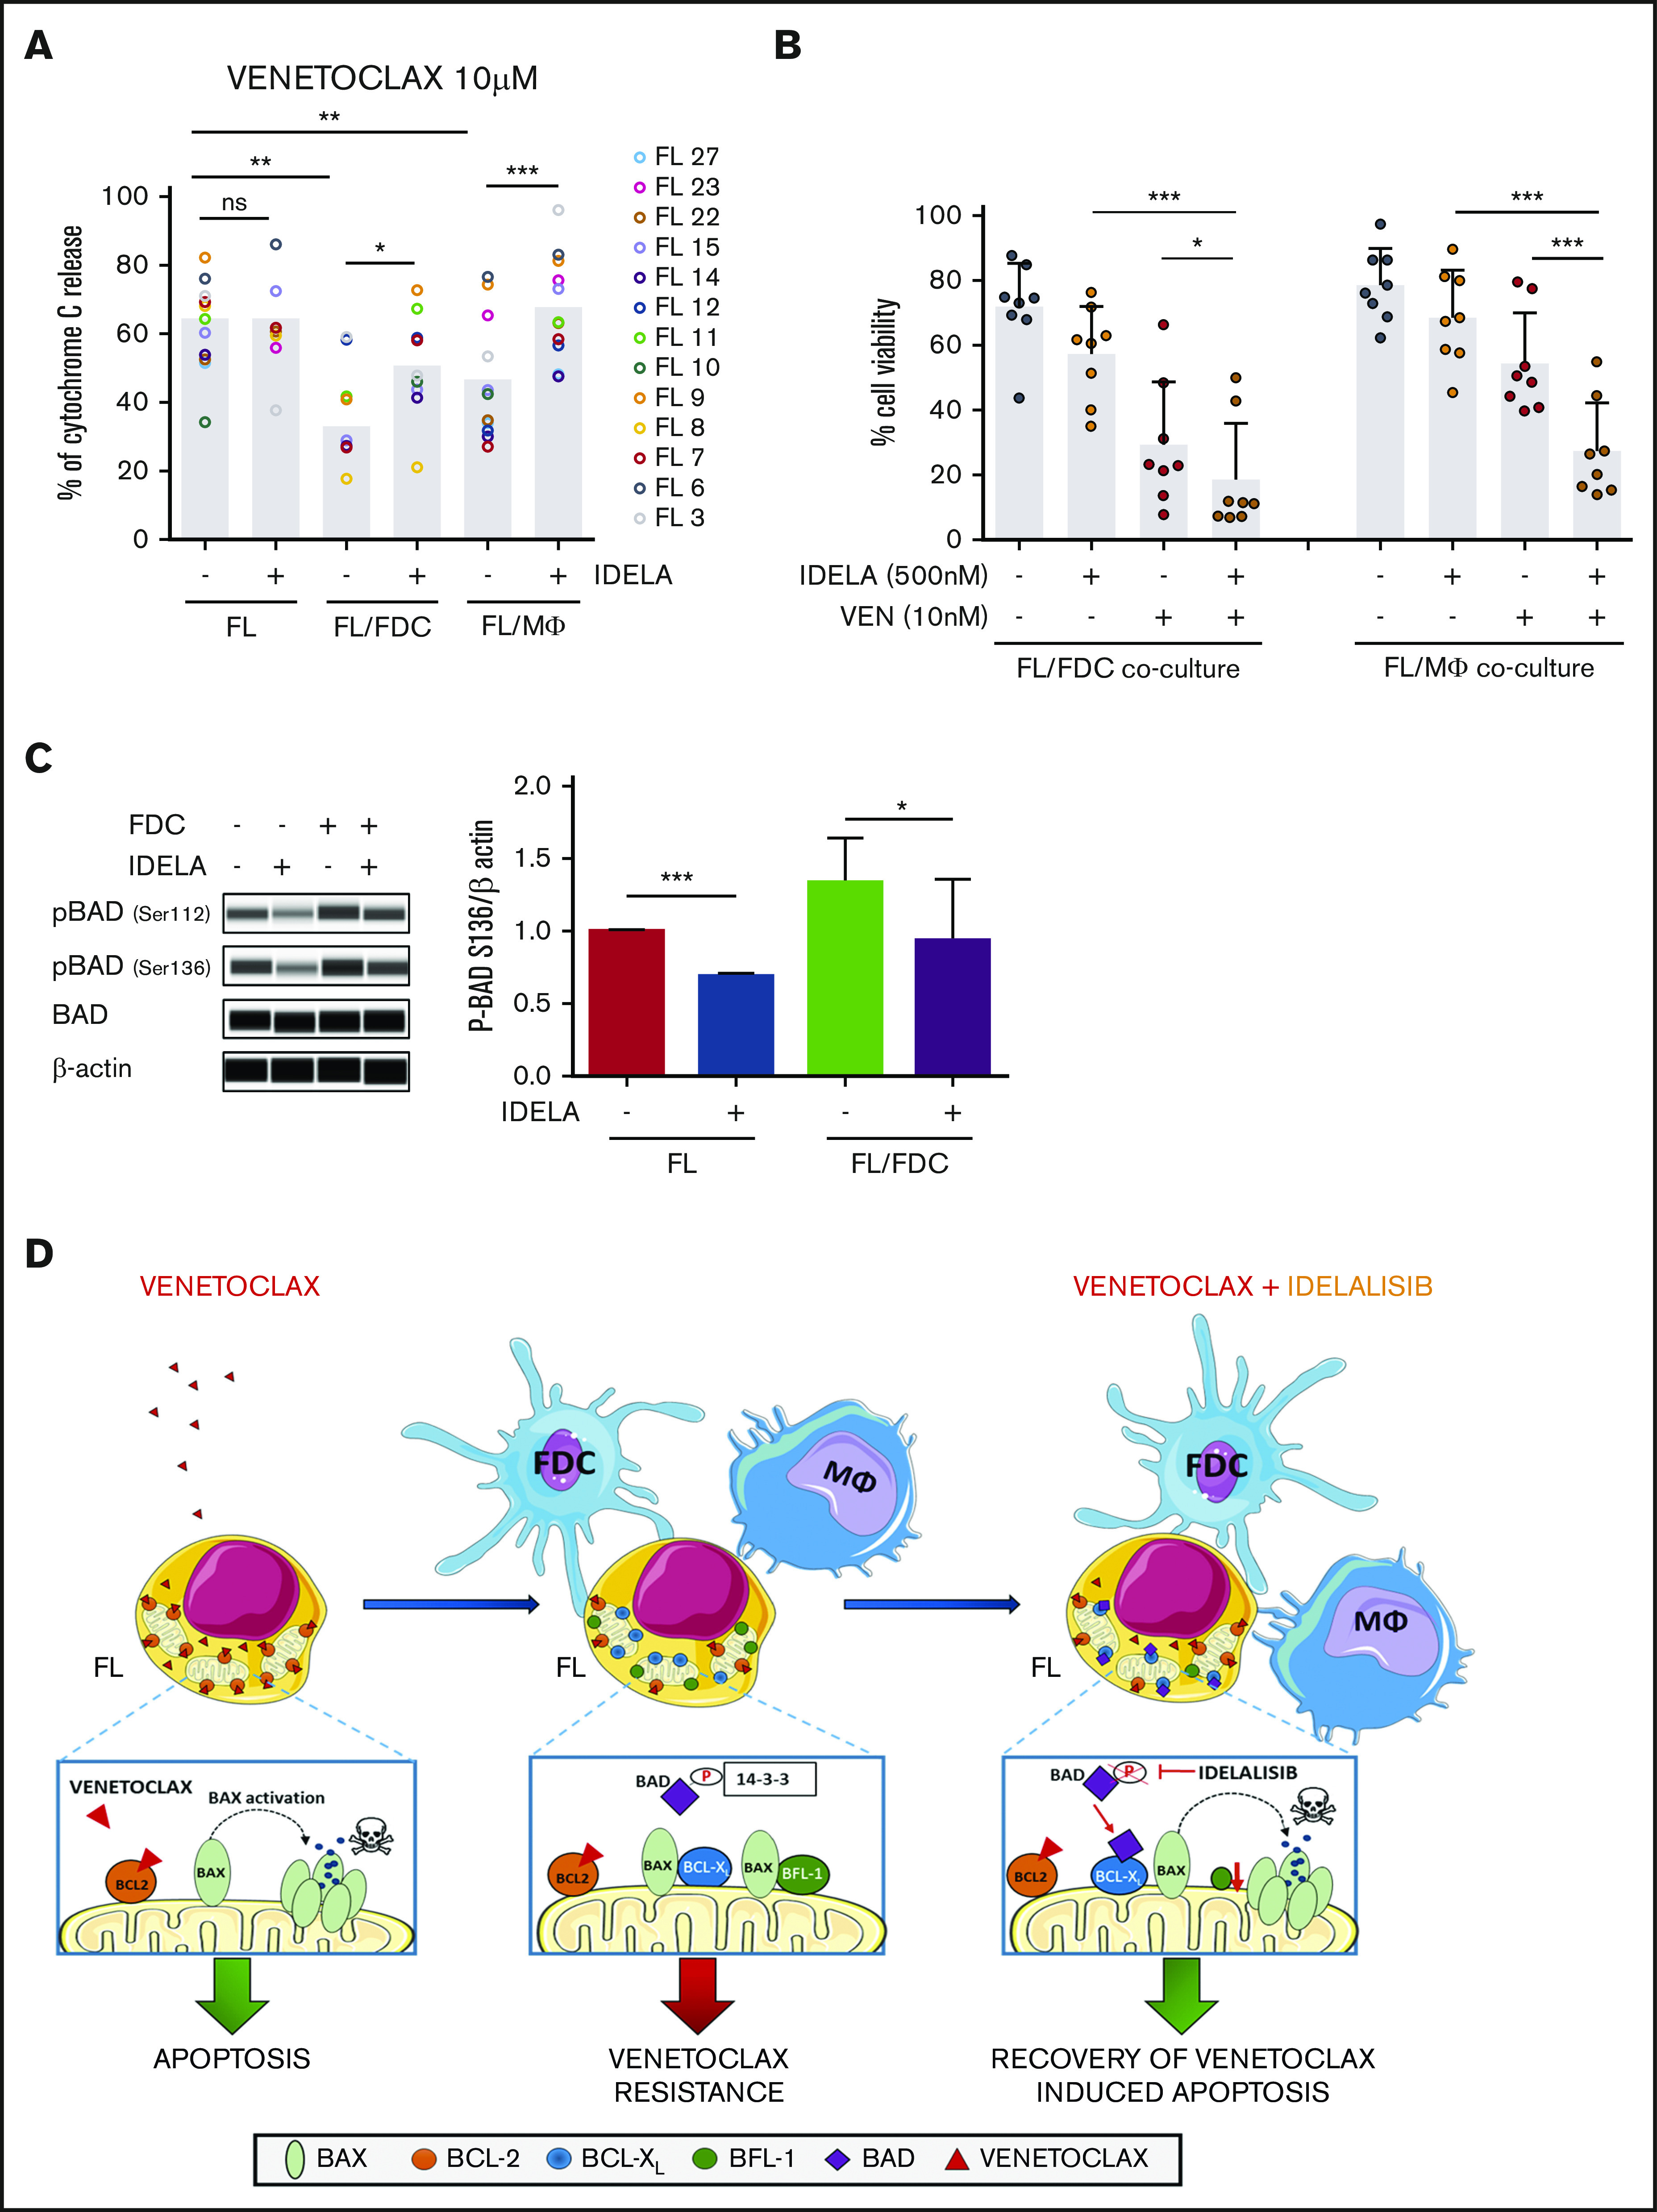
Despite idelalisib approval in relapsed follicular lymphoma (FL), a complete characterization of the immunomodulatory consequences of phosphatidylinositol 3-kinase δ (PI3Kδ) inhibition, biomarkers of response, and potential combinatorial therapies in FL remain to be established. Using ex vivo cocultures of FL patient biopsies and follicular dendritic cells (FDCs) to mimic the germinal center (n = 42), we uncovered that PI3Kδ inhibition interferes with FDC-induced genes related to angiogenesis, extracellular matrix formation, and transendothelial migration in a subset of FL samples, defining an 18-gene signature fingerprint of idelalisib sensitivity. A common hallmark of idelalisib found in all FL cases was its interference with the CD40/CD40L pathway and induced proliferation, together with the downregulation of proteins crucial for B-T-cell synapses, leading to an inefficient cross talk between FL cells and the supportive T-follicular helper cells (TFH). Moreover, idelalisib downmodulates the chemokine CCL22, hampering the recruitment of TFH and immunosupressive T-regulatory cells to the FL niche, leading to a less supportive and tolerogenic immune microenvironment. Finally, using BH3 profiling, we uncovered that FL-FDC and FL-macrophage cocultures augment tumor addiction to BCL-XL and MCL-1 or BFL-1, respectively, limiting the cytotoxic activity of the BCL-2 inhibitor venetoclax. Idelalisib restored FL dependence on BCL-2 and venetoclax activity. In summary, idelalisib exhibits a patient-dependent activity toward angiogenesis and lymphoma dissemination. In all FL cases, idelalisib exerts a general reshaping of the FL immune microenvironment and restores dependence on BCL-2, predisposing FL to cell death, providing a mechanistic rationale for investigating the combination of PI3Kδ inhibitors and venetoclax in clinical trials.


Conflict of interest statement

Conflict-of-interest disclosure: A.Y. and S.T. were Gilead Sciences employees and P.P.-G. received research funding from Gilead Sciences. The remaining authors declare no competing financial interests.

Figures

None
Graphical abstract
Figure 1.
Figure 1.
Idelalisib modulates FDC-induced gene sets in selected FL patients. (A) FL primary cells (n = 5) were isolated from monocultures or FL-FDC cocultures, treated with and without idelalisib (500 nM, 48 hours), RNA extracted, and subjected to GEP. Robust multiarray average data were analyzed with a paired (monoculture vs coculture) Limma algorithm (false discovery rate < 0.05, fc > 2). Heatmap represents the genes significantly upregulated in FL cells by FDCs in 4 of 5 patients. A differential regulation by idelalisib was acknowledged. (B) FL primary cells were isolated from FL-FDC (n = 25) cocultures treated with and without idelalisib (500 nM, 48 hours), and RNA was extracted and subjected to a multiplex reverse transcription-polymerase chain reaction by Fluidigm to characterize 39 selected genes upregulated in the FL-FDC coculture (fc > 2) and differently modulated by idelalisib (fc < 0.5 in sensitive patients). Heatmap displays fc in response to idelalisib referred to the untreated control. The cutoff to consider idelalisib sensitive was established using a paired t test comparing the expression −/+ idelalisib adjusted with the Benjamini-Hochberg method (details in supplemental Methods). (C) Boxplots for each patient of the log2 fc expression in response to idealisib. (i) Full 39-gene signature. (ii) Reduced 18-gene signature (details in supplemental Methods). The median represented in each box plot corresponds to the idelalisib score. (D) Heatmap displaying the mean expression of the selected 18 genes in either sensitive (n = 9) and resistant (n = 16) patients classified as in panel B, referred to the baseline control without coculture.
Figure 2.
Figure 2.
Idelalisib modulates biological pathways in FL-FDC cocultures. FL primary cells were isolated from monocultures or FL-FDC cocultures with/without idelalisib (500 nM, 48 hours) and subjected to GEP. Gene sets regulated by idelalisib were identified by GSEA using custom genes sets, C2 canonical pathways, C3 motifs, Hallmark, and C5-GO signatures. Enrichment plots (A) and heatmaps (B) of the corresponding leading edges of selected gene sets are shown.
Figure 3.
Figure 3.
Idelalisib reduces FDC-induced angiogenesis and TEM in sensitive patients. FL-FDC coculture supernatants with or without idelalisib (IDELA, 500 nM, 48 hours) were used to determine VEGF-A and VEGF-C protein secretion by ELISA in sensitive (n = 6) and resistant (n = 6) patients (A) and tube formation assay of endothelial HUVEC cells cultured for 24 hours with their own media alone or mixed with the corresponding supernatants (ratio 1:1) (B) (magnification ×40). Five representative images of each condition were captured using a phase-contrast microscope and analyzed by FIJI-ImageJ (angiogenesis analyzer plug-in). Representative images from a sensitive patient are shown. Node and junction numbers from sensitive (n = 5) and resistant (n = 5) patients are displayed. (C) Heatmap displaying the regulation induced by idelalisib (IDELA) in the expression of integrins and their ligands in FL cells from FL-FDC cocultures of sensitive (FL1 and FL4) and resistant patient samples (FL2 and FL3). (D) After IDELA treatment (500 nM, 48 hours) FL cells from FL-FDC cocultures with or without idelalisib (500 nM, 48 hours) of sensitive and resistant patients (n = 8) were stained with calcein and allowed to adhere for 3 hours to HUVECs. After extensive washing, the cells that remained attached were lysed, and fluorescence was measured in a Synergy HT microplate reader. (E) FL cells (n = 12) from FL-FDC cocultures with or without idelalisib (500 nM, 48 hours) were challenged to migrate for 6 hours in a gradient of FBS through trans-wells coated with HUVECs seeded on gelatin 0.1% coated + TNF-α (10 ng/mL). CD20+ cells crossing the HUVEC barrier were counted by flow cytometry. *P < .05, **P < .01. ns, not significant.
Figure 4.
Figure 4.
Idelalisib interferes with FL–T cells cross talk through CD40/CD40L and affects Treg and TFH recruitment through CCL22 downregulation. (A) FL cells (n = 5) were cultured for 48 hours with idelalisib (500 nM), and B cells were purified and subjected to GEP. Gene sets regulated by idelalisib (IDELA) in the presence or absence of FDC coculture were identified by GSEA using custom genes set (http://lymphochip.nih.gov/signaturedb/index.html). A heatmap of the leading edge corresponding to the CD40L_signaling_GC gene set is shown and represents the relative gene expression of FL cells cultured with and without IDELA compared with the untreated control. (B) FL cells (n = 7) were labeled with carboxyfluorescein succinimidyl ester (CFSE; 0.5μM) and cocultured for 5 days with and without 500 nM idelalisib on pre-established layers of FDCs engineered or not for CD40L expression (YK6 and YK6-CD40L). The percentage of viable CD19+ cells with low CFSE fluorescence was used as a read-out of proliferation. (C) SLAMF1, ICAM1, and CD80 membrane expression was evaluated by flow cytometry in FL-FDC cocultures (n = 8) with and without IDELA (500 nM, 48 hours). FL-FDC coculture supernatants with and without IDELA were used to assess CCL22 gene expression by real-time polymerase chain reaction (n = 26) using GUSB, ACTB, and B2M as houskeeping genes (D), CCL22 protein expression by ELISA (n = 16) (E), and migration of Treg cells (CD4+CD25+FoxP3+; n = 14) obtained from PBMCs of healthy donors (Fi) or migration of Tfr (CD4+CXCR5+FoxP3+; n = 9) (Fii) and TFH cells (CD4+CXCR5+CD25; n = 14) (Fiii) obtained from normal tonsils.
Figure 5.
Figure 5.
Immune microenvironment modulates FL dependence on BCL-2. (A) Mitochondrial priming with BIM peptide in FL samples. (B) Binding preferences of BH3-only proteins/ peptides with antiapoptoctic BCL-2 proteins. (C) Examples of BH3 profiles from 3 individual FL patients showing patterns of relative dependence on BCL-2 (FL13), BCL-XL (FL12), and MCL1/BFL-1 (FL14). (D) BCL-2 family protein dependence was assessed by BH3 profiling using venetoclax (VEN, n = 9), BAD (n = 13), HRK (n = 13), NOXA (n = 13), and FS2 (n = 6) in FL-FDC and FL-Mϕ cocultures. *P < .05, **P < .01.
Figure 6.
Figure 6.
Idelalisib bypasses microenvironment-derived resistance to venetoclax. (A) FL cells from monocultures (FL) or FL-FDC and FL-Mϕ cocultures treated with or without idelalisib (500 nM, 24 hours) were permeabilized and incubated for 1 hour with 10 μM venetoclax fixed/stained for intracellular cytochrome C and evaluated by flow cytometry as a read-out of apoptosis priming (n = 13). (B) Cell viability (AnnexinV/7AAD) was assessed in FL cells from FL-FDC and FL-Mϕ with and without idelalisib (500 nM) and with and without venetoclax (10 nM) after 72 hours of treatment (n = 8). (C) FL cells from monocultures or FL-FDC cocultures (n = 3) with or without idelalisib (IDELA, 500 nM, 3 hours) were lysed, and the phosphorylation of BAD at Ser112 and Ser136 was analyzed by Peggy Sue simple Western blotting and quantified by densitometry. Images from a representative case (FL3) are shown. (D) Rational of venetoclax PI3Kδ combined therapy in FL. *P < .05, **P < .01, ***P < .001.

Similar articles

Cited by

References

    1. Huet S, Sujobert P, Salles G. From genetics to the clinic: a translational perspective on follicular lymphoma. Nat Rev Cancer. 2018;18(4):224-239. - PubMed
    1. Lackraj T, Goswami R, Kridel R. Pathogenesis of follicular lymphoma. Best Pract Res Clin Haematol. 2018;31(1):2-14. - PubMed
    1. Amé-Thomas P, Tarte K. The yin and the yang of follicular lymphoma cell niches: role of microenvironment heterogeneity and plasticity. Semin Cancer Biol. 2014;24:23-32. - PubMed
    1. Amin R, Mourcin F, Uhel F, et al. . DC-SIGN-expressing macrophages trigger activation of mannosylated IgM B-cell receptor in follicular lymphoma. Blood. 2015;126(16):1911-1920. - PMC - PubMed
    1. Linley A, Krysov S, Ponzoni M, Johnson PW, Packham G, Stevenson FK. Lectin binding to surface Ig variable regions provides a universal persistent activating signal for follicular lymphoma cells. Blood. 2015;126(16):1902-1910. - PubMed

Publication types

MeSH terms