. 2020 Nov;9(22):8519-8529.
doi: 10.1002/cam4.3439. Epub 2020 Sep 8.

Serum N-Glycome analysis reveals pancreatic cancer disease signatures

Affiliations

Serum N-Glycome analysis reveals pancreatic cancer disease signatures

Gerda C M Vreeker et al. Cancer Med. 2020 Nov.

Abstract

Background &aims: Pancreatic ductal adenocarcinoma (PDAC) is an aggressive cancer type with loco-regional spread that makes the tumor surgically unresectable. Novel diagnostic tools are needed to improve detection of PDAC and increase patient survival. In this study we explore serum protein N-glycan profiles from PDAC patients with regard to their applicability to serve as a disease biomarker panel.

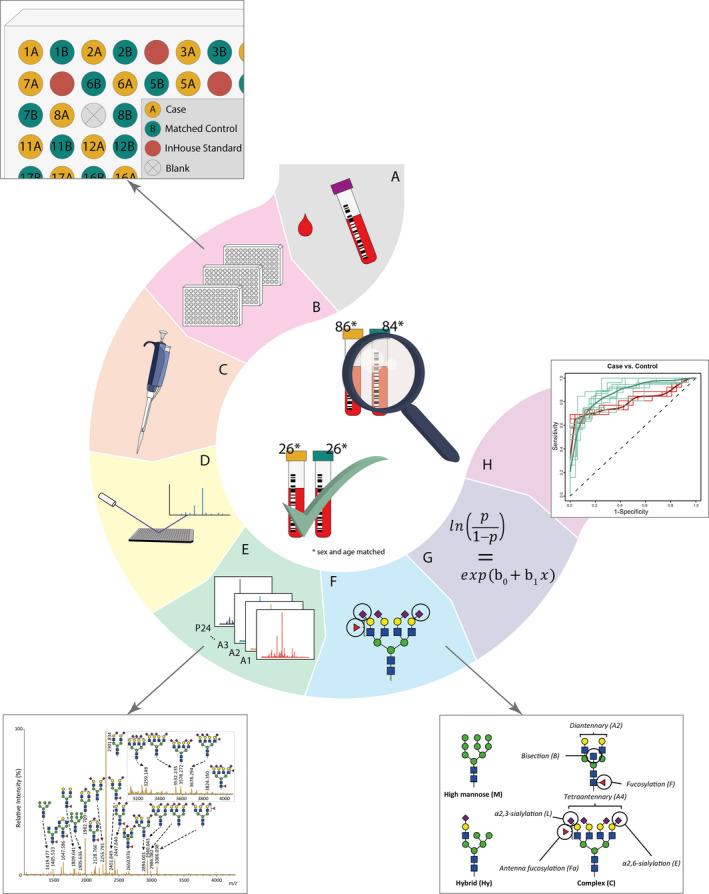
Methods: Total serum N-glycome analysis was applied to a discovery set (86 PDAC cases/84 controls) followed by independent validation (26 cases/26 controls) using in-house collected serum specimens. Protein N-glycan profiles were obtained using ultrahigh resolution mass spectrometry and included linkage-specific sialic acid information. N-glycans were relatively quantified and case-control classification performance was evaluated based on glycosylation traits such as branching, fucosylation, and sialylation.

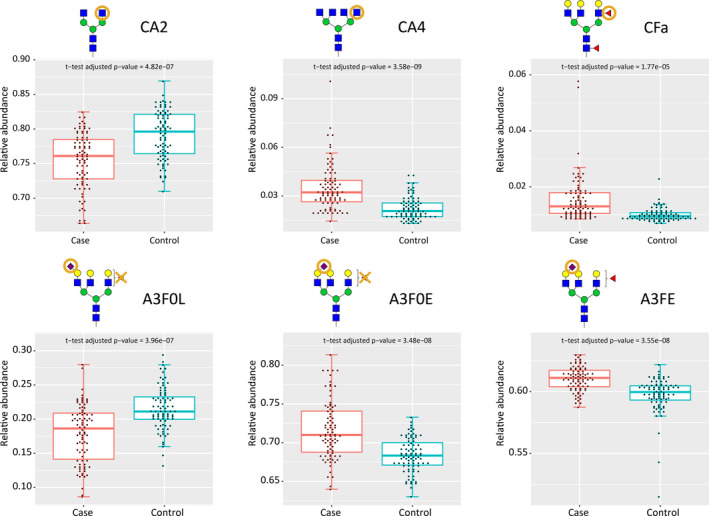
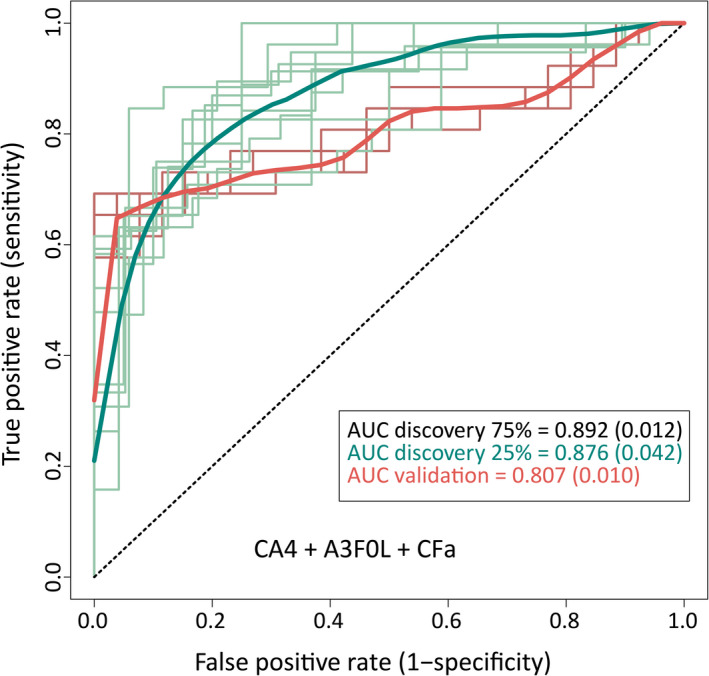
Results: In PDAC patients a higher level of branching (OR 6.19, P-value 9.21 × 10⁻¹¹ ) and (antenna)fucosylation (OR 13.27, P-value 2.31 × 10⁻⁹ ) of N-glycans was found. Furthermore, the ratio of α2,6- vs α2,3-linked sialylation was higher in patients compared to healthy controls. A classification model built with three glycosylation traits was used for discovery (AUC 0.88) and independent validation (AUC 0.81), with sensitivity and specificity values of 0.85 and 0.71 for the discovery set and 0.75 and 0.72 for the validation set.

Conclusion: Serum N-glycome analysis revealed glycosylation differences that allow classification of PDAC patients from healthy controls. It was demonstrated that glycosylation traits rather than single N-glycan structures obtained in this clinical glycomics study can serve as a basis for further development of a blood-based diagnostic test.

Keywords: N-glycome analysis; cancer biomarker analysis; mass spectrometry-based N-glycan profiling; pancreatic cancer; serum test.


Conflict of interest statement

The authors declare that there is no conflict of interest.

Figures

FIGURE 1
FIGURE 1
Workflow of N‐glycosylation analysis of discovery and validation pancreatic cancer case‐control cohorts for classification analysis. A, Collection of serum samples from pancreatic cancer patients and healthy controls. B, Random distribution of age‐and sex‐matched case‐control pairs, in‐house standards and blanks. C, Automated sample preparation including enzymatic glycan release, derivatization and purification. D, MALDI‐FTICR‐MS analysis of N‐glycome. E, MS‐spectrum preprocessing, annotation and quality control. F, Derived trait calculation for the analysis of glycosylation features. G, Logistic regression analysis of both cohorts, followed by meta‐analysis of the data. H, ROC analysis to test glycosylation traits for their classification power
FIGURE 2
FIGURE 2
Main replicated associations between N‐glycan traits and pancreatic cancer, based on the data from the discovery cohort with corresponding Student's t‐test adjusted P‐values
FIGURE 3
FIGURE 3
ROC analysis with a model based on CA4, A3F0L and CFa. The model was trained with a random selection of 75% of the spectra in the discovery cohort and applied to the remaining 25% of the cohort to test for its prediction value. Moreover, it was applied to an independent validation cohort to test for its classification power. This analysis was repeated ten times, to increase the robustness of AUCs. The means (and SDs) of 10 predictions are reported for the respective AUC

References

    1. Weinrich M, Bochow J, Kutsch AL, et al. High compliance with guideline recommendations but low completion rates of adjuvant chemotherapy in resected pancreatic cancer: a cohort study. Ann Med Surg. 2018;32:32‐37. 10.1016/j.amsu.2018.06.004 - DOI - PMC - PubMed
    1. Kardosh A, Lichtensztajn DY, Gubens MA, Kunz PL, Fisher GA, Clarke CA. Long‐term survivors of pancreatic cancer: a California population‐based study. Pancreas. 2018;47:958‐966. 10.1097/MPA.0000000000001133 - DOI - PMC - PubMed
    1. Raman P, Maddipati R, Lim KH, Tozeren A. Pancreatic cancer survival analysis defines a signature that predicts outcome. PLoS One. 2018;13:1‐18. 10.1371/journal.pone.0201751 - DOI - PMC - PubMed
    1. Navarro EB, López EV, Quijano Y, et al. Impact of BRCA1/2 gene mutations on survival of patients with pancreatic cancer: a case‐series analysis. Ann Hepato‐Biliary‐Pancreatic Surg. 2019;23:200 10.14701/ahbps.2019.23.2.200 - DOI - PMC - PubMed
    1. Lennon AM, Wolfgang CL, Canto MI, et al. The early detection of pancreatic cancer: what will it take to diagnose and treat curable pancreatic neoplasia? Cancer Res. 2014;74:3381‐3389. 10.1158/0008-5472.CAN-14-0734 - DOI - PMC - PubMed

Publication types