

Methylglyoxal-Induced Dysfunction in Brain Endothelial Cells via the Suppression of Akt/HIF-1α Pathway and Activation of Mitophagy Associated with Increased Reactive Oxygen Species
- PMID: 32899154
- PMCID: PMC7554889
- DOI: 10.3390/antiox9090820
Methylglyoxal-Induced Dysfunction in Brain Endothelial Cells via the Suppression of Akt/HIF-1α Pathway and Activation of Mitophagy Associated with Increased Reactive Oxygen Species
Abstract
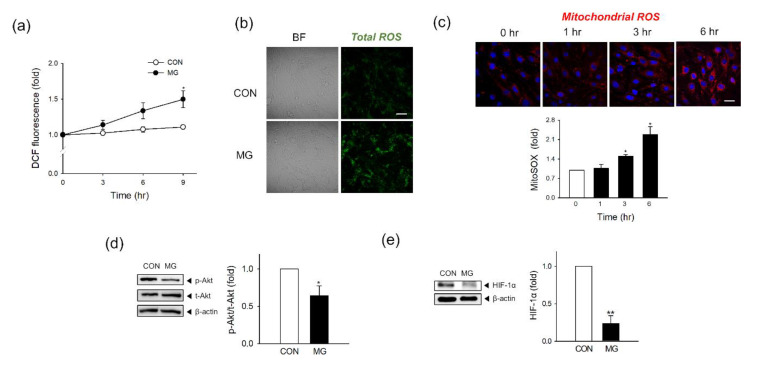
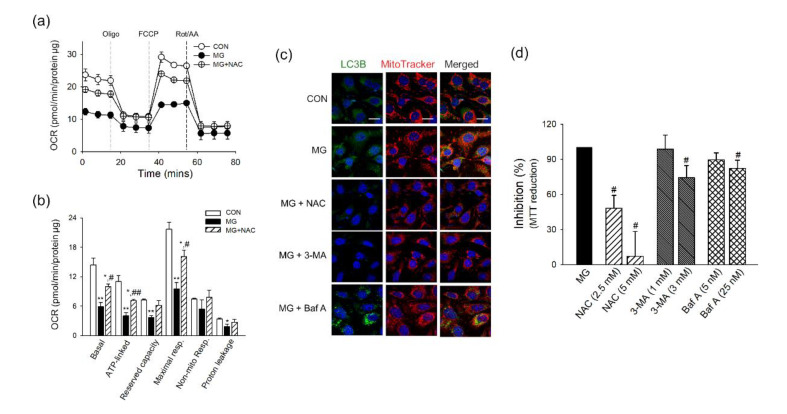
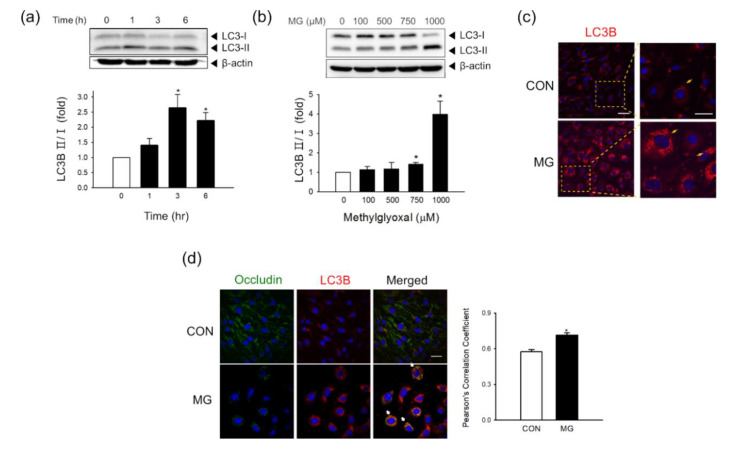
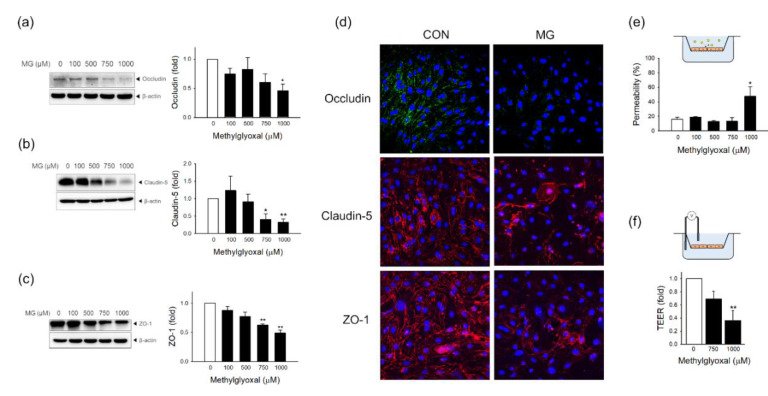
Methylglyoxal (MG) is a dicarbonyl compound, the level of which is increased in the blood of diabetes patients. MG is reported to be involved in the development of cerebrovascular complications in diabetes, but the exact mechanisms need to be elucidated. Here, we investigated the possible roles of oxidative stress and mitophagy in MG-induced functional damage in brain endothelial cells (ECs). Treatment of MG significantly altered metabolic stress as observed by the oxygen-consumption rate and barrier-integrity as found in impaired trans-endothelial electrical resistance in brain ECs. The accumulation of MG adducts and the disturbance of the glyoxalase system, which are major detoxification enzymes of MG, occurred concurrently. Reactive oxygen species (ROS)-triggered oxidative damage was observed with increased mitochondrial ROS production and the suppressed Akt/hypoxia-inducible factor 1 alpha (HIF-1α) pathway. Along with the disturbance of mitochondrial bioenergetic function, parkin-1-mediated mitophagy was increased by MG. Treatment of N-acetyl cysteine significantly reversed mitochondrial damage and mitophagy. Notably, MG induced dysregulation of tight junction proteins including occludin, claudin-5, and zonula occluden-1 in brain ECs. Here, we propose that diabetic metabolite MG-associated oxidative stress may contribute to mitochondrial damage and autophagy in brain ECs, resulting in the dysregulation of tight junction proteins and the impairment of permeability.
Keywords: brain endothelial cells; hypoxia-inducible factor 1 (HIF-1α); methylglyoxal; mitophagy; oxidative stress.
Conflict of interest statement
The authors declare no conflict of interest. The funders had no role in the design of the study; in the collection, analyses, or interpretation of data; in the writing of the manuscript, or in the decision to publish the results.
Figures


Similar articles
-
Impaired mitophagy activates mtROS/HIF-1α interplay and increases cancer aggressiveness in gastric cancer cells under hypoxia.Int J Oncol. 2016 Apr;48(4):1379-90. doi: 10.3892/ijo.2016.3359. Epub 2016 Jan 26. Int J Oncol. 2016. PMID: 26820502
-
Reactive Oxygen Species/Hypoxia-Inducible Factor-1α/Platelet-Derived Growth Factor-BB Autocrine Loop Contributes to Cocaine-Mediated Alveolar Epithelial Barrier Damage.Am J Respir Cell Mol Biol. 2016 Nov;55(5):736-748. doi: 10.1165/rcmb.2016-0096OC. Am J Respir Cell Mol Biol. 2016. PMID: 27391108 Free PMC article.
-
Cyanide preconditioning protects brain endothelial and NT2 neuron-like cells against glucotoxicity: role of mitochondrial reactive oxygen species and HIF-1α.Neurobiol Dis. 2012 Jan;45(1):206-18. doi: 10.1016/j.nbd.2011.08.005. Epub 2011 Aug 10. Neurobiol Dis. 2012. PMID: 21854848
-
Mitochondrial metabolism, redox signaling, and fusion: a mitochondria-ROS-HIF-1alpha-Kv1.5 O2-sensing pathway at the intersection of pulmonary hypertension and cancer.Am J Physiol Heart Circ Physiol. 2008 Feb;294(2):H570-8. doi: 10.1152/ajpheart.01324.2007. Epub 2007 Dec 14. Am J Physiol Heart Circ Physiol. 2008. PMID: 18083891 Review.
-
Oxidative stress and mitochondrial dysfunction-linked neurodegenerative disorders.Neurol Res. 2017 Jan;39(1):73-82. doi: 10.1080/01616412.2016.1251711. Epub 2016 Nov 3. Neurol Res. 2017. PMID: 27809706 Review.
Cited by
-
Rnf40 Exacerbates Hypertension-Induced Cerebrovascular Endothelial Barrier Dysfunction by Ubiquitination and Degradation of Parkin.CNS Neurosci Ther. 2025 Jan;31(1):e70210. doi: 10.1111/cns.70210. CNS Neurosci Ther. 2025. PMID: 39777866 Free PMC article.
-
Anserine reduces mortality in experimental sepsis by preventing methylglyoxal-induced capillary leakage.EBioMedicine. 2025 Apr;114:105644. doi: 10.1016/j.ebiom.2025.105644. Epub 2025 Mar 18. EBioMedicine. 2025. PMID: 40107203 Free PMC article.
-
Methylglyoxal attenuates isoproterenol-induced increase in uncoupling protein 1 expression through activation of JNK signaling pathway in beige adipocytes.Biochem Biophys Rep. 2021 Sep 6;28:101127. doi: 10.1016/j.bbrep.2021.101127. eCollection 2021 Dec. Biochem Biophys Rep. 2021. PMID: 34527816 Free PMC article.
-
Novel Fluorometric Assay of Antiglycation Activity Based on Methylglyoxal-Induced Protein Carbonylation.Antioxidants (Basel). 2023 Nov 22;12(12):2030. doi: 10.3390/antiox12122030. Antioxidants (Basel). 2023. PMID: 38136150 Free PMC article.
-
High-Glucose Diet Attenuates the Dopaminergic Neuronal Function in C. elegans, Leading to the Acceleration of the Aging Process.ACS Omega. 2022 Sep 2;7(36):32339-32348. doi: 10.1021/acsomega.2c03384. eCollection 2022 Sep 13. ACS Omega. 2022. PMID: 36120016 Free PMC article.
References
-
- De Ferranti S.D., de Boer I.H., Fonseca V., Fox C.S., Golden S.H., Lavie C.J., Magge S.N., Marx N., McGuire D.K., Orchard T.J., et al. Type 1 diabetes mellitus and cardiovascular disease: A scientific statement from the American Heart Association and American Diabetes Association. Circulation. 2014;130:1110–1130. doi: 10.1161/CIR.0000000000000034. - DOI - PubMed
Grants and funding
LinkOut - more resources
Full Text Sources
