. 2020 Sep 3;20(17):5004.
doi: 10.3390/s20175004.

Bathymetric Monitoring of Alluvial River Bottom Changes for Purposes of Stability of Water Power Plant Structure with a New Methodology for River Bottom Hazard Mapping (Wloclawek, Poland)

Affiliations

Bathymetric Monitoring of Alluvial River Bottom Changes for Purposes of Stability of Water Power Plant Structure with a New Methodology for River Bottom Hazard Mapping (Wloclawek, Poland)

Dariusz Popielarczyk et al. Sensors (Basel). .

Abstract

The aim of this research was to produce a new methodology for a special river bottom hazard mapping for the stability purposes of the biggest Polish water power plant: Włocławek. During the operation period of the water power plant, an engineering-geological issue in the form of pothole formation on the Wisła River bed in the gravel-sand alluvium was observed. This was caused by increased fluvial erosion resulting from a reduced water level behind the power plant, along with frequent changes in the water flow rates and water levels caused by the varying technological and economic operation needs of the power plant. Data for the research were obtained by way of a 4-year geodetic/bathymetric monitoring of the river bed implemented using integrated GNSS (Global Navigation Satellite System), RTS (Robotized Total Station) and SBES (Single Beam Echo Sounder) methods. The result is a customized river bottom hazard map which takes into account a high, medium, and low risk levels of the potholes for the water power plant structure. This map was used to redevelop the river bed by filling. The findings show that high hazard is related to 5% of potholes (capacity of 4308 m3), medium with 38% of potholes (capacity of 36,455 m3), and low hazard with 57% of potholes (capacity of 54,396 m3). Since the construction of the dam, changes due to erosion identified by the monitoring have concerned approximately 405,252 m3 of the bottom, which corresponds to 130 Olympic-size pools. This implies enormous changes, while a possible solution could be the construction of additional cascades on the Wisła River.

Keywords: GNSS/SBES measurements; Poland; Wisła River; alluvial river bottom changes; bathymetric monitoring; river bottom hazard mapping; stability; water power plant structure.


Conflict of interest statement

The authors declare no conflict of interest

Figures

Figure 1
Figure 1
Cause of the problem on power plant Włocławek—motivation for research engineering-geological case of study: (a) Planned cascade of dams with optimal regime of sedimentation and erosion of the river bottom. (b) Realized dams with current problems of erosion of river bottom (only one power plant dam was constructed). (c) Planned dams in 1956. (d) Only one dam built in 1970. (e) Planned conditions. (f) Existing conditions. (g) Improved conditions as for river bottom erosion due to a threshold. (h) Erosion of the bottom continues and the threshold is endangered.
Figure 2
Figure 2
Study area: (a) location of power station Włocławek, (b) power station construction, (c) cross sections of the measured potholes, (d) photo-documentation of the water power station.
Figure 3
Figure 3
Geological cross section of the Włocławek water power plant.
Figure 4
Figure 4
Bathymetric monitoring (a) measurements condition, (b) stages of measurements, (a1) study area measurements condition, (a2) bathymetric equipment, (a3) rough bottom and turbulent water flow, (b1b4) hydrographic motorboat trajectories during measurement stages.
Figure 4
Figure 4
Bathymetric monitoring (a) measurements condition, (b) stages of measurements, (a1) study area measurements condition, (a2) bathymetric equipment, (a3) rough bottom and turbulent water flow, (b1b4) hydrographic motorboat trajectories during measurement stages.
Figure 5
Figure 5
Study area. Potholes and cross sections.
Figure 6
Figure 6
Changes in the river bed in (a1) cross-section A-A′, (a2) cross-section A′-A′′, (a3) detail No. 1, (a4) detail No. 2, (b1) cross-section B-B′, (b2) cross-section C-C′, (b3) detail No. 3, (b4) detail No. 4.
Figure 7
Figure 7
Changes in river bottom erosion and new sediments (a) volume (m3), (b) volume in the number of Olympic-size swimming pools (3125 m3), (c) area (m2).
Figure 8
Figure 8
The situation of changes in river bottom surface (river bottom erosion, new sediment), (a) between the first and second year of monitoring, (b) between the second and third year of monitoring, (c) between the third and fourth year of monitoring, (d) between the first and fourth year of monitoring, (e) between the first year of monitoring and 1970, (f) between the fourth year of monitoring and 1970.
Figure 9
Figure 9
Graph of pothole quantification (a) volume (m3), (b) area (m2).
Figure 10
Figure 10
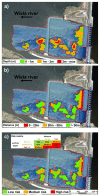
River bottom hazard map (a) classification by factor of pothole depth, (b) classification by factor of distance from structure of dam and threshold, (c) final map classification by combination of these 2 factors (methodology is in risk matrix).
Figure 11
Figure 11
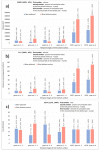
Quantification of risk categories in the special river bottom hazard map for every pothole (a) classification by factor of pothole depth, (b) classification by factor of distance from structure of dam and threshold, (c) final map classification by combination of these two factors: (a1,b1,c1), volume (m3), (a2,b2,c2) area (m2).
Figure 12
Figure 12
The sum of risk categories in the river bottom hazard map (a) classification by factor of pothole depth, (b) classification by factor of distance from structure of dam and threshold, (c) final map classification by combination of these 2 factors, (a1,b1,c1)—volume (m3), (a2,b2,c2)—area (m2).

References

    1. Magirl C.S., Hilldale R.C., Curran C.A., Duda J.J., Straub T.D., Domanski M., Foreman J.R. Large-scale dam removal on the Elwha River, Washington, USA: Fluvial sediment load. Geomorphology. 2015;246:669–686. doi: 10.1016/j.geomorph.2014.12.032. - DOI
    1. Randle T.J., Bountry J.A., Ritchie A., Wille K. Large-scale dam removal on the Elwha River, Washington, USA: Erosion of reservoir sediment. Geomorphology. 2015;246:709–728. doi: 10.1016/j.geomorph.2014.12.045. - DOI
    1. Siqueira A.G., Azevedo A.A., Dozzi L. Engineering Geology for Society and Territory-Volume 3: River Basins, Reservoir Sedimentation and Water Resources. Springer International Publishing; Berlin/Heidelberg, Germany: 2015. Monitoring program of reservoir bank erosion at porto primavera dam, parana river, sp/ms, brazil; pp. 351–355.
    1. Kong D., Miao C., Wu J., Borthwick A.G., Duan Q., Zhang X. Environmental impact assessments of the Xiaolangdi Reservoir on the most hyperconcentrated laden river, Yellow River, China. Environ. Sci. Pollut. Res. 2016;24:4337–4351. doi: 10.1007/s11356-016-7975-4. - DOI - PubMed
    1. Babiński Z., Habel M. Hydromorphological conditions of the lower Vistula in the development of navigation and hydropower. Acta Energetica. 2013;2:83–90. doi: 10.12736/issn.2300-3022.2013206. - DOI

LinkOut - more resources