Review
. 2020 Sep 4;9(3):45.
doi: 10.3390/antib9030045.

How Do mAbs Make Use of Complement to Kill Cancer Cells? The Role of Ca2

Affiliations
Review

How Do mAbs Make Use of Complement to Kill Cancer Cells? The Role of Ca2

Ronald P Taylor et al. Antibodies (Basel). .

Abstract

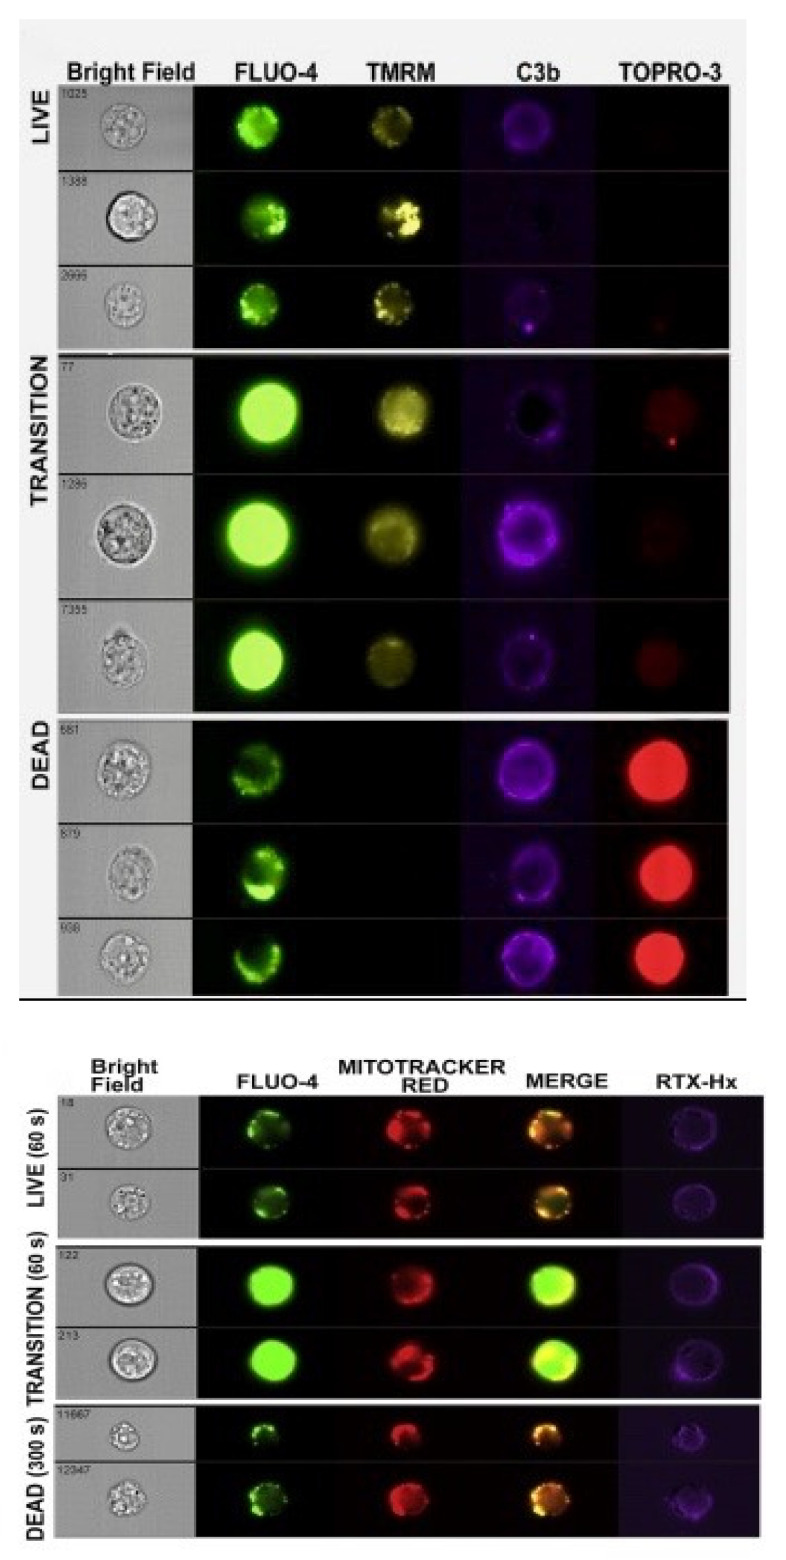
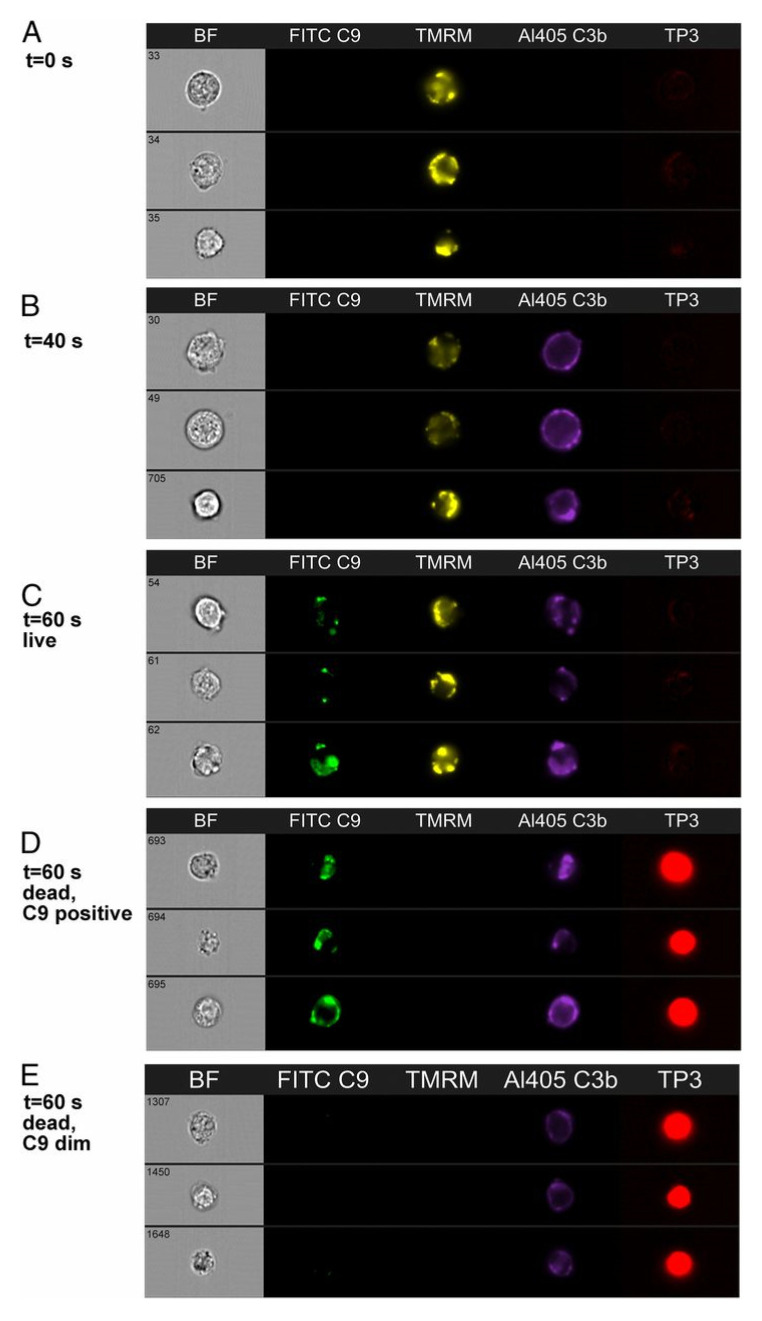
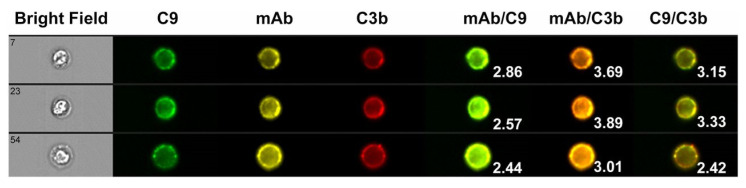
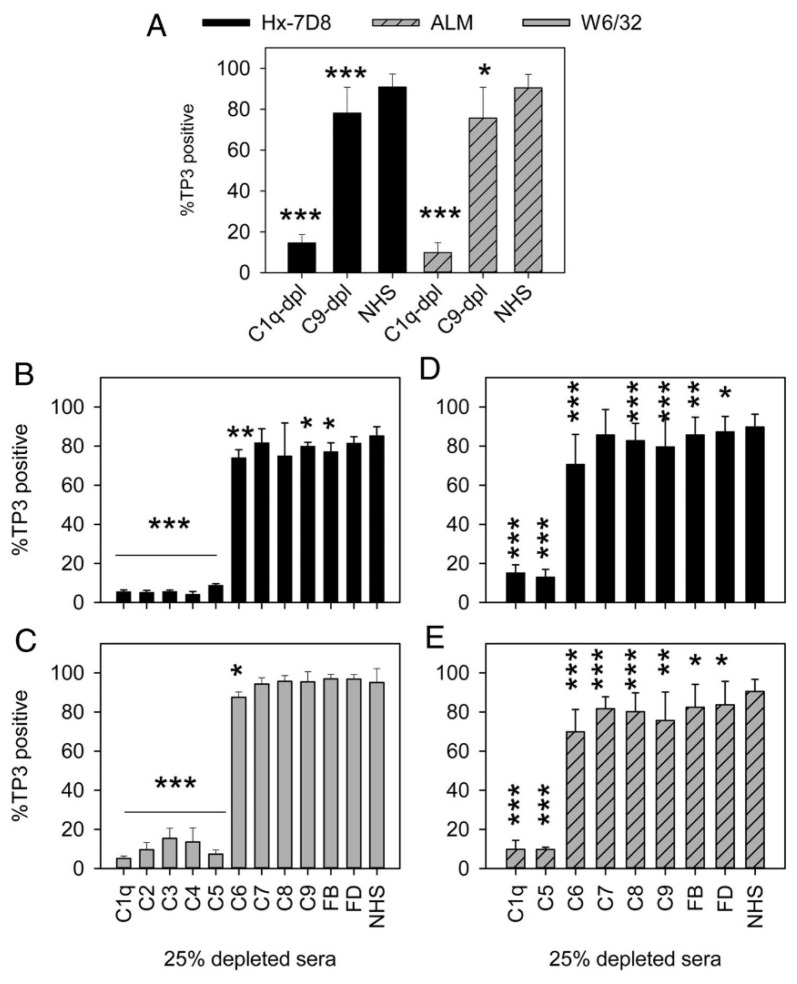
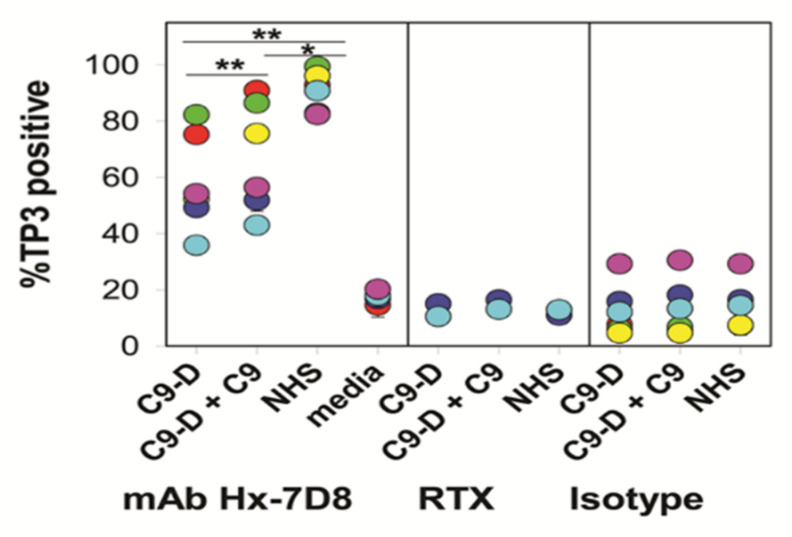
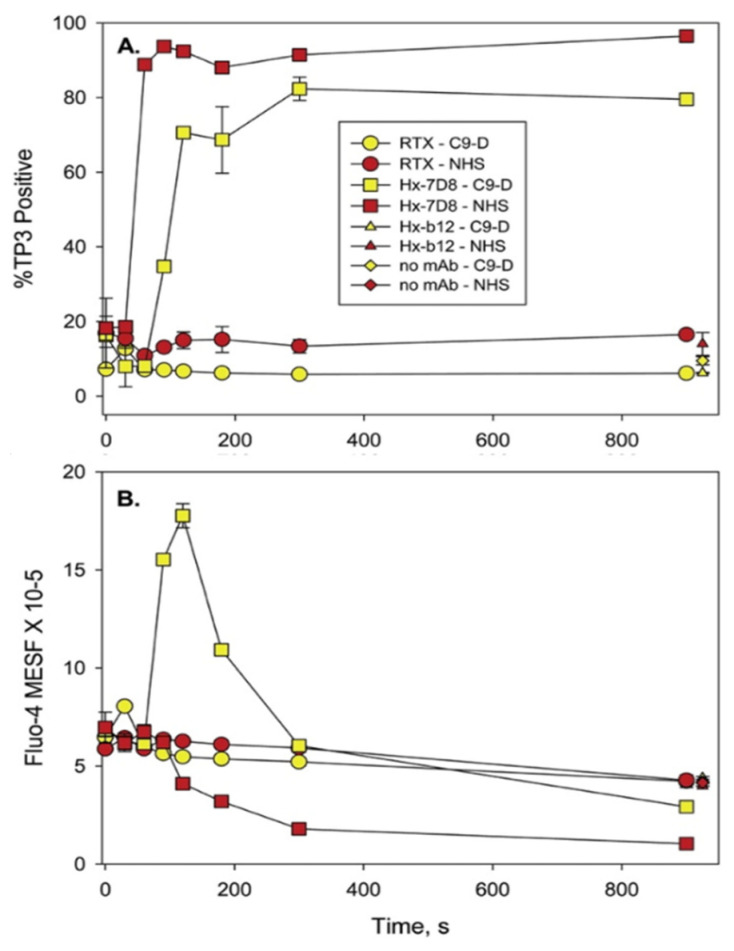
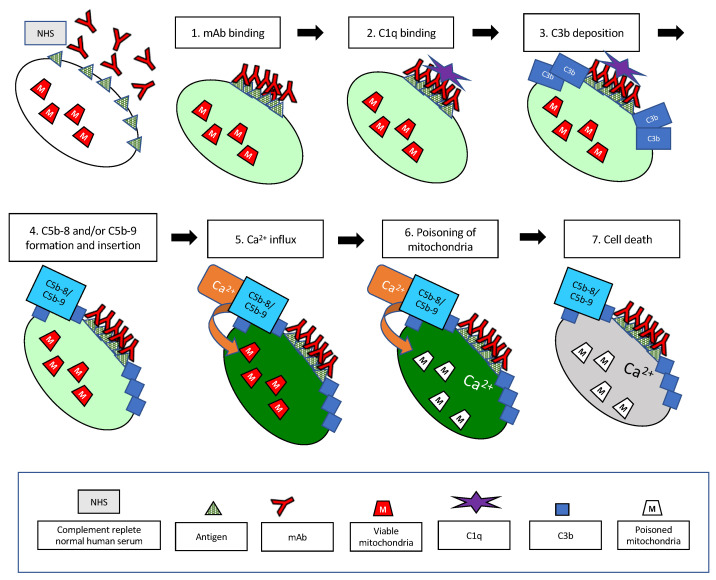
We examined the kinetics and mechanisms by which monoclonal antibodies (mAbs) utilize complement to rapidly kill targeted cancer cells. Based on results from flow cytometry, confocal microscopy and high-resolution digital imaging experiments, the general patterns which have emerged reveal cytotoxic activities mediated by substantial and lethal Ca2+ fluxes. The Ca2+ fluxes are common to the reported pathways that have been utilized by other toxins in killing nucleated cells. These reactions terminate in very high levels of cell killing, and based on these considerations, we suggest additional strategies to further enhance mAb-based targeting of cancer with complement.

Keywords: Ca2+; complement; fluorescence microscopy; therapeutic monoclonal antibodies (mAbs).


Conflict of interest statement

RPT and MAL have licensed mAbs 3E7 and 7C12 for commercial use through the University of Virginia Licensing and Ventures Group.

Figures

Figure 1
Figure 1
OFA-opsonized B cells bind more C1q than RTX-opsonized B cells. (A,B) Varying amounts of C1q were added to B cells suspended in complete RPMI 1640 medium and then reacted with either Al647 OFA, Al647 RTX, or Al647 7D8-IgG4 (K322A, does not bind C1q), all at 10 μg/mL; alternatively, no mAb was added. After incubation for 60 min at 37 °C, cells were washed and C1q binding determined by probing with FITC rabbit anti-C1q, followed by flow cytometry. (A), Raji cells. (B), Daudi cells. The results for binding of C1q to OFA-opsonized Raji and Daudi cells were fit to a binding isotherm, giving a KD of 12 and 16 nM, respectively. All Al647 mAbs bound at high levels to the cells and mAb binding was the same in the presence and absence of C1q (not shown). (C), Binding of C1q to CLL cells opsonized with either OFA or with RTX, similar conditions and analyses (KD for OFA-opsonized cells = 106 nM). (DI), Cells were combined in cold medium with Al647 mAb and varying amounts of C1q and then incubated at 37 °C. Aliquots were removed at the indicated times, quenched with ice-cold BSA-PBS, washed, probed with FITC anti-C1q, and then analyzed by flow cytometry for C1q binding (DF) and mAb binding by secondary probing with mAb HB43, specific for the Fc region of human IgG (GI). (D,G), Raji cells. (E,H), Daudi cells. (F,I), Z138 cells. Results in all panels are representative of at least two similar experiments [17].
Figure 2
Figure 2
C1q colocalizes with bound OFA on daudi cells. Daudi cells were incubated with 10 μg/mL Al647 mAb and 1.6 μg/mL Al488 C1q in medium for 60 min at 37 °C. Samples were washed, fixed, concentrated, and then analyzed by multispectral high-resolution digital imaging (HRDI). Fluorescence signals for Al647 OFA-opsonized samples were analyzed for colocalization with bound Al488 C1q. Light scatter, fluorescence and bright field images of representative doubly positive cells. Results are representative of three similar experiments. Figure 1 and Figure 2 were originally published in The Journal of Immunology. Pawluczkowycz, A.W. et al. 2009 Binding of submaximal C1q promotes CDC of B cells opsonized with anti-CD20 mAbs OFA or RTX: considerably higher levels of CDC are induced by OFA than by RTX. J. Immunol. 183: 749–758. Copyright © (2009) The American Association of Immunologists, Inc. [17].
Figure 3
Figure 3
Deposited C3b colocalizes with bound RTX. Representative images from samples opsonized as indicated and then analyzed by HRDI. Similarity bright detail score (SBDS) values given below the images are the mean ± SD (n) for values obtained on ‘n’ different replicate samples (at least 10,000 cells/sample) prepared and analyzed over a period of 18 months. The AF488 maleimide binds to the free SH group on C3b. Note how it is colocalized with mAb 7C12, specific for C3b. Reprinted from Journal of Immunological Methods, Vol. 317, 2006, Beum, P.V. et al., Quantitative analysis of protein colocalization on B cells opsonized with rituximab and complement using the ImageStream multispectral imaging flow cytometer, pp. 90–99, with permission from Elsevier, Amsterdam, The Netherlands [18].
Figure 4
Figure 4
Binding of RTX to Daudi cells in NHS induces blebbing and streaming. (AC), Images obtained at three different times for Daudi cells reacted with Al488 RTX, Al647 mAb 3E7, and NHS. (A), The 488 nm images show green RTX. (B), The 647 nm images show red mAb 3E7. (C), Merged images. Note that overlap of red and green produces orange or yellow. (D), Blebbing and streamers are generated in the absence of mAb 3E7. Daudi cells were opsonized with Al488 RTX and then reacted with NHS. Images for 488 nm are displayed at three time points. Green streamers can be seen to the left of the cells in panel A. The calibration bar in this and the following figures denotes 5 microns. The magnification in (AC) was 40×, but, in panel (D) and all other figures derived from spinning disc confocal microscopy experiments, magnification at 63× was used [19].
Figure 5
Figure 5
Binding of OFA to Daudi cells and ARH77 cells in NHS produces blebbing and streamers. (A), Daudi cells were opsonized with Al488 OFA, and then reacted with NHS and Al647 mAb 3E7; merged 488 nm/647 nm images at the indicated times. (B), ARH77 cells were opsonized with OFA, and then reacted with NHS and Al488 mAb 3E7; the 488 nm image shows mAb 3E7. (C), ARH77 cells were opsonized with FITC OFA, and then reacted with NHS and Al647 mAb 3E7; the 647 nm image shows mAb 3E7. (D,E), ARH77 cells were opsonized with Al488 RTX, and then reacted with NHS and Al647 mAb 3E7; the 488 nm image (D) shows RTX and the 647 nm image (E) shows mAb 3E7. There is neither blebbing nor streamers in panels (D,E). (F), Blebbing and streamers are generated in the absence of mAb 3E7. Daudi cells were opsonized with Al647 OFA and then reacted with NHS. The 647 nm image is displayed. Figure 4 and Figure 5 were originally published in The Journal of Immunology. Beum, P.V. et al., 2008, Complement activation on B lymphocytes opsonized with rituximab or ofatumumab produces substantial changes in membrane structure preceding cell lysis, J. Immunol. 181:822–832. Copyright © (2008) The American Association of Immunologists, Inc. [19].
Figure 6
Figure 6
Two-step CDC. Reaction of OFA-opsonized Daudi cells in C5-depleted (C5-dpl) NHS in step 1 promotes C3b/iC3b deposition and these cells are killed when they are incubated in either NHS or NHS + EDTA in step 2. (A) C3b/iC3b deposition was assayed with PE mAb 7C12 and is expressed as molecules of equivalent soluble fluorochrome (MESF). In a control to block C3b deposition, cells were opsonized in step 1 with C5-depleted NHS + EDTA; the resulting signal was only 1200 MESF. (B) The percentage of dead cells was determined based on uptake of TO-PRO-3. (A,B) Representative of five similar experiments. (C) Killing of cells under various step 2 conditions. Means and SD are displayed. Representative of three similar experiments [22].
Figure 7
Figure 7
Production of streamers requires Ca2+. OFA-opsonized cells reacted with C5-depleted NHS do not exhibit streaming when they are incubated with NHS + EDTA. (AD) Al488 mAb 3E7 was used to visualize the C3b-opsonized cells, and representative images from spinning disc confocal microscopy (SDCM) movies are displayed at time 0 (A,C) and after 304 or 300 s (B,D). A streamer in (B) is identified by the arrow. Images shown are representative of more than 20 similar experiments. Magnification at 63× in all images. Scale bar = 5 microns. (E,F) Fluorescence microscopy (FM) analysis of Al488 OFA-opsonized Daudi cells subjected to the two-step protocol and then stained with PI to identify dead (stained red) cells. Although the cells are dead (E) there is no evidence for blebbing or steamers. Magnification at 100×; scale bar = 10 microns. Representative of more than 15 fields examined in two separate experiments. Figure 6 and Figure 7 were originally published in the European Journal of Immunology, Vol. 41, Beum, P.V. et al. 2011, Penetration of antibody-opsonized cells by the membrane attack complex of complement promotes Ca2+ influx and induces streamers. Eur. J. Immunol. pp. 2436–2446, © 2011 Wiley-VCH Verlag GmbH & Co. KGaA, Weinheim [22].
Figure 8
Figure 8
Hexamer-forming CD20 mAbs efficiently utilize small amounts of C1q to mediate CDC. Hexamer-forming CD20 mAbs bind to B cells and promote C1q binding, CDC and efficiently utilize small amounts of C1q to mediate CDC. (A) Saturating amounts of mAbs were reacted with cells for 30 min at RT in media, and after two washes, binding was evaluated by development with Al647 mAb HB43 (10 μg/mL, 30 min on ice), specific for human IgG Fc region. All points are in duplicate, and means and SD are displayed. (B,C) Kinetics of mAb binding and C1q uptake were determined based on reacting mAbs (10 μg/mL) with cells in 5% NHS for varying times at 37 °C. After washing, development was based on probing with (B) Al647 mAb HB43 or (C) FITC anti-C1q antibody. (D) CDC with 10 μg/mL mAb in 50% C1q-depleted serum supplemented with varying amounts of C1q for 20 min at 37 °C. % TO-PRO-3 (TP3)-positive cells define % CDC. (E) Cells were reacted with mAbs at 37 °C for 20 min in 50% NHS, and CDC was evaluated after TO-PRO-3 staining. (F) Kinetics of killing were determined after reacting cells with 10 μg/mL mAb in 50% NHS for varying times. (AF) Each graph is representative of 2–4 similar experiments. Results for CLL cells shown in this figure were obtained with cells from four CLL patients. Cytotoxicity for CLL cells reacted in the absence of mAbs, or plus mAb in media, or in heat-inactivated NHS, was less than 6% [16].
Figure 9
Figure 9
Four-color confocal fluorescence microscopy analyses of the kinetics of CDC of Raji cells mediated by 7D8-Hx. Delineation of discrete steps in CDC of Raji cells: four-color confocal fluorescence microscopy analyses of the kinetics of CDC of Raji cells mediated by 7D8-Hx. For clarity, images based on analyses with two colors at advancing times during the reaction are displayed. Upper panel: Al405 mAb 3E7 (C3b/iC3b, light blue) and TO-PRO-3 (dead cells, bright purple). Middle panel: Al405 mAb 3E7 (C3b/iC3b) and Fluo-4 (Ca2+, green). Lower panel: Al405 mAb 3E7 (C3b/iC3b) and TMRM (viable mitochondria red). White arrows mark a representative cell in the transition state at 90 s and dead at 270 s. Yellow arrows identify a cell in which the mitochondria remain viable through the transition-state intermediate. Inset: Amplified image of a single cell at 270 s (Fluo-4) and 135 s (TMRM). Note that the green signal due to Fluo-4 in the dead cell (at 270 s) is localized to places in the live cell in which viable mitochondria (positive TMRM staining) are identified at 135 s. Representative of more than 10 similar experiments [16].
Figure 10
Figure 10
Four-color kinetic analyses by HRDI of the transition-state intermediate. Delineation of discrete steps in CDC: Four-color kinetic analyses by multispectral fluorescence imaging. Top panel: Images of representative 7D8-Hx treated cells that are either alive, in transition, or are dead. Bottom panel: Representative images for cells reacted with Al647 RTX-Hx (E345R) after 60 s (live and transition) or after 300 s (dead). The cells were presumed to be dead by 300 s based on the decrease in the mean Fluo-4 signal. Figure 8, Figure 9 and Figure 10 are reprinted from Molecular Immunology, Vol. 70, 2016, Lindorfer, M. A. et al. Real-time analysis of the detailed sequence of cellular events in mAb-mediated complement-dependent cytotoxicity of B cell lines and of CLL B cells, pp. 13–23 with permission from Elsevier [16].
Figure 11
Figure 11
mAb 7D8-Hx mediates CDC of Z138 cells in C9-depleted NHS. Distinct cellular steps in the CDC pathway are illustrated with representative images from an experiment in which Z138 cells were reacted with 7D8-Hx in NHS. (A) At zero time, cells are alive (TMRM positive, TP3 negative). (B) After 40 s, C3b has deposited, but the cells are still alive, based on the positive TMRM signal and the lack of staining by TP3. (C,D) After 60 s, C9 has bound to the cells. Note that both live (C) and dead (D) (TP3 positive, TMRM negative) C9-positive cells can be seen. (E) After 60 s, 8.6% of dead cells are C9 dim [20].
Figure 12
Figure 12
C3b and C9 are colocalized on B cells opsonized with mAb 7D8-Hx. C3b and C9 are colocalized on B cells with opsonizing mAb 7D8-Hx after reaction for brief periods in 50% NHS. Data were obtained based on multispectral high-resolution fluorescence imaging by flow cytometry. CLL cells were reacted with Al546 Hx-7D8 in NHS for 8 min and after two washes were probed with both FITC mAb aE11 and with Al594 3E7 (for C3b/iC3b). Images representative of triple-positive cells are shown. Bright detail similarity score (BDSS) values for the merged images of the individual cells are given. A very high degree of colocalization of Hx-7D8 with C3b is evident, and colocalization of the mAb with C9 is also observed [20].
Figure 13
Figure 13
C9-depleted sera support CDC mediated by several different mAbs. Sera depleted of one of several terminal (but not upstream) classical pathway complement components support CDC mediated by several different mAbs. (A) mAbs Hx-7D8 and ALM promote robust CDC of CLL cells after reaction for 15 min in 25% NHS or C9-dpl sera. The results are the average for duplicate determinations on cells from eight different CLL patients for Hx-7D8 and the average for cells from four of the eight patients for ALM; means and SD are displayed. No CDC is observed if Hx-7D8 or ALM is reacted with CLL cells in C1q-dpl sera. Differences between C1q-dpl and C9-dpl versus NHS are significant, as illustrated. (B,C) Both Hx-7D8 and W6/32 mediate CDC of Z138 cells in sera depleted of terminal pathway components or of complement factor B (FB) or complement factor D (FD). n = 4–6. Significant differences versus NHS are noted. (D,E) Both Hx-7D8 and ALM mediate CDC of CLL cells in sera depleted of terminal pathway components or of FB or FD. The averaged results for duplicate determinations on cells from eight different CLL patients are provided. The results for C1q-dpl, C9-dpl, and NHS are the same as in (A), and are repeated to allow for ready inspection and comparison with the other depleted sera. * p < 0.05, ** p < 0.01, *** p < 0.001. Figure 11, Figure 12 and Figure 13 were originally published in The Journal of Immunology. Cook, E. M. et al. 2016, Antibodies that efficiently form hexamers upon antigen binding can induce complement-dependent cytotoxicity under complement-limiting conditions. J. Immunol. 197:1762–1775. Copyright © (2016) The American Association of Immunologists, Inc. [20].
Figure 14
Figure 14
C9-deficient serum can mediate high levels of CDC of CLL cells opsonized with mAb Hx-7D8. C9-deficient (C9-D) serum lacks any detectable C9, but can mediate high levels of lysis of CLL cells reacted with mAb Hx-7D8. The ability of mAb Hx-7D8 to promote CDC in CLL cells from six different patients was evaluated in either: C9-D serum (25%), C9-D serum (25%) supplemented with 18 μg/mL C9, or NHS (25%). Controls included Hx-7D8 reacted with cells in media (4 of 6 CLL cell samples) as well as cells reacted with RTX (2 CLL samples) or an isotype control (Isotype, Hx-b12, 2–4 CLL samples) reacted with CLL cells in all three conditions. Each color represents a different patient (pn); all determinations were in duplicate or triplicate and means and SD are provided. Mean % CDC and SD: 58 ± 17% for CLL cells reacted in C9-D serum; 67 ± 20% for CLL cells reacted in C9-D serum + C9; 91 ± 7% for CLL cells reacted in NHS. * p < 0.05; ** p < 0.01 [21].
Figure 15
Figure 15
Analysis of CDC and Ca2+ fluxes in Fluo-4-loaded CLL cells. (A) CDC kinetics mediated by Hx-7D8 in C9-D serum (pn 2014, red circles, Figure 14) were slower and killing peaked at approximately 80%, compared to results in intact NHS where killing reached 95%. CDC mediated by RTX was low under both conditions. (B) During CDC mediated by Hx-7D8 (also pn 2014), the Fluo-4 signal is increased considerably and remains substantially elevated for 3 min (indicative of the transition-state intermediate) for CLL cells reacted with Hx-7D8 in C9-D serum. Controls include cells reacted for 900 s in NHS or in C9-D serum, with either the isotype control Hx-b12, or with no mAb. Figure 14 and Figure 15 are reprinted from Clinical Immunology, Vol. 181, 2017, Taylor, R.P. et al. Hexamerization-enhanced CD20 antibody mediates complement-dependent cytotoxicity in serum genetically deficient in C9, pp. 24–28, with permission from Elsevier [21].
Figure 16
Figure 16
Simplified schematic illustrating the key steps in the CDC reaction that are described in this review. The reaction takes place at 37 °C in 50% NHS, and the mAb is at a concentration of 10 μg/mL. The target cell is internally labeled with Fluo-4. The pale green color of the cell illustrates the low, physiological levels of cytoplasmic Ca+2. (1). Multiple mAbs bind to the cell in proximity, ideally forming hexamers. (2). C1q then binds to the mAb hexamers on the cell. (3). Downstream, C3b is deposited on the cell, closely associated with bound mAb. (4). After sufficient C3b has deposited on the cell, C5b is generated, and C5b-8 and/or C5b-9 assemble close to the sites of C3b deposition. (5). The pores formed in the plasma membrane by C5b-8 and/or C5b-9 allow the influx of large amounts of Ca2+ and the cell turns bright green (the live, transition-state intermediate). (6). Soon thereafter, the Ca2 in the cell penetrates and poisons the mitochondria. (7). This is rapidly followed by cell death. Coincident with cell death, most of the Fluo-4 leaks out of the cell. Not shown are the TNTs that are generated in the cells soon after the initial influx of Ca2+, during steps (5) and (6). Approximate times for these events are provided in Table 1, and all of the reactions are fast. The hexamer-forming mAbs and C1q are bound to the cell in less than 1 min, and the cells are killed in less than 2 min.

References

    1. Cavaillon J.M., Sansonetti P., Goldman M. 100th anniversary of Jules Bordet’s Nobel prize: Tribute to a founding father of immunology. Front. Immunol. 2019 doi: 10.3389/fimmu.2019.02114. - DOI - PMC - PubMed
    1. Reis E.D., Mastellos D.C., Ricklin D., Mantovani A., Lambris J.D. Complement in cancer: Untangling an intricate relationship. Nat. Rev. Immunol. 2017 doi: 10.1038/nri.2017.97. - DOI - PMC - PubMed
    1. Ricklin D., Mastellos D.C., Reis E.S., Lambris J.D. The renaissance of complement therapeutics. Nat. Rev. Nephrol. 2018;14:26–47. doi: 10.1038/nrneph.2017.156. - DOI - PMC - PubMed
    1. Mastellos D.C., Ricklin D., Lambris J.D. Clinical promise of next-generation complement therapeutics. Nat. Rev. Drug Disc. 2019;18 doi: 10.1038/s41573-019-0031-6. - DOI - PMC - PubMed
    1. Golay J., Taylor R.P. The role of complement in the mechanism of action of therapeutic anti-cancer mAbs. Antibodies. Submitted. - PMC - PubMed

LinkOut - more resources