. 2020 Sep 6;9(9):2037.
doi: 10.3390/cells9092037.

Gateways for Glutamate Neuroprotection in Parkinson's Disease (PD): Essential Role of EAAT3 and NCX1 Revealed in an In Vitro Model of PD

Affiliations

Gateways for Glutamate Neuroprotection in Parkinson's Disease (PD): Essential Role of EAAT3 and NCX1 Revealed in an In Vitro Model of PD

Silvia Piccirillo et al. Cells. .

Abstract

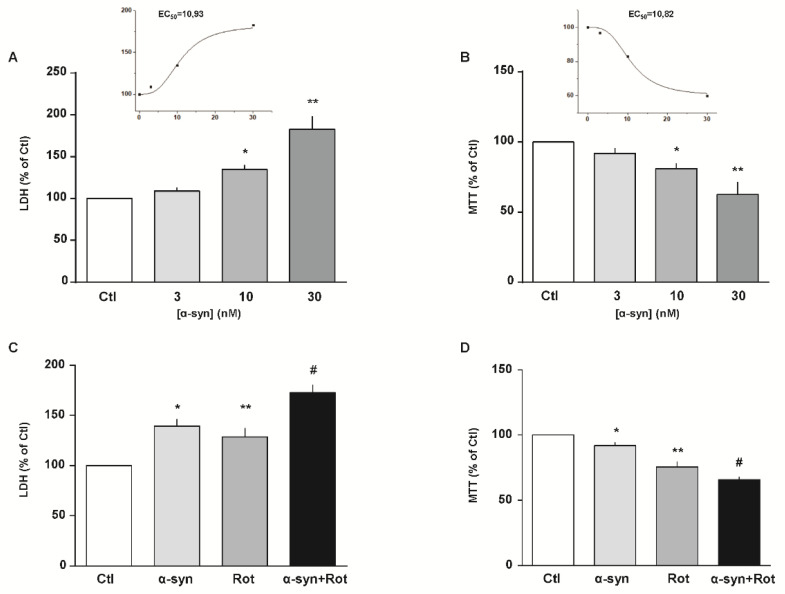
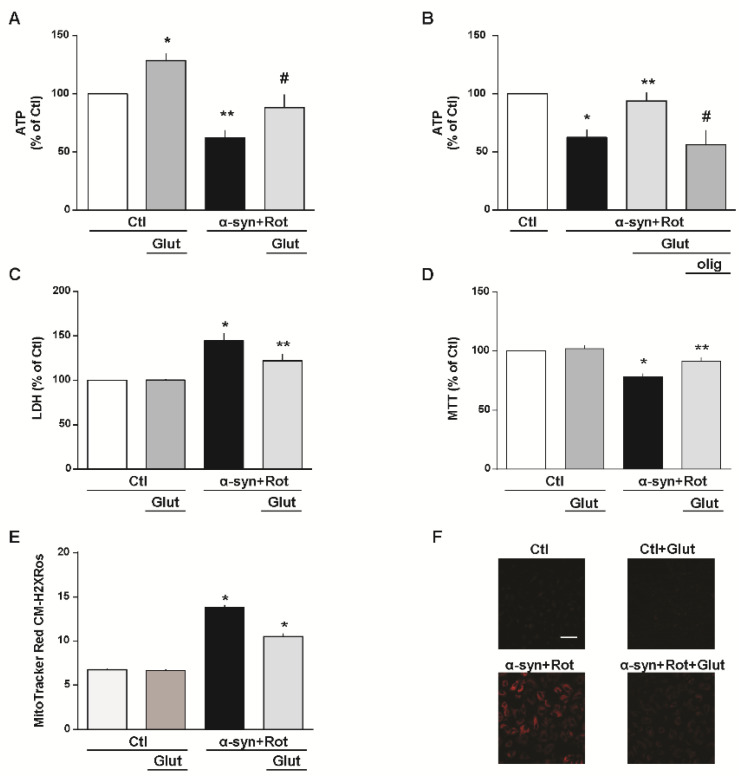
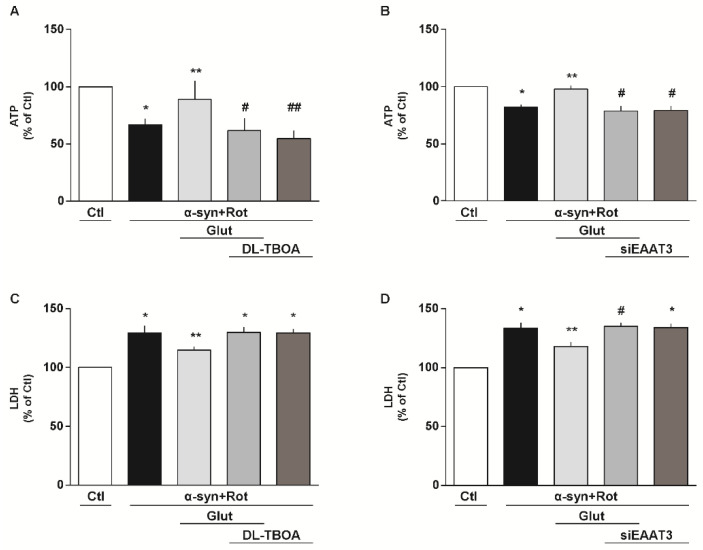
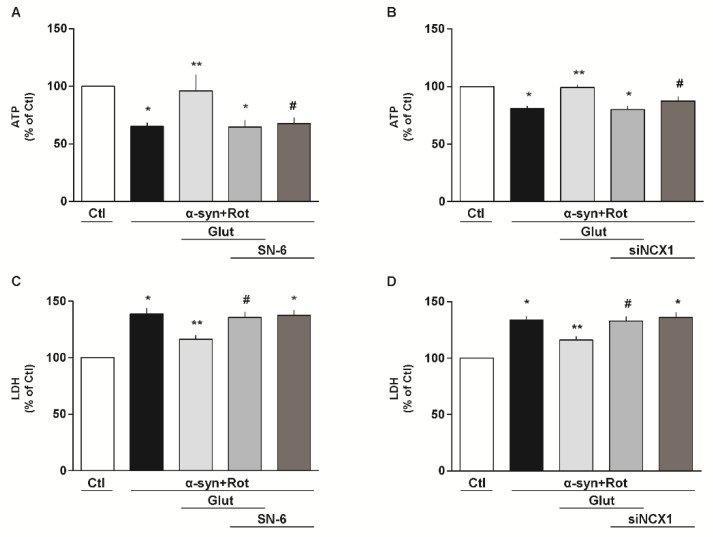
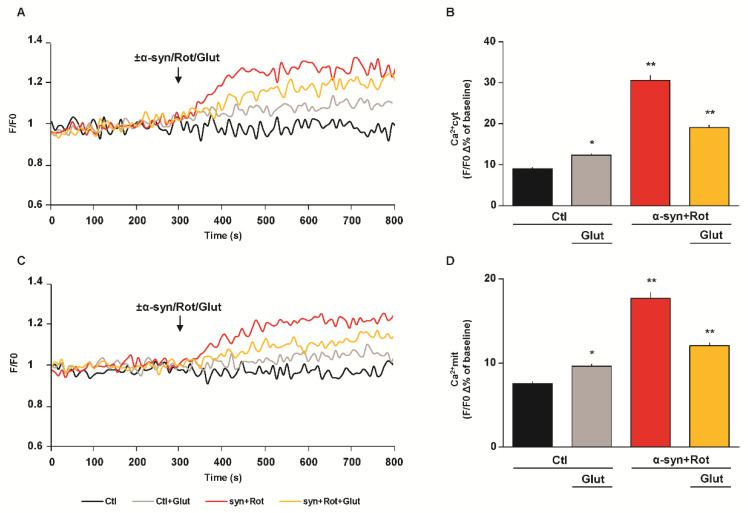
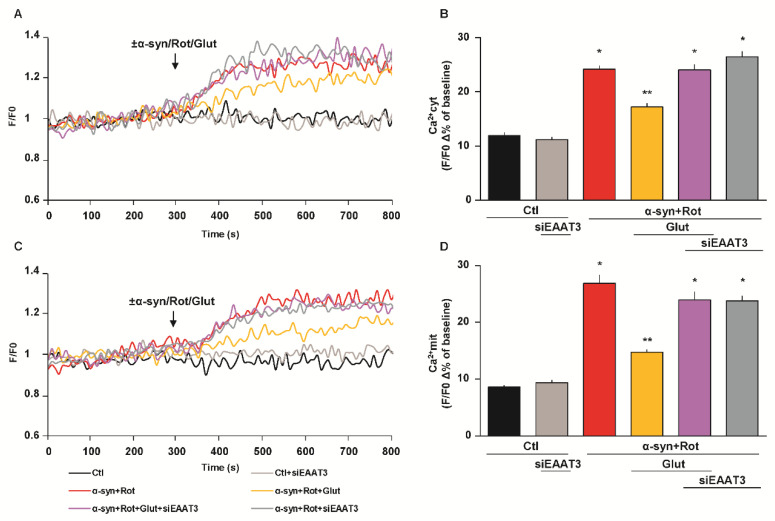
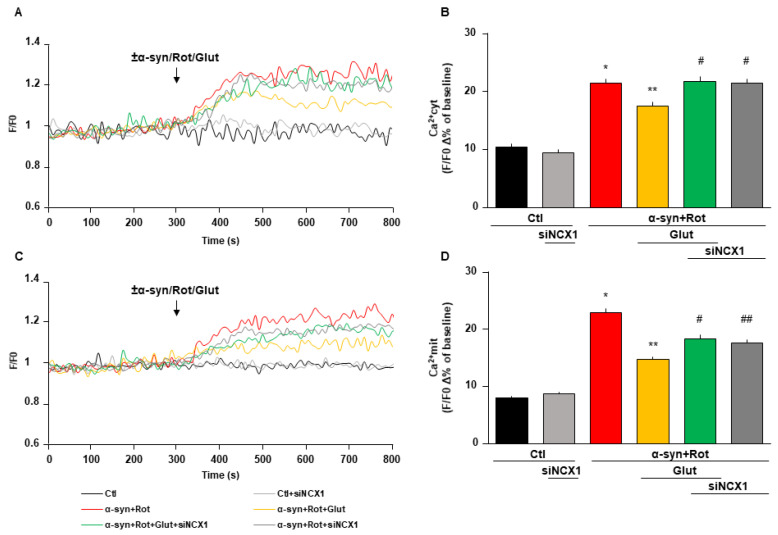
Increasing evidence suggests that metabolic alterations may be etiologically linked to neurodegenerative disorders such as Parkinson's disease (PD) and in particular empathizes the possibility of targeting mitochondrial dysfunctions to improve PD progression. Under different pathological conditions (i.e., cardiac and neuronal ischemia/reperfusion injury), we showed that supplementation of energetic substrates like glutamate exerts a protective role by preserving mitochondrial functions and enhancing ATP synthesis through a mechanism involving the Na+-dependent excitatory amino acid transporters (EAATs) and the Na+/Ca2+ exchanger (NCX). In this study, we investigated whether a similar approach aimed at promoting glutamate metabolism would be also beneficial against cell damage in an in vitro PD-like model. In retinoic acid (RA)-differentiated SH-SY5Y cells challenged with α-synuclein (α-syn) plus rotenone (Rot), glutamate significantly improved cell viability by increasing ATP levels, reducing oxidative damage and cytosolic and mitochondrial Ca2+ overload. Glutamate benefits were strikingly lost when either EAAT3 or NCX1 expression was knocked down by RNA silencing. Overall, our results open the possibility of targeting EAAT3/NCX1 functions to limit PD pathology by simultaneously favoring glutamate uptake and metabolic use in dopaminergic neurons.

Keywords: EAAT3; NCX1; Parkinson’s disease; glutamate; mitochondrial dysfunction; neuronal survival.


Conflict of interest statement

The authors declare no conflict of interest.

Figures

Figure 1
Figure 1
Effect of α-syn and α-syn plus Rot on cell survival. (AD) Cell injury and mitochondrial activity induced by 24 h exposure to increasing concentrations of α-syn (from 3 to 30 nM) and (A,B) α-syn (10 nM) plus Rot (300 nM) (C,D) were assessed by means of lactate dehydrogenase (LDH) (A,C) and 3-(4,5-dimethylthiazol-2-yl)-2,5-diphenyltetrazolium bromide (MTT) assays (B,D). Extracellular LDH release and MTT reduction were expressed as percentage of the control. In each panel, the inset shows the EC50 values of α-syn estimated from each specific assay. Statistical differences were assessed by one-way ANOVA followed by Dunnet’s post hoc test. (A) F (3,22) = 25.10. Each column represents the mean ± S.E.M. of at least n = 5 independent experiments performed in triplicate. * Significant versus all groups (p < 0.01 versus Ctl, p < 0.05 versus 3 nM, p < 0.001 versus 30 nM); ** significant versus all groups (p < 0.0001 versus Ctl and 3 nM, p < 0.001 versus 10 nM). (B) F (3,36) = 21.16. Each column represents the mean ± S.E.M. of at least n = 8 independent experiments performed in triplicate. * Significant versus all groups (p < 0.01 versus Ctl and 30 nM, p < 0.05 versus 3 nM); ** significant versus all groups (p < 0.0001 versus Ctl and 3 nM, p < 0.01 versus 10 nM). (C) F (3,12) = 19.85. Each column represents the mean ± S.E.M. of n = 4 independent experiments performed in triplicate. * Significant versus Ctl (p < 0.01) and α-syn+Rot (p < 0.05); ** significant versus Ctl (p < 0.05) and α-syn+Rot (p < 0.01); # significant versus all groups (p < 0.0001 versus Ctl, p < 0.05 versus α-syn, p < 0.01 versus Rot). (D) F (3,18) = 69.39 each column represents the mean ± S.E.M. of at least n = 4 independent experiments performed in triplicate. * Significant versus all groups (p < 0.05 versus Ctl, p < 0.001 versus Rot, p < 0.0001 versus α-syn+Rot); ** significant versus all groups (p < 0.0001 versus Ctl, p < 0.001 versus α-syn, p < 0.05 versus α-syn+Rot); # Significant versus all groups (p < 0.0001 versus Ctl and α-syn, p < 0.05 versus Rot). Ctl = control; α-syn = α-synuclein; Rot = rotenone.
Figure 2
Figure 2
Glutamate recovery of cell injury, reactive oxygen species (ROS) overproduction and ATP synthesis reduction induced by α-syn plus Rot. Effect of 1 h exposure to glutamate under physiological conditions on ATP synthesis (A), extracellular LDH release (C), mitochondrial activity (D) and mitochondrial ROS production (E). A,B Intracellular ATP levels after 24 h exposure to α-syn (10 nM) plus Rot (300 nM) and 23 h exposure to α-syn (10 nM) plus Rot (300 nM) followed by 1 h exposure to glutamate (500 µM) in the absence (A) or in the presence of oligomycin (3 µg/mL) (B). In each experiment, ATP levels were normalized to the respective protein content and expressed as percentage of the control. (C,D) Cell injury, assessed by means of extracellular LDH and MTT assays, and (E,F) mitochondrial ROS production, assessed by measuring MitoTracker Red CM-H2XRos fluorescence intensity, were evaluated after 24 h exposure to α-syn (10 nM) plus Rot (300 nM), in the presence or in the absence of glutamate. Where indicated, glutamate (500 µM) was added during the last hour of the α-syn+Rot treatment. In each experiment, extracellular LDH release and MTT reduction were expressed as percentage of the control. (F) Representative images of mitochondrial ROS by MitoTracker Red CM-H2XRos staining. Images are representative of n = 4 independent experiments. Scale bar = 50 µm. Statistical differences were assessed by one-way ANOVA followed by Dunnet’s post hoc test. (A) F (3,20) = 14.85. Each column represents the mean ± S.E.M. of n = 6 independent experiments performed in triplicate. * Significant versus all groups (p < 0.05 versus Ctl, p < 0.0001 versus α-syn+Rot, p < 0.01 versus α-syn+Rot+Glut); ** significant versus all groups (p < 0.01 versus Ctl, p < 0.0001 versus Ctl+Glut, p < 0.05 versus α-syn+Rot+Glut); # significant versus Ctl+Glut (0.01) and α-syn+Rot (0.05). (B) F (3,12) = 7.902. Each column represents the mean ± S.E.M. of n = 4 independent experiments performed in triplicate. * Significant versus Ctl and α-syn+Rot+Glut (p < 0.05); * significant versus α-syn+Rot and α-syn+Rot+Glut+olig (p < 0.05); # significant versus Ctl (p < 0.01) and α-syn+Rot+Glut (p < 0.05). (C) F (3,37) = 13.64. Each column represents the mean ± S.E.M. of at least n = 8 independent experiments performed in triplicate. * Significant versus all groups (p < 0.0001 versus control groups, p < 0.05 versus α-syn+Rot+Glut); ** significant versus Ctl and α-syn+Rot (p < 0.05). (D) F (3,17) = 19.37. Each column represents the mean ± S.E.M. of at least n = 3 independent experiments performed in triplicate. * Significant versus all groups (p < 0.0001 versus control groups, p < 0.01 versus α-syn+Rot+Glut); ** significant versus Ctl+Glut (p < 0.05) and α-syn+Rot (p < 0.01). (E) F (3,1714) = 188.9. The bar plot reports the mean ± S.E.M. of fluorescence increase elicited by ROS formation. For each experimental group, basal values used for the statistical analysis derived from n = 4 independent experiments, and 100–150 cells were recorded for each session. * Significant versus all groups (p < 0.0001). Olig = oligomycin.
Figure 3
Figure 3
Involvement of EAATs in the glutamate neuroprotection against α-syn plus Rot toxicity. (A,C) Intracellular ATP content (A) and extracellular LDH (C) after 24 h exposure to α-syn (10 nM) plus Rot (300 nM) and 23 h exposure to α-syn (10 nM) plus Rot (300 nM) followed by 1 h exposure to glutamate (500 µM) in the presence or in the absence of DL-threo-beta-benzyloxyaspartate (DL-TBOA; 300 µM). (B,D) After 48 h of EAAT3 silencing, ATP levels (B) and cell damage (D) were evaluated after 24 h exposure to α-syn (10 nM) plus Rot (300 nM) and 23 h exposure to α-syn (10 nM) plus Rot (300 nM) followed by 1 h exposure to glutamate (500 µM). Statistical differences were assessed by one-way ANOVA followed by Dunnet’s post hoc test. (A) F (4,15) = 13.75. Each column represents the mean ± S.E.M. of n = 4 independent experiments performed in triplicate. * Significant versus Ctl (p < 0.01) and α-syn+Rot+Glut (p < 0.05); ** significant versus α-syn+Rot (p < 0.05), α-syn+Rot+Glut+DL-TBOA and α-syn+Rot+DL-TBOA (p < 0.01); # significant versus Ctl (p < 0.001) and α-syn+Rot+Glut (p < 0.01); ## significant versus Ctl (p < 0.0001) and α-syn+Rot+Glut (p < 0.01). (B) F (4,15) = 12.25. Each column represents the mean ± S.E.M. of n = 4 independent experiments performed in triplicate. * Significant versus Ctl and α-syn+Rot+Glut (p < 0.001); ** significant versus α-syn+Rot, α-syn+Rot+Glut+siEAAT3 and α-syn+Rot+siEAAT3 (p < 0.001); # significant versus Ctl (p < 0.0001) and α-syn+Rot+Glut (p < 0.001). (C) F (4,25) = 11.58. Each column represents the mean ± S.E.M. of n = 6 independent experiments performed in triplicate. * Significant versus Ctl (p < 0.0001) and α-syn+Rot+Glut (p < 0.05); ** significant versus all groups (p < 0.05). (D) F (4,10) = 20.73. Each column represents the mean ± S.E.M. of n = 3 independent experiments performed in triplicate. * Significant versus Ctl (p < 0.001) and α-syn+Rot+Glut (p < 0.05); ** Significant versus all groups (p < 0.05); # Significant versus Ctl (p < 0.0001) and α-syn+Rot+Glut (p < 0.05). siEAAT3 = siRNA for EAAT3.
Figure 4
Figure 4
Involvement of NCX in the glutamate neuroprotection against α-syn plus Rot toxicity. (A,C) Intracellular ATP content (A) and extracellular LDH (C) after 24 h exposure to α-syn (10 nM) plus Rot (300 nM) and 23 h exposure to α-syn (10 nM) plus Rot (300 nM) followed by 1 h exposure to glutamate (500 µM) in the presence or in the absence of SN-6 (1 µM). (B,D) After 48 h of NCX1 silencing, ATP levels (B) and cell damage (D) were evaluated after 24 h exposure to α-syn (10 nM) plus Rot (300 nM) and 23 h exposure to α-syn (10 nM) plus Rot (300 nM) followed by 1 h exposure to glutamate (500 µM). The experiments reported in panel D were conducted simultaneously with the experiments reported in panel 3D. Statistical differences were assessed by one-way ANOVA followed by Dunnet’s post hoc test. (A) F (4,30) = 5.737. Each column represents the mean ± S.E.M. of n = 7 independent experiments performed in triplicate. * Significant versus Ctl (p < 0.001) and α-syn+Rot+Glut (p < 0.01); ** significant versus α-syn+Rot, α-syn+Rot+Glut+SN-6 and α-syn+Rot+SN-6 (p < 0.01); # significant versus Ctl and α-syn+Rot+Glut (p < 0.01). (B) F (4,20) = 13.62. Each column represents the mean ± S.E.M. of n = 5 independent experiments performed in triplicate. * Significant versus Ctl and α-syn+Rot+Glut (p < 0.001); ** significant versus α-syn+Rot, α-syn+Rot+Glut+siNCX1 (p < 0.001) and α-syn+Rot+siNCX1 (p < 0.05); # significant versus Ctl and α-syn+Rot+Glut (p < 0.05). (C) F (4,15) = 17.71. Each column represents the mean ± S.E.M. of n = 4 independent experiments performed in triplicate. * Significant versus Ctl (p < 0.0001) and α-syn+Rot+Glut (p < 0.01); ** significant versus all groups (p < 0.05 versus Ctl and α-syn+Rot+Glut+SN-6, p < 0.01 versus α-syn+Rot and α-syn+Rot+SN-6); # significant versus Ctl (p < 0.0001) and α-syn+Rot+Glut (p < 0.05). (D) F (4,15) = 19.99. Each column represents the mean ±  S.E.M. of n = 4 independent experiments performed in triplicate. * Significant versus Ctl (p < 0.0001) and α-syn+Rot+Glut (p < 0.01); ** significant versus all groups (p < 0.05 versus Ctl and α-syn+Rot+Glut+siNCX1, p < 0.01 versus α-syn+Rot and α-syn+Rot+siNCX1); # significant versus Ctl (p < 0.0001) and α-syn+Rot+Glut (p < 0.05). siNCX1 = siRNA for NCX1.
Figure 5
Figure 5
Effect of glutamate on α-syn plus Rot induced cytoplasmic and mitochondrial Ca2+ increase. (A,C) Representative records of cytoplasmic (A) and mitochondrial (C) Ca2+ levels under control conditions (black line), during acute exposure to glutamate (500 µM) (grey line), to α-syn (10 nM) plus Rot (300 nM) in the presence (orange line) or in the absence (red line) of glutamate. Fluorescence intensity was expressed as F/F0 ratio, where F is the background subtracted fluorescence intensity and F0 is the background subtracted mean fluorescence value measured from each cell at resting conditions (F/F0). (B,D) The bar plots showing cytoplasmic (B) and mitochondrial (D) Ca2+ levels depict the mean ± S.E.M of each Δ% fluorescence increase. For Δ% calculation, we used the maximal value of fluorescence obtained after stimulation and, as baseline, the mean of fluorescence recorded during the 300 s preceding the ±α-syn/Rot/Glut challenge. Statistical differences were assessed by one-way ANOVA followed by Dunnet’s post hoc test. (B) F (3,1118) = 122.2. For each experimental group, Δ% values used for the statistical analysis derived from 4 independent experiments and 50–100 cells were recorded in each different session. * Significant versus all groups (p < 0.05 versus Ctl, p < 0.0001 versus α-syn+Rot and α-syn+Rot+Glut); ** significant versus all groups (p < 0.0001). (D) F (3,1112) = 82.28. For each experimental group, Δ% values used for the statistical analysis derived from 5 independent experiments and 50–100 cells were recorded in each different session. * Significant versus all groups (p < 0.05 versus Ctl, p < 0.0001 versus α-syn+Rot and α-syn+Rot+Glut); ** significant versus all groups (p < 0.0001).
Figure 6
Figure 6
Effect of siEAAT3 on glutamate-induced reduction of cytoplasmic and mitochondrial Ca2+ levels. (A,C) Representative records of cytoplasmic (A) and mitochondrial (C) Ca2+ levels under control conditions (black line), after 48 h of EAAT3 silencing (light grey line), during acute treatment of α-syn (10 nM) plus Rot (300 nM) in the presence (grey line) or in the absence (red line) of siEAAT3, and acute treatment of α-syn plus Rot and glutamate (500 µM) in the presence (violet line) or in the absence (orange line) of siEAAT3. Fluorescence intensity was expressed as F/F0 ratio, where F is the background subtracted fluorescence intensity and F0 is the background subtracted mean fluorescence value measured from each cell at resting conditions (F/F0). (B,D) The bar plots showing cytoplasmic (B) and mitochondrial (D) Ca2+ levels depict the mean ± S.E.M of each Δ% fluorescence increase. For Δ% calculation, we used the maximal value of fluorescence obtained after stimulation and, as baseline, the mean of fluorescence recorded during the 300 s preceding the ±α-syn/Rot/Glut challenge. Statistical differences were assessed by one-way ANOVA followed by Dunnet’s post hoc test. For each experimental group, Δ% values used for the statistical analysis derived from 4 independent experiments and 50–100 cells were recorded in each different session. (B) F (5,1053) = 83.02. * Significant versus control groups and α-syn+Rot+Glut (p < 0.0001); ** significant versus all groups (p < 0.0001). (D) F (5,1245) = 68.75. * Significant versus control groups and α-syn+Rot+Glut (p < 0.0001); ** significant versus Ctl, α-syn+Rot, α-syn+Rot+Glut+siEAAT3, α-syn+Rot+siEAAT3 (p < 0.0001) and Ctl+siEAAT3 (p < 0.001).
Figure 7
Figure 7
Effect of siNCX1 on glutamate-induced reduction of cytoplasmic and mitochondrial Ca2+ levels. (A,C) Representative records of cytoplasmic (A) and mitochondrial (C) Ca2+ levels under control conditions (black line), after 48 h of NCX1 silencing (light grey line), during acute treatment of α-syn (10 nM) plus Rot (300 nM) in the presence (grey line) or in the absence (red line) of siNCX1, and acute treatment of α-syn plus Rot and glutamate (500 µM) in the presence (green line) or in the absence (orange line) of siNCX1. Fluorescence intensity was expressed as F/F0 ratio, where F is the background subtracted fluorescence intensity and F0 is the background subtracted mean fluorescence value measured from each cell at resting conditions (F/F0). (B,D) The bar plots showing cytoplasmic (B) and mitochondrial (D) Ca2+ levels depict the mean ± S.E.M of each Δ% fluorescence increase. For Δ% calculation, we used the maximal value of fluorescence obtained after stimulation and, as baseline, the mean of fluorescence recorded during the 300 s preceding the ±α-syn/Rot/Glut challenge. Statistical differences were assessed by one-way ANOVA followed by Dunnet’s post hoc test. (B) F (5,1126) = 56.75. For each experimental group, Δ% values used for the statistical analysis derived from at least 4 independent experiments and 50–100 cells were recorded in each different session. * Significant versus control groups (p < 0.0001) and α-syn+Rot+Glut (p < 0.001); ** significant versus all groups (p < 0.0001 versus control groups, α-syn+Rot+Glut+siNCX1 and α-syn+Rot+siNCX1; p < 0.001 versus α-syn+Rot); # significant versus control groups and α-syn+Rot+Glut (p < 0.0001). (D) F (5,1849) = 90.72. For each experimental group, Δ% values used for the statistical analysis derived from at least 5 independent experiments and 50–100 cells were recorded in each different session. * Significant versus all groups (p < 0.0001); ** significant versus control groups, α-syn+Rot, α-syn+Rot+Glut+siNCX1 (p < 0.0001) and α-syn+Rot+siNCX1 (p < 0.01); # significant versus control groups, α-syn+Rot and α-syn+Rot+Glut (p < 0.0001); ## significant versus control groups, α-syn+Rot (p < 0.0001) and α-syn+Rot+Glut (p < 0.01).

Similar articles

Cited by

References

    1. Powers R., Lei S., Anandhan A., Marshall D.D., Worley B., Cerny R.L., Dodds E.D., Huang Y., Panayiotidis M.I., Pappa A., et al. Metabolic Investigations of the Molecular Mechanisms Associated with Parkinson’s Disease. Metabolites. 2017;7:22. doi: 10.3390/metabo7020022. - DOI - PMC - PubMed
    1. Ramalingam M., Huh Y.J., Lee Y.I. The Impairments of alpha-Synuclein and Mechanistic Target of Rapamycin in Rotenone-Induced SH-SY5Y Cells and Mice Model of Parkinson’s Disease. Front. Neurosci. 2019;13:1028. doi: 10.3389/fnins.2019.01028. - DOI - PMC - PubMed
    1. Sherer T.B., Betarbet R., Testa C.M., Seo B.B., Richardson J.R., Kim J.H., Miller G.W., Yagi T., Matsuno-Yagi A., Greenamyre J.T. Mechanism of toxicity in rotenone models of Parkinson’s disease. J. Neurosci. 2003;23:10756–10764. doi: 10.1523/JNEUROSCI.23-34-10756.2003. - DOI - PMC - PubMed
    1. Subramaniam S.R., Chesselet M.F. Mitochondrial dysfunction and oxidative stress in Parkinson’s disease. Prog. Neurobiol. 2013;106–107:17–32. doi: 10.1016/j.pneurobio.2013.04.004. - DOI - PMC - PubMed
    1. Abramov A.Y., Gegg M., Grunewald A., Wood N.W., Klein C., Schapira A.H. Bioenergetic consequences of PINK1 mutations in Parkinson disease. PLoS ONE. 2011;6:e25622. doi: 10.1371/journal.pone.0025622. - DOI - PMC - PubMed

Publication types