. 2020 Sep 6;10(9):614.
doi: 10.3390/brainsci10090614.

The Effects of Hypocapnia on Brain Tissue Pulsations

Affiliations

The Effects of Hypocapnia on Brain Tissue Pulsations

Meshal Alharbi et al. Brain Sci. .

Abstract

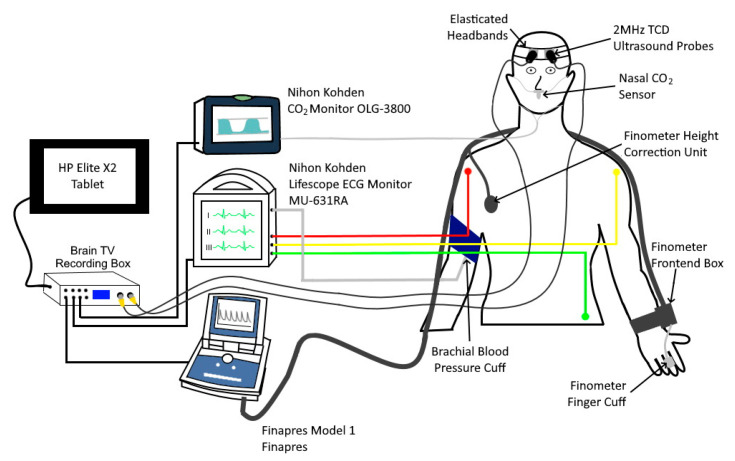
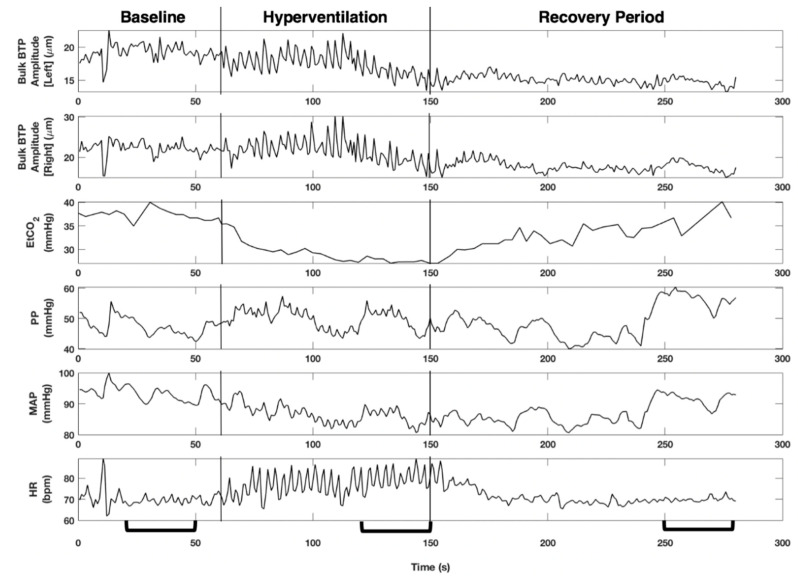
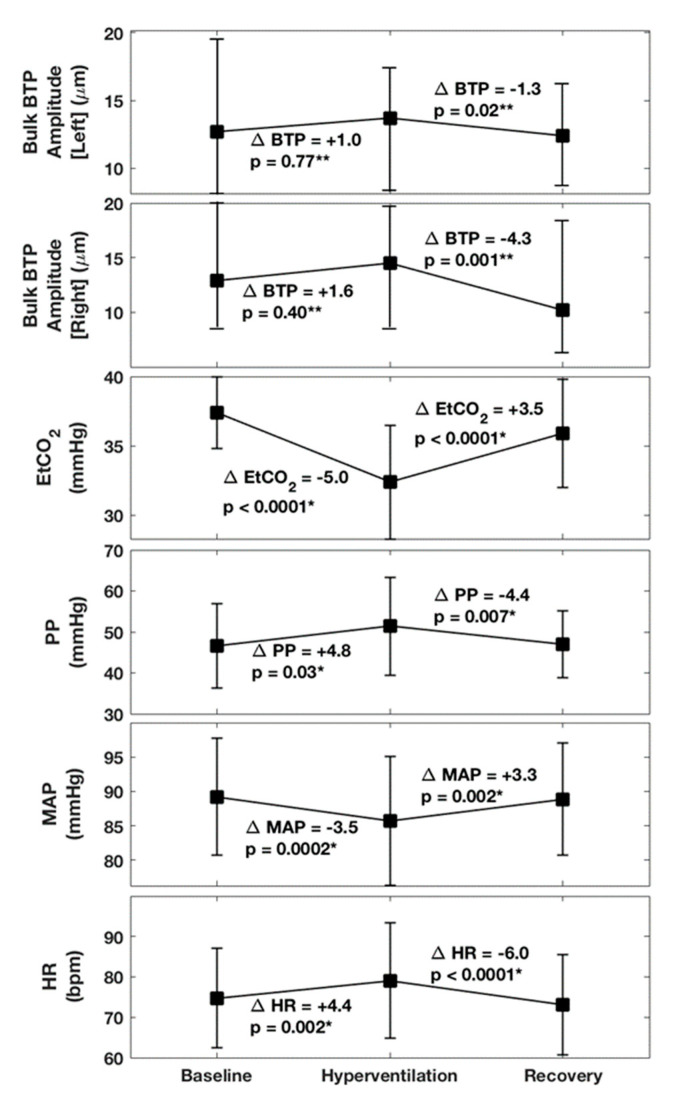
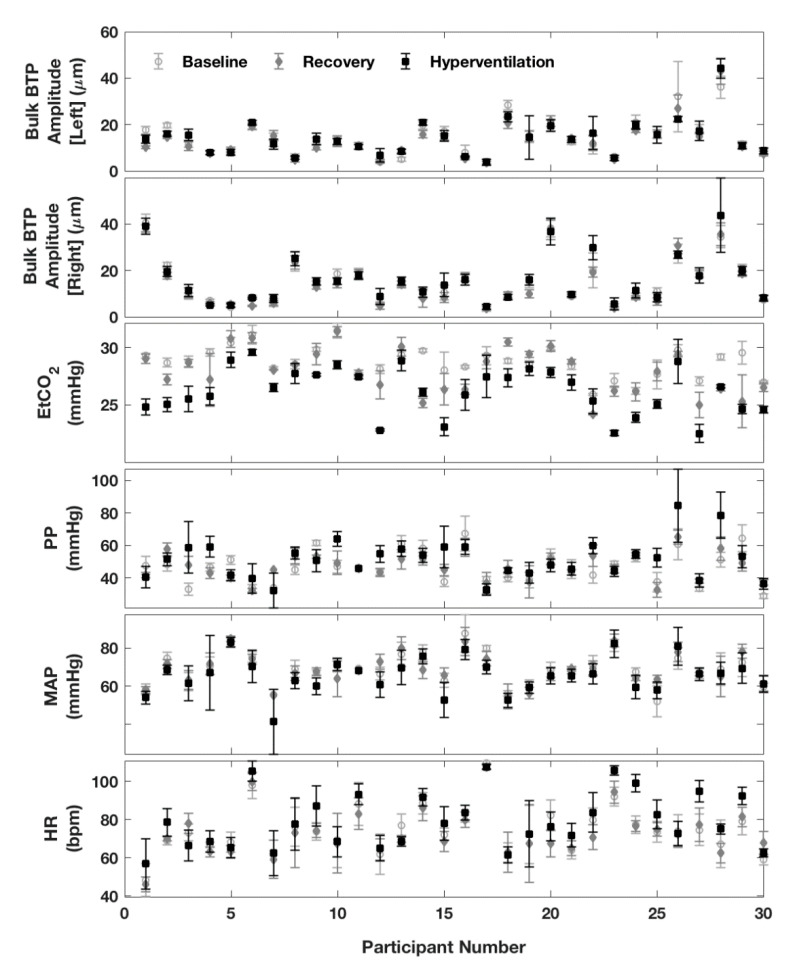
Hypocapnia is known to affect patients with acute stroke and plays a key role in governing cerebral autoregulation. However, the impact of hypocapnia on brain tissue pulsations (BTPs) is relatively unexplored. As BTPs are hypothesised to result from cerebrovascular resistance to the inflow of pulsatile arterial blood, it has also been hypothesised that cerebral autoregulation changes mediated by hypocapnia will alter BTP amplitude. This healthy volunteer study reports measurements of BTPs obtained using transcranial tissue Doppler (TCTD). Thirty participants underwent hyperventilation to induce mild hypocapnia. BTP amplitude, EtCO2, blood pressure, and heart rate were then analysed to explore the impact of hypocapnia on BTP amplitude. Significant changes in BTP amplitude were noted during recovery from hypocapnia, but not during the hyperventilation manoeuvre itself. However, a significant increase in heart rate and pulse pressure and decrease in mean arterial pressure were also observed to accompany hypocapnia, which may have confounded our findings. Whilst further investigation is required, the results of this study provide a starting point for better understanding of the effects of carbon dioxide levels on BTPs. Further research in this area is needed to identify the major physiological drivers of BTPs and quantify their interactions with other aspects of cerebral haemodynamics.

Keywords: BTP; brain tissue pulsations; cerebral autoregulation; hypocapnia.


Conflict of interest statement

M.O. is an employee of Nihon Kohden Corporation (Japan). E.M.L.C. received funding from Nihon Kohden Corporation (Japan), although Nihon Kohden Corporation had no influence on study design, data collection, statistical analysis, or reporting. All other authors declare no conflicts of interest. The views expressed in this publication are those of the author(s) and not necessarily those of the NHS, the National Institute for Health Research, the Department of Health, or the authors’ respective institutions.

Figures

Figure 1
Figure 1
A schematic diagram of the experimental set-up.
Figure 2
Figure 2
Time series for each variable are shown for an entire recording in which a 26-year-old male performs the hyperventilation manoeuvre. A reduction in EtCO2 and an increase in heart rate (HR) can be observed during the hyperventilation period, changes in pulse pressure (PP) appear to mirror changes in mean arterial pressure (MAP), and Bulk brain tissue pulsations (BTP) Amplitude shows similar trends for both left and right hemispheres. There appears to be a decrease in Bulk BTP Amplitude and variability during the recovery phase compared to the hyperventilation phase. The brackets on the x-axis indicate the 30 s time intervals used in statistical analysis for this recording. All 30 s intervals were chosen to be close to the end of each phase, while also avoiding the inclusion of artefacts.
Figure 3
Figure 3
Summary of changes observed between baseline, hyperventilation, and recovery in 30 volunteers. Bulk BTP amplitude is expressed as median and IQR values, with all other variables described by their mean and standard deviation. Estimated differences between baseline and hyperventilation, and between hyperventilation and recovery, are labelled in the figure. Paired t-tests * and Wilcoxon signed-rank test ** were carried out to determine whether changes were statistically significant at a p-value of p = 0.05. For 95% For confidence limits, please see the values reported in the text. (Note that adjustment for multiple comparisons using a Bonferroni correction suggests an adjusted p-value of p = 0.004 as a more conservative threshold for significance.).
Figure 4
Figure 4
Summary of changes in variables between baseline, hyperventilation, and recovery for each participant. Graphs for Left and Right Bulk BTP Amplitude show the mean beat-to-beat value calculated over a 30 s interval, with the standard deviation (SD) indicated by error bars. Graphs for the remaining variables (EtCO2, PP, MAP, and HR) show the median beat-to-beat value with the IQR indicated by error bars.

References

    1. Minhas J.S., Robinson T.G., Panerai R. PaCO2 measurement in cerebral haemodynamics: Face mask or nasal cannulae? Physiol. Meas. 2017;38:N101–N106. doi: 10.1088/1361-6579/aa6f9f. - DOI - PubMed
    1. Minhas J.S., Panerai R.B., Robinson T.G. Modelling the cerebral haemodynamic response in the physiological range of PaCO2. Physiol. Meas. 2018;39:065001. doi: 10.1088/1361-6579/aac76b. - DOI - PubMed
    1. Minhas J.S., Panerai R.B., Swienton D., Robinson T.G. Feasibility of improving cerebral autoregulation in acute intracerebral hemorrhage (BREATHE-ICH) study: Results from an experimental interventional study. Int. J. Stroke. 2019;15:627–637. doi: 10.1177/1747493019873690. - DOI - PubMed
    1. Donnelly J., Budohoski K.P., Smielewski P., Czosnyka M. Regulation of the cerebral circulation: Bedside assessment and clinical implications. Crit. Care. 2016;20:129. doi: 10.1186/s13054-016-1293-6. - DOI - PMC - PubMed
    1. Ince J., Alharbi M., Minhas J.S., Chung E.M. Ultrasound measurement of brain tissue movement in humans: A systematic review. Ultrasound. 2019;28:70–81. doi: 10.1177/1742271X19894601. - DOI - PMC - PubMed