. 2020 Sep;17(170):20200091.
doi: 10.1098/rsif.2020.0091. Epub 2020 Sep 9.

Differential response to cytotoxic therapy explains treatment dynamics of acute myeloid leukaemia patients: insights from a mathematical modelling approach

Affiliations

Differential response to cytotoxic therapy explains treatment dynamics of acute myeloid leukaemia patients: insights from a mathematical modelling approach

H Hoffmann et al. J R Soc Interface. 2020 Sep.

Abstract

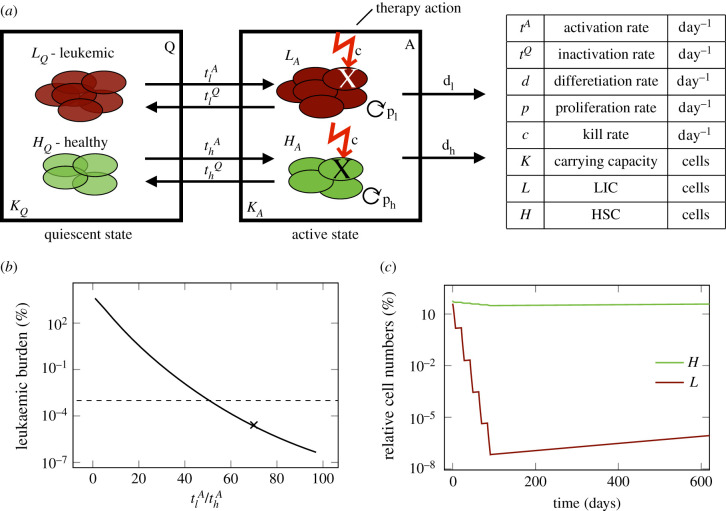
Disease response and durability of remission are very heterogeneous in patients with acute myeloid leukaemia (AML). There is increasing evidence that the individual risk of early relapse can be predicted based on the initial treatment response. However, it is unclear how such a correlation is linked to functional aspects of AML progression and treatment. We suggest a mathematical model in which leukaemia-initiating cells and normal/healthy haematopoietic stem and progenitor cells reversibly change between an active state characterized by proliferation and chemosensitivity and a quiescent state, in which the cells do not divide, but are also insensitive to chemotherapy. Applying this model to 275 molecular time courses of nucleophosmin 1-mutated patients, we conclude that the differential chemosensitivity of the leukaemia-initiating cells together with the cells' intrinsic proliferative capacity is sufficient to reproduce both, early relapse as well as long-lasting remission. We can, furthermore, show that the model parameters associated with individual chemosensitivity and proliferative advantage of the leukaemic cells are closely linked to the patients' time to relapse, while a reliable prediction based on early response only is not possible based on the currently available data. Although we demonstrate with our approach, that the complete response data is sufficient to quantify the aggressiveness of the disease, further investigations are necessary to study how an intensive early sampling strategy may prospectively improve risk assessment and help to optimize individual treatments.

Keywords: acute myeloid leukaemia; leukaemia; mathematical modelling; measurable residual disease; relapse prediction; risk stratification.


Conflict of interest statement

C.T. is CEO and co-owner of AgenDix GmbH, a company performing molecular diagnostics. Other authors declare that they have no conflict of interest.

Figures

Figure 1.
Figure 1.
(a) Schematic overview of the mathematical model describing the dynamics of leukaemia-initiating cells (LIC), L and healthy stem cells (HSC), H in the bone marrow of an AML patient. (b) Leukemic burden after therapy depending on the ratio of leukaemic activation to healthy activation tlA/thA. Dashed line shows detection limit for clinically measured leukaemic burden. For x the time course is shown in figure 1c. (c) Time course of leukaemic and healthy cell numbers relative to the numbers at diagnosis with a tlA/thA=70.
Figure 2.
Figure 2.
(a) Model fit to the data (PatientID = 104) and 95% confidence interval (CI) of an example patient suffering a relapse. Mean absolute error(MAE)= 0.6log10%. (b) Model fit to the data (PatientID = 3137) and 95% CI of an example patient staying in long time remission. MAE=0.04log10%. The red shaded regions are the times of treatment. The red marks indicate the fitted parameter values for the leukaemic activation (tlA) and the leukaemic proliferation (pl) with their corresponding 95% CI. (c) Time courses of cell numbers relative to the total cell numbers at diagnosis of model fit to patient from plot (a). (d) Time courses of cell numbers relative to the total cell numbers at diagnosis of model fit to patient from plot (b). HQ, quiescent HSCs, LQ, quiescent leukaemic stem cells (LSCs), HA, active HSCs, LA, active LSCs. (e) MAE in log10% for all patient fits as a measure of goodness of fit. Black dashed line indicates threshold for quantitatively good fitting patients. Grey dashed line indicates threshold for qualitatively good fitting patients. For all patients with higher MAE the fit was poor.
Figure 3.
Figure 3.
(a) Schematic overview of an NPM1 time course. α: elimination slope during primary therapy [log10% d−1]; n: minimal NPM1 level after primary treatment within nine months after treatment start [log10%]; β: the maximum slope during relapse phase [log10% d−1]; d: time until molecular relapse [days]. (b) Spearman correlation coefficients between the fitted parameters (i.e. leukaemic activation tlA, leukaemic proliferation pl and their ratio) and the patients molecular time course characteristics with adjusted p-values. (c) Relapse-free survival for intermediate and favourable ELN risk groups. p < 0.01 (logrank-test). HR = 1.86. (d) Relapse-free survival for high and low ratio of leukaemic activation and leukaemic proliferation (tlA/pl) as estimated by the mathematical model with a threshold between high and low of 18. p < 0.0001 (logrank-test). HR = 5.47. (e) Boxplot for the comparison of the molecular relapse times of patients with high (n = 116) or low (n = 10) ratio of leukaemic activation and leukaemic proliferation (tlA/pl) as estimated by the mathematical model with a threshold between high and low of 18. p < 0.0001 (U-test). (f) One year relapse probability (sigmoid function) as estimated by a logistic regression. Corresponding patient data (•) indicate the 1 year relapse status (relapse/no relapse) depending on the ratio of the two fitted parameters (tlA/pl).
Figure 4.
Figure 4.
(a) Scatter plot for the comparison of the molecular relapse time approximated from the patient data dd and the molecular relapse time estimated from the fitted model dm for each patient. ρc = 0.90. Perfect accordance is indicated with dashed red line. Grey dashed line indicates divergence by half a year. Points with divergence larger than half a year are marked blue. (b) Scatter plot for the comparison of the molecular relapse time estimated from the fitted model to the first nine months dm of the patients and the molecular relapse time approximated from the data of these patients dd. ρc = 0.37. (c) Example fit (PatientID = 3751) and 95% CI for a patient where the model is not able to capture the molecular course of disease. Dashed line shows remission/relapse threshold. dd is 0 days (no remission reached), dm is 396 days. (d) Example fit (PatientID = 3621) and 95% CI for a patient where the sparseness of data points makes it impossible to reliably approximate the molecular relapse time. Dashed line shows remission/relapse threshold. dd is 0 days (no remission reached), dm is 326 days.

References

    1. Cancer Genome Atlas Research Network, Ley TJ, Miller C. 2013. Genomic and epigenomic landscapes of adult de novo acute myeloid leukemia. N. Engl. J. Med. 368, 2059–2074. ( 10.1056/NEJMoa1301689) - DOI - PMC - PubMed
    1. Döhner H. et al. 2017. Diagnosis and management of AML in adults: 2017 ELN recommendations from an international expert panel. Blood 129, 424–447. ( 10.1182/blood-2016-08-733196) - DOI - PMC - PubMed
    1. Döhner H, Weisdorf DJ, Bloomfield CD. 2015. Acute myeloid leukemia. N. Engl. J. Med. 373, 1136–1152. ( 10.1056/NEJMra1406184) - DOI - PubMed
    1. Falini B. et al. 2006. Both carboxy-terminus NES motif and mutated tryptophan(s) are crucial for aberrant nuclear export of nucleophosmin leukemic mutants in NPMc+ AML. Blood 107, 4514–4523. ( 10.1182/blood-2005-11-4745) - DOI - PubMed
    1. Meani N, Alcalay M. 2009. Role of nucleophosmin in acute myeloid leukemia. Expert Rev. Anticancer Ther. 9, 1283–1294. ( 10.1586/era.09.84) - DOI - PubMed

Publication types