

A comparison of dominance rank metrics reveals multiple competitive landscapes in an animal society
- PMID: 32900310
- PMCID: PMC7542799
- DOI: 10.1098/rspb.2020.1013
A comparison of dominance rank metrics reveals multiple competitive landscapes in an animal society
Abstract
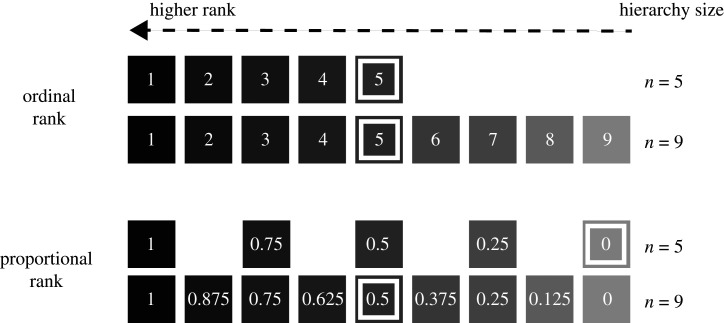
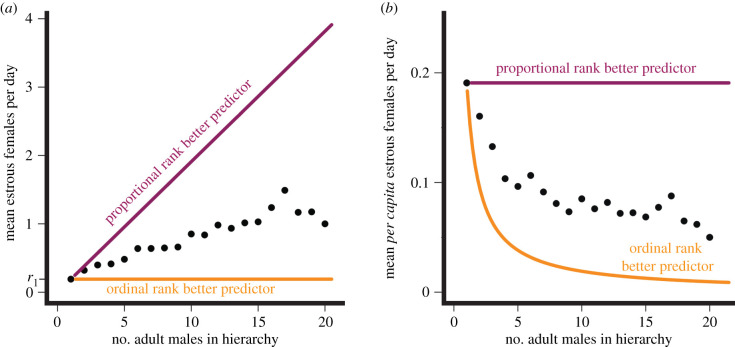
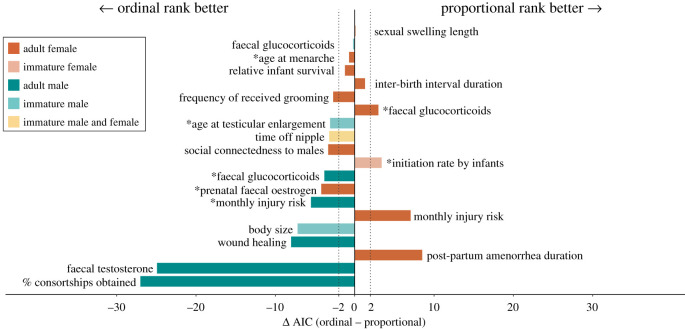
Across group-living animals, linear dominance hierarchies lead to disparities in access to resources, health outcomes and reproductive performance. Studies of how dominance rank predicts these traits typically employ one of several dominance rank metrics without examining the assumptions each metric makes about its underlying competitive processes. Here, we compare the ability of two dominance rank metrics-simple ordinal rank and proportional or 'standardized' rank-to predict 20 traits in a wild baboon population in Amboseli, Kenya. We propose that simple ordinal rank best predicts traits when competition is density-dependent, whereas proportional rank best predicts traits when competition is density-independent. We found that for 75% of traits (15/20), one rank metric performed better than the other. Strikingly, all male traits were best predicted by simple ordinal rank, whereas female traits were evenly split between proportional and simple ordinal rank. Hence, male and female traits are shaped by different competitive processes: males are largely driven by density-dependent resource access (e.g. access to oestrous females), whereas females are shaped by both density-independent (e.g. distributed food resources) and density-dependent resource access. This method of comparing how different rank metrics predict traits can be used to distinguish between different competitive processes operating in animal societies.
Keywords: baboons; longitudinal studies; proportional rank; relative rank; social dominance; standardized rank.
Conflict of interest statement
We declare we have no competing interests.
Figures
Similar articles
-
Higher dominance rank is associated with lower glucocorticoids in wild female baboons: A rank metric comparison.Horm Behav. 2020 Sep;125:104826. doi: 10.1016/j.yhbeh.2020.104826. Epub 2020 Aug 22. Horm Behav. 2020. PMID: 32758500 Free PMC article.
-
Persistence of maternal effects in baboons: Mother's dominance rank at son's conception predicts stress hormone levels in subadult males.Horm Behav. 2008 Aug;54(2):319-24. doi: 10.1016/j.yhbeh.2008.03.002. Epub 2008 Mar 20. Horm Behav. 2008. PMID: 18448106 Free PMC article.
-
Social affiliation matters: both same-sex and opposite-sex relationships predict survival in wild female baboons.Proc Biol Sci. 2014 Oct 22;281(1793):20141261. doi: 10.1098/rspb.2014.1261. Epub 2014 Sep 10. Proc Biol Sci. 2014. PMID: 25209936 Free PMC article.
-
Manifestations of domination: Assessments of social dominance in rodents.Genes Brain Behav. 2022 Mar;21(3):e12731. doi: 10.1111/gbb.12731. Epub 2021 Apr 11. Genes Brain Behav. 2022. PMID: 33769667 Free PMC article. Review.
-
Ageing and social rank effects on the reproductive system of free-ranging yellow baboons (Papio cynocephalus) at Mikumi National Park, Tanzania.Hum Reprod Update. 1998 Jul-Aug;4(4):430-8. doi: 10.1093/humupd/4.4.430. Hum Reprod Update. 1998. PMID: 9825857 Review.
Cited by
-
Costs dictate strategic investment in dominance interactions.Philos Trans R Soc Lond B Biol Sci. 2022 Feb 28;377(1845):20200447. doi: 10.1098/rstb.2020.0447. Epub 2022 Jan 10. Philos Trans R Soc Lond B Biol Sci. 2022. PMID: 35000443 Free PMC article.
-
Social and environmental predictors of gut microbiome age in wild baboons.bioRxiv [Preprint]. 2024 Dec 24:2024.08.02.605707. doi: 10.1101/2024.08.02.605707. bioRxiv. 2024. Update in: Elife. 2025 Apr 17;13:RP102166. doi: 10.7554/eLife.102166. PMID: 39131274 Free PMC article. Updated. Preprint.
-
Genetic ancestry predicts male-female affiliation in a natural baboon hybrid zone.Anim Behav. 2021 Oct;180:249-268. doi: 10.1016/j.anbehav.2021.07.009. Epub 2021 Aug 26. Anim Behav. 2021. PMID: 34866638 Free PMC article.
-
Demographic turnover can be a leading driver of hierarchy dynamics, and social inheritance modifies its effects.Philos Trans R Soc Lond B Biol Sci. 2023 Aug 14;378(1883):20220308. doi: 10.1098/rstb.2022.0308. Epub 2023 Jun 26. Philos Trans R Soc Lond B Biol Sci. 2023. PMID: 37381857 Free PMC article.
-
DNA methylation signatures of early life adversity are exposure-dependent in wild baboons.bioRxiv [Preprint]. 2023 Jun 5:2023.06.05.542485. doi: 10.1101/2023.06.05.542485. bioRxiv. 2023. Update in: Proc Natl Acad Sci U S A. 2024 Mar 12;121(11):e2309469121. doi: 10.1073/pnas.2309469121. PMID: 37333311 Free PMC article. Updated. Preprint.
References
-
- Huber P. 1802. Observations on several species of the genus Apis known by the name of Huble-bees, and called Bombinatrices by Linnaeus. Trans. Linn. Soc. Londn. 1, 214–298.
-
- Ewing L. 1972. Hierarchy and its relation to territory in the cockroach Nauphoeta cinera. Behavior 42, 152–174.
-
- Bovbjerg RV. 1953. Dominance order in the crayfish Orconectes virilis (Hagen). Physiol. Zool. 26, 173–178. (10.1086/physzool.26.2.30154514) - DOI
-
- Correa C, Baeza JA, Hinojosa IA, Thiel M. 2003. Male dominance hierarchy and mating tactics in the rock shrimp Rhynchocinetes typus (Decapoda: Caridea). J. Crustac. Biol. 23, 33–45. (10.1163/20021975-99990313) - DOI
-
- Newman MA. 1956. Social behavior and interspecific competition in two trout species. Physiol. Zool. 29, 64–81. (10.1086/physzool.29.1.30152381) - DOI
Publication types
MeSH terms
Associated data
Grants and funding
LinkOut - more resources
Full Text Sources
