. 2020 Sep;8(1):e001242.
doi: 10.1136/bmjdrc-2020-001242.

Anti-inflammatory, antioxidant and renoprotective effects of SOCS1 mimetic peptide in the BTBR ob/ob mouse model of type 2 diabetes

Affiliations

Anti-inflammatory, antioxidant and renoprotective effects of SOCS1 mimetic peptide in the BTBR ob/ob mouse model of type 2 diabetes

Lucas Opazo-Ríos et al. BMJ Open Diabetes Res Care. 2020 Sep.

Abstract

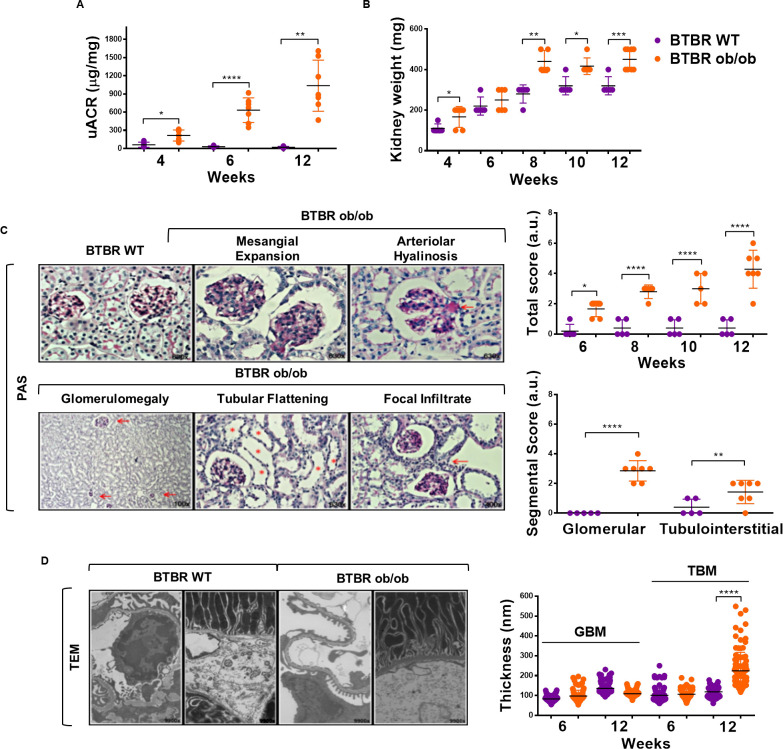
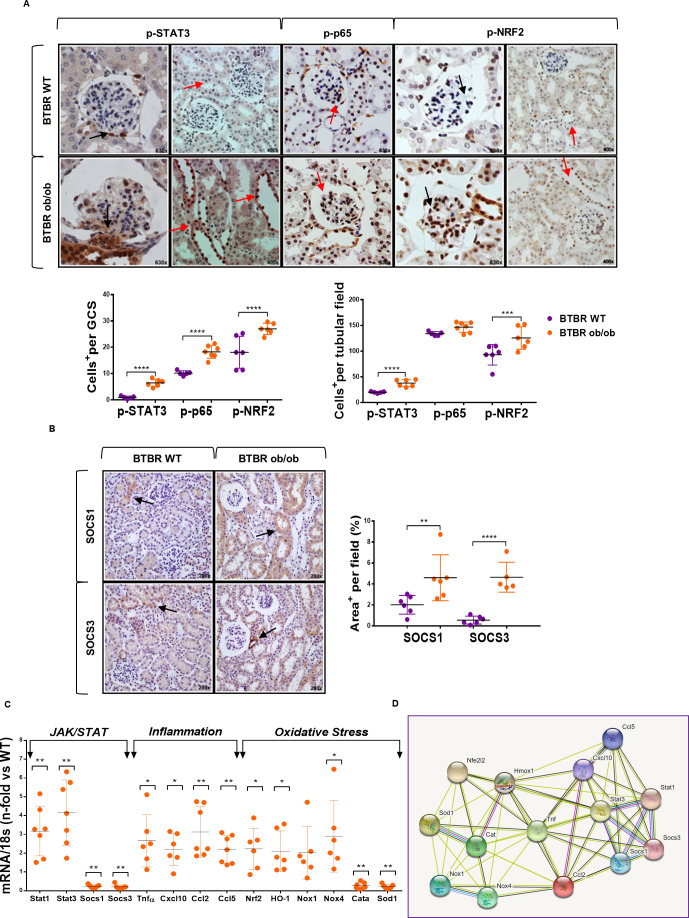
Introduction: Diabetic nephropathy (DN) is the leading cause of chronic kidney disease worldwide. The Janus kinase/signal transducers and activators of transcription (JAK/STAT) pathway participates in the development and progression of DN. Among the different mechanisms involved in JAK/STAT negative regulation, the family of suppressor of cytokine signaling (SOCS) proteins has been proposed as a new target for DN. Our aim was to evaluate the effect of SOCS1 mimetic peptide in a mouse model of obesity and type 2 diabetes (T2D) with progressive DN.

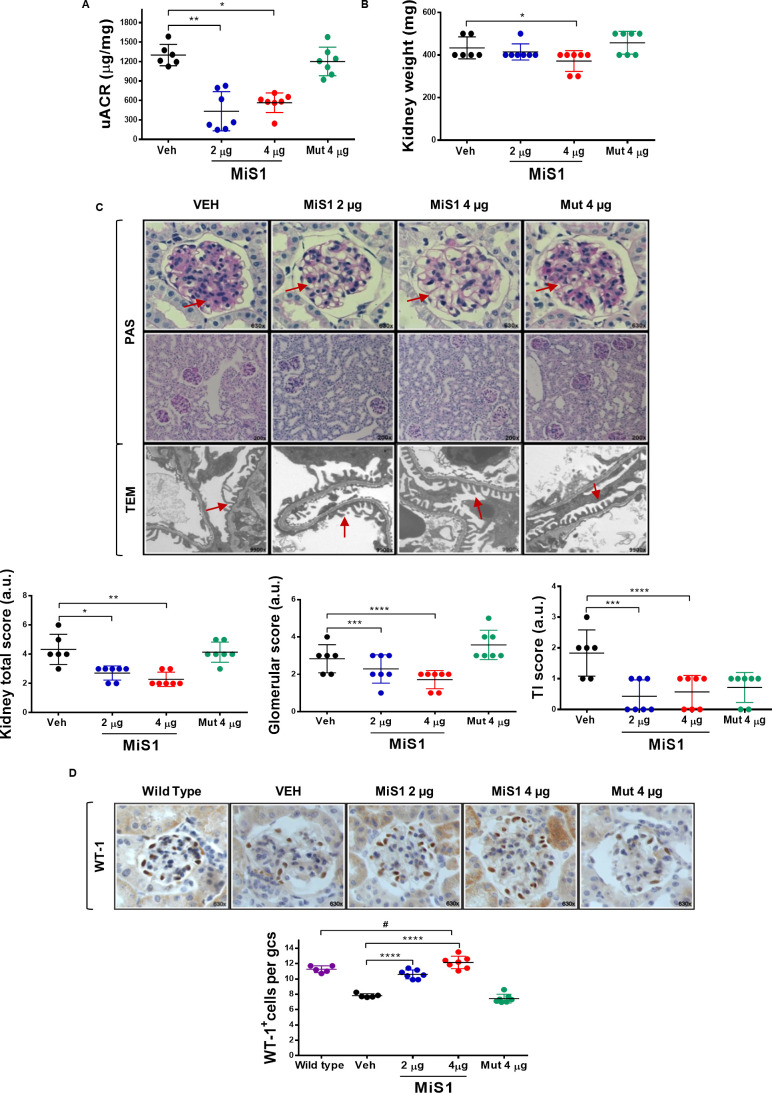
Research design and methods: Six-week-old BTBR (black and tan brachyuric) mice with the ob/ob (obese/obese) leptin-deficiency mutation were treated for 7 weeks with two different doses of active SOCS1 peptide (MiS1 2 and 4 µg/g body weight), using inactive mutant peptide (Mut 4 µg) and vehicle as control groups. At the end of the study, the animals were sacrificed to obtain blood, urine and kidney tissue for further analysis.

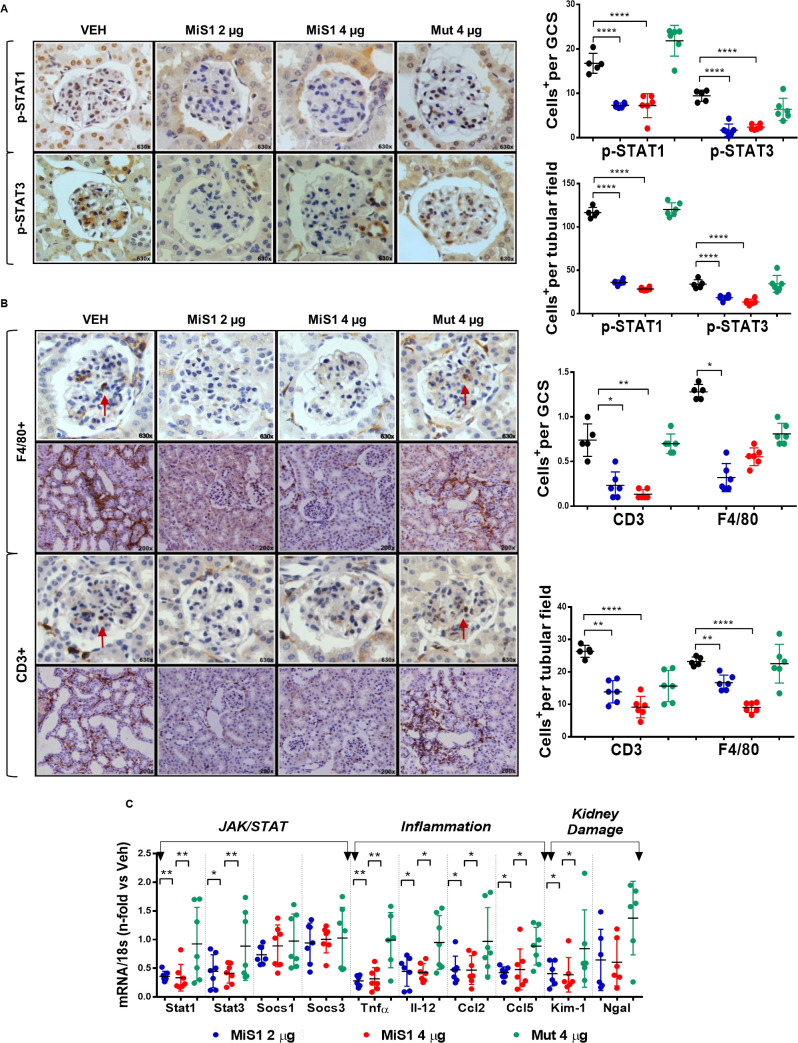
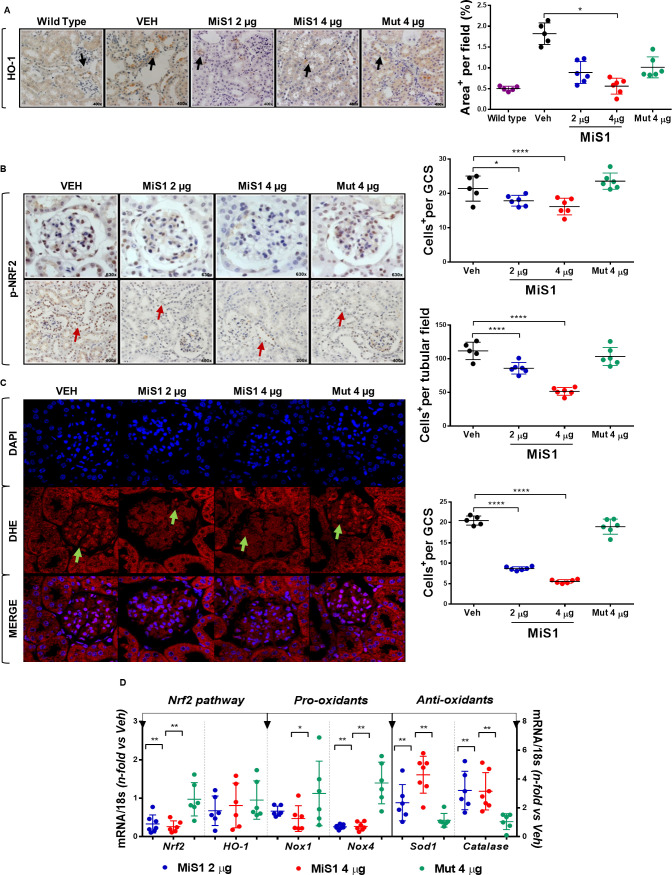
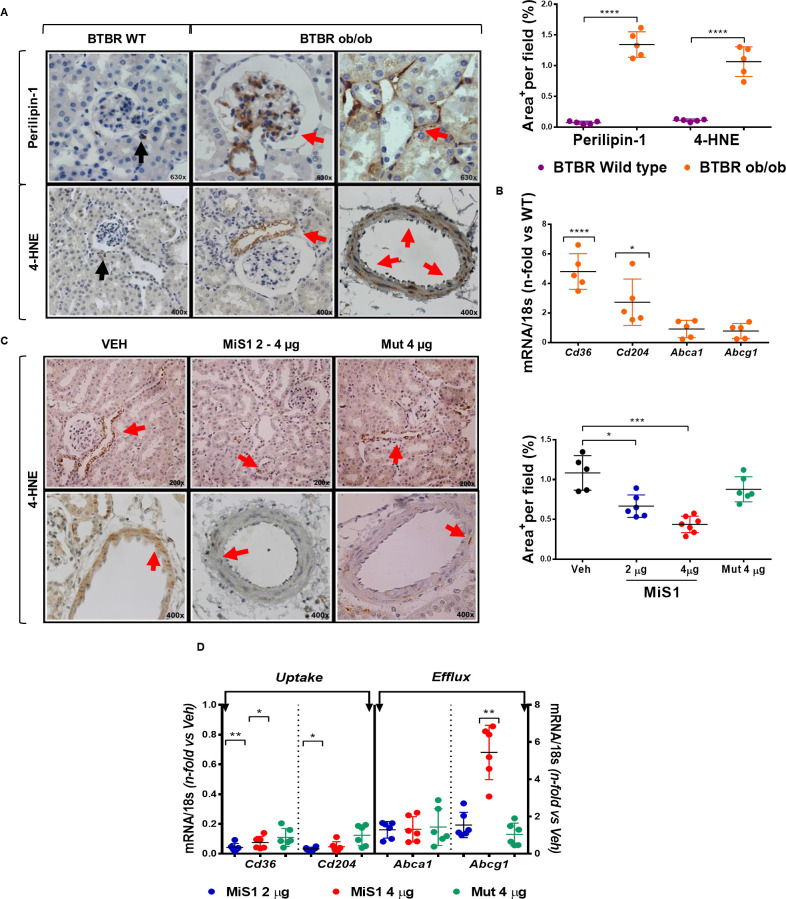
Results: Treatment of diabetic mice with active peptide significantly decreased urine albumin to creatinine ratio by up to 50%, reduced renal weight, glomerular and tubulointerstitial damage, and restored podocyte numbers. Kidneys from treated mice exhibited lower inflammatory infiltrate, proinflammatory gene expression and STAT activation. Concomitantly, active peptide administration modulated redox balance markers and reduced lipid peroxidation and cholesterol transporter gene expression in diabetic kidneys.

Conclusion: Targeting SOCS proteins by mimetic peptides to control JAK/STAT signaling pathway ameliorates albuminuria, morphological renal lesions, inflammation, oxidative stress and lipotoxicity, and could be a therapeutic approach to T2D kidney disease.

Keywords: albuminuria; inflammation and oxidative stress; lipotoxicity; type 2 diabetes.


Conflict of interest statement

Competing interests: JE and CG-G are inventors on a patent application regarding clinical utility of SOCS peptide.

Figures

Figure 1
Figure 1
Kidney damage markers in BTBR ob/ob model. BTBR ob/ob diabetic mice (orange dots) and their respective control, BTBR WT non-diabetic mice (purple dots), were studied from 4 to 12 weeks old. (A) Progression of urinary albumin to creatinine ratio (UACR) from 6 weeks old. (B) Progression of kidney weight in BTBR WT and BTBR ob/ob mice at 12 weeks. (C) Evolution of kidney damage in BTBR ob/ob was measured starting from week 6 to week 12 by histopathological kidney score. Shown are representative images of histopathological features observed in kidney tissue sections with periodic acid Schiff (PAS) staining in 12-week-old mice. Magnification ×100, ×400 and ×630. (D) Representative images of thickening of the glomerular and tubular basal membrane by transmission electron microscopy (TEM) and quantified by 100 measurements in each representative animal of renal damage, BTBR WT and BTBR ob/ob at 6 and 12 weeks old. Magnification ×9900. Data are shown as scatter dot plots and mean±SD of each group (n=5–7 mice/group); *p<0.05, **p<0.01, ***p<0.001, ****p<0.0001 versus BTBR WT control. a.u., arbitrary units; BTBR, black and tan brachyuric; GBM, glomerular basal membrane; ob/ob, obese/obese; TBM, tubular basal membrane; WT, wild type.
Figure 2
Figure 2
JAK/STAT, inflammatory and oxidative stress pathways in kidney tissue of BTBR ob/ob model. (A) Representative images of phosphorylated (p-)STAT3, p-p65 NF-κB and p-NRF2, and quantification of positive cells in glomerular and tubular fields of BTBR WT and ob/ob mice. Magnification ×400 and ×630. Arrows indicate positive stained cells. (B) Representative images of SOCS1/SOCS3 proteins and quantification of positive stained area per tubular field. Magnification ×200. (C) Real-time PCR analysis of JAK/STAT, inflammatory and oxidative stress genes. Values normalized by endogenous control gene 18s are expressed as n-fold of the average value from BTBR WT. Data are shown as scatter dot plots and mean±SD of each group (n=5–7 mice/group); *p<0.05, **p<0.01, ***p<0.001, ****p<0.0001 versus BTBR WT control. (D) Schematic protein–protein interaction prediction of JAK/STAT, inflammatory and oxidative stress markers in Mus musculus according to STRING software. More information can be found at https://string-db.org/. a.u., arbitrary units; BTBR, black and tan brachyuric; GCS, glomerular cross section; JAK/STAT, Janus kinase/signal transducers and activators of transcription; NF-κB, nuclear factor-κB; NRF2, nuclear factor erythroid 2-related factor 2; ob/ob, obese/obese; SOCS, suppressor of cytokine signaling; WT, wild type.
Figure 3
Figure 3
MiS1 treatment reduces kidney damage markers in BTBR ob/ob model. Graphs and images represent the changes observed in diabetic mice treated with active MiS1 (2 µg and 4 µg) and inactive mutated peptide (Mut 4 µg) compared with vehicle controls (Veh). (A) Urinary albumin creatinine ratio (UACR). (B) Kidney weight. (C) Representative images of light microscopy of glomerular and tubular fields stained with PAS and the quantification of histopathological total score. Magnification ×200 and ×630. Additionally, TEM of glomerular filtration barrier was observed. Magnification ×9900. Arrows indicate areas of mesangial expansion (PAS images) and pedicelar effacement (TEM images). (D) Immunohistochemistry against WT-1 protein, used as podocyte marker. Graphs represent the average number of WT-1+ cells per glomerular cross section (GCS) in BTBR WT and ob/ob (vehicle and treatments). Magnification ×630. Data are shown as scatter dot plots and mean±SD of each group (n=5–7 mice/group); #p<0.05 versus BTBR WT; *p<0.05, **p<0.01, ****p<0.0001 versus diabetic vehicle control. a.u., arbitrary units; BTBR, black and tan brachyuric; ob/ob, obese/obese; PAS, periodic acid Schiff; TI, tubulointerstitial; TEM, transmission electron microscopy; WT-1, Wilms tumor protein-1.
Figure 4
Figure 4
MiS1 treatment inhibits kidney JAK/STAT activation and renal microinflammatory milieu in the BTBR ob/ob model. (A) Graphs and images represent the changes observed in JAK/STAT activation (p-STATs) in diabetic mice treated with active MiS1 (2 µg and 4 µg) and inactive mutated peptide (Mut 4 µg) compared with vehicle controls (Veh), quantified per number of positive cells p-STAT1+ and p-STAT3+, both at the glomerular and tubular fields. Magnification ×630. (B) Representative images of immunohistochemistry against F4/80 and CD3. Magnification ×200 and ×630. Graphs represent the quantification of average number of monocytes/macrophages F4/80+ and CD3+ T lymphocytes, both at the glomerular and interstitial fields. Arrows indicate positively stained cells. (C) Gene expression analysis of mRNA related with JAK/STAT pathway (Stat1, Stat3, Socs1 and Socs3), inflammatory cytokines (Tnfα and Il-12) and chemokines (Mcp-1 and Rantes), and kidney damage markers (Kim-1 and Ngal) were evaluated by real-time PCR, being normalized in each sample by endogenous control gene 18s and expressed as n-fold the average value obtained in the vehicle group (Veh). Data are shown as scatter dot plots and mean±SD of each group (n=6–7 mice/group); *p<0.05, **p<0.01, ****p<0.0001 versus diabetic vehicle control. BTBR, black and tan brachyuric; GCS, glomerular cross section; JAK/STAT, Janus kinase/signal transducers and activators of transcription; ob/ob, obese/obese.
Figure 5
Figure 5
MiS1 treatment modulates NRF2 activation, superoxide anion production and gene expression of redox balance markers in BTBR ob/ob model. (A) Graphs and images represent the changes observed in immunohistochemistry against heme-oxygenase-1 in BTBR WT, vehicle and each of the groups treated (2 µg, 4 µg and Mut 4 µg), quantified per analysis of percentage of the positive staining area per tubular field. Magnification ×400. (B) Graphs and images represent the changes observed in NRF2 activation (p-NRF2) in diabetic mice treated with active MiS1 (2 µg and 4 µg) and inactive mutated peptide (Mut 4 µg) compared with vehicle controls (Veh), quantified per number of positive cells p-NRF2+, both at the glomerular and tubular fields. Magnification ×200–×630. Arrows indicate positive staining. (C) Representative fluorescence images of superoxide anion (DHE, red), cell nuclei (DAPI, blue) and merge. Arrows show positive staining of superoxide anion at the glomerular level. Graph shows DHE-positive cells per glomerular field. Magnification ×630. (D) Gene expression analysis of mRNA related with Nrf2 pathway (Nrf2, HO-1), pro-oxidants enzymes (Nox1, Nox4) and antioxidants enzymes (Sod1, Catalase) was evaluated by real-time PCR. Values normalized by endogenous control gene 18s are expressed as n-fold of the average value obtained in the vehicle group (Veh). Data are shown as scatter dot plots and mean±SD of each group (n=6–7 mice/group); *p<0.05, **p<0.01, ****p<0.0001 versus diabetic vehicle control. BTBR, black and tan brachyuric; DAPI, 4′,6-diamidino-2-phenylindole; DHE, dihydroethidium; GCS, glomerular cross section; Mut 4 μg, inactive mutated peptide; NRF2, nuclear factor erythroid 2-related factor 2; ob/ob, obese/obese; WT, wild type.
Figure 6
Figure 6
MiS1 treatment reduces tubular and vascular lipid peroxidation and modulates gene expression of scavenger receptors in BTBR ob/ob model. (A) Presence of intrarenal lipids was evidenced by immunohistochemistry against perilipin-1 and 4-HNE in BTBR WT (purple dots) and BTBR ob/ob (orange dots) mice. Isolated specific perilipin-1 and 4-HNE positive cells were observed in non-diabetic BTBR WT mice (black arrow). Mesangial, tubular and vascular staining was observed in diabetic BTBR ob/ob mice (red arrow). Magnification ×400–×630. Quantitative analysis of percentage of the positive staining area per tubular field was determined in 12-week-old non-diabetic control and diabetic mice. (B) Gene expression analyses of scavenger receptors associated with fatty acid uptake (SR-B/Cd36, SR-A/Cd204) and reverse cholesterol transport (Abca1, Abcg1) were evaluated by real-time PCR. Values normalized by endogenous control gene 18s are expressed as n-fold of the average value obtained in the BTBR WT. (C) Images represent the changes observed in immunohistochemistry against 4-HNE+ tubular and vascular area in vehicle and each of the groups treated (2 µg, 4 µg and Mut 4 µg), quantified per analysis of percentage of the positive staining area per tubular field. Magnification ×200 and ×400. (D) Gene expression analysis of indicated genes was evaluated by real-time PCR, and normalized values expressed as fold increase versus vehicle group (Veh). Data are shown as scatter dot plots and mean±SD of each group (n=5–7 mice/group); *p<0.05, **p<0.01, ***p<0.001, ****p<0.0001 versus BTBR WT or diabetic vehicle control. BTBR, black and tan brachyuric; 4-HNE, 4-hydroxy-2-nonenal; Mut 4 μg, inactive mutated peptide; ob/ob, obese/obese; WT, wild type.

References

    1. Yang W, Dall TM, Beronjia K, et al. Economic costs of diabetes in the U.S. in 2017. Diabetes Care 2018;41:917–28. 10.2337/dci18-0007 - DOI - PMC - PubMed
    1. Gnudi L, Coward RJM, Long DA. Diabetic nephropathy: perspective on novel molecular mechanisms. Trends Endocrinol Metab 2016;27:820–30. 10.1016/j.tem.2016.07.002 - DOI - PubMed
    1. MacIsaac RJ, Jerums G, Ekinci EI. Effects of glycaemic management on diabetic kidney disease. World J Diabetes 2017;8:172. 10.4239/wjd.v8.i5.172 - DOI - PMC - PubMed
    1. Chang Y-C, Chang EY-C, Chuang L-M. Recent progress in the genetics of diabetic microvascular complications. World J Diabetes 2015;6:715. 10.4239/wjd.v6.i5.715 - DOI - PMC - PubMed
    1. Wynn TA, Ramalingam TR. Mechanisms of fibrosis: therapeutic translation for fibrotic disease. Nat Med 2012;18:1028–40. 10.1038/nm.2807 - DOI - PMC - PubMed

Publication types

MeSH terms

Substances