

The Pathological Evolution of Glucose Response Curves During the Progression to Type 1 Diabetes in the TrialNet Pathway to Prevention Study
- PMID: 32900788
- PMCID: PMC7576415
- DOI: 10.2337/dc20-0701
The Pathological Evolution of Glucose Response Curves During the Progression to Type 1 Diabetes in the TrialNet Pathway to Prevention Study
Abstract
Objective: Glucose response curves (GRCs) during oral glucose tolerance tests (OGTTs) are predictive of type 1 diabetes. We performed a longitudinal analysis in pancreatic autoantibody-positive individuals to assess 1) characteristic GRC changes during progression to type 1 diabetes and 2) GRC changes in relation to β-cell function changes and to combined glucose and C-peptide response curve (GCRC) changes.
Research design and methods: Among antibody-positive individuals with serial OGTTs in the TrialNet Pathway to Prevention study, GRC changes from first to last OGTTs were compared between progressors (n = 298) to type 1 diabetes and nonprogressors (n = 2,216). GRC changes from last OGTT before diagnosis to diagnostic OGTTs were studied in progressors.
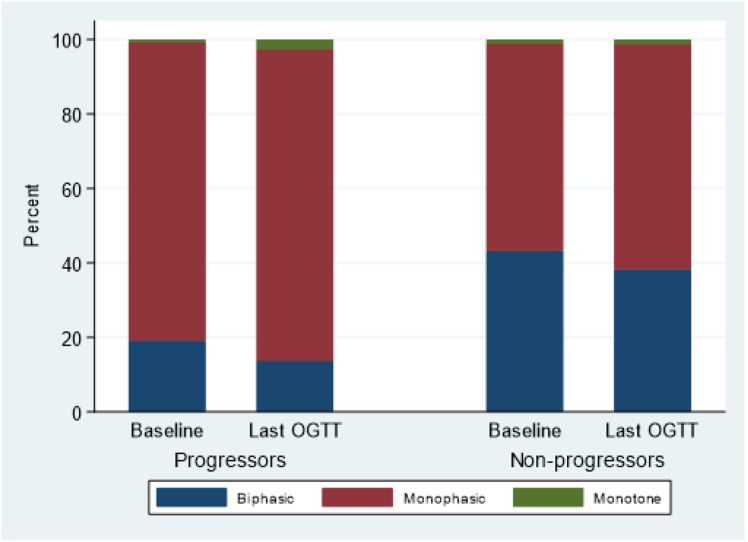
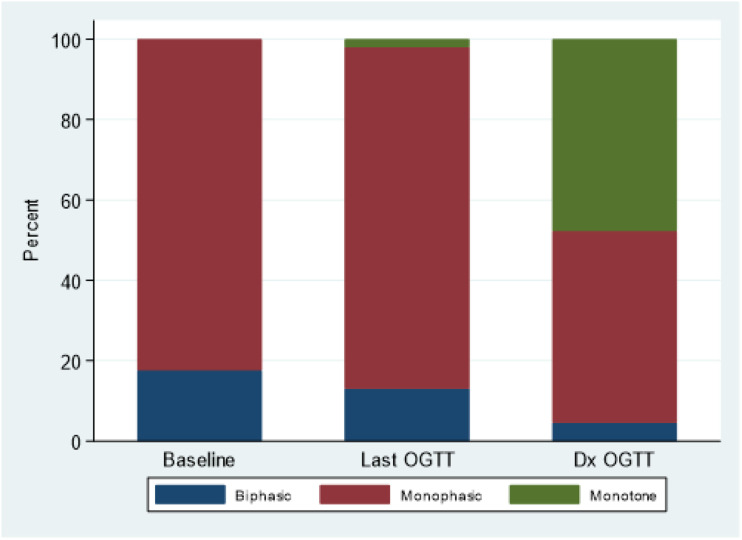
Results: GRCs changed more frequently from biphasic (two peaks) to monophasic (one peak) GRCs between first and last OGTTs in progressors than in nonprogressors (75.4% vs. 51.0%, respectively; P < 0.001). In contrast, GRCs of progressors changed less frequently from monophasic to biphasic than those of nonprogressors (12.6% vs. 30.6%; P < 0.001). Monotonic (continuous increase) GRCs were present in 47.7% of progressors at diagnosis. The early (30-0 min) C-peptide response decreased in progressors with GRCs changing from biphasic to monophasic between first and last OGTTs (P < 0.001) and from monophasic to monotonic between last and diagnostic OGTTs (P < 0.001). Conversely, the early C-peptide response increased among nonprogressors with GRCs changing from monophasic to biphasic (P < 0.001). Changes in GRCs were related to changes in GCRCs.
Conclusions: Characteristic GRC changes, biphasic to monophasic to monotonic, occur during the progression to type 1 diabetes. These GRC changes correspond to decreasing β-cell function.
© 2020 by the American Diabetes Association.
Figures

References
-
- Tschritter O, Fritsche A, Shirkavand F, Machicao F, Häring H, Stumvoll M. Assessing the shape of the glucose curve during an oral glucose tolerance test. Diabetes Care 2003;26:1026–1033 - PubMed
-
- Kanauchi M, Kimura K, Kanauchi K, Saito Y. Beta-cell function and insulin sensitivity contribute to the shape of plasma glucose curve during an oral glucose tolerance test in non-diabetic individuals. Int J Clin Pract 2005;59:427–432 - PubMed
-
- Trujillo-Arriaga HM, Román-Ramos R. Fitting and evaluating the glucose curve during a quasi continuous sampled oral glucose tolerance test. Comput Biol Med 2008;38:185–195 - PubMed
-
- Abdul-Ghani MA, Lyssenko V, Tuomi T, Defronzo RA, Groop L. The shape of plasma glucose concentration curve during OGTT predicts future risk of type 2 diabetes. Diabetes Metab Res Rev 2010;26:280–286 - PubMed
Publication types
MeSH terms
Substances
Associated data
Grants and funding
- U01 DK085476/DK/NIDDK NIH HHS/United States
- U01 DK061010/DK/NIDDK NIH HHS/United States
- U01 DK106993/DK/NIDDK NIH HHS/United States
- U01 DK103282/DK/NIDDK NIH HHS/United States
- U01 DK061042/DK/NIDDK NIH HHS/United States
- U01 DK085509/DK/NIDDK NIH HHS/United States
- U01 DK085466/DK/NIDDK NIH HHS/United States
- U01 DK103153/DK/NIDDK NIH HHS/United States
- U01 DK061058/DK/NIDDK NIH HHS/United States
- UL1 TR002529/TR/NCATS NIH HHS/United States
- U01 DK085453/DK/NIDDK NIH HHS/United States
- U01 DK106984/DK/NIDDK NIH HHS/United States
- U01 DK085499/DK/NIDDK NIH HHS/United States
- U01 DK107013/DK/NIDDK NIH HHS/United States
- U01 DK103266/DK/NIDDK NIH HHS/United States
- UC4 DK106993/DK/NIDDK NIH HHS/United States
- KL2 TR002530/TR/NCATS NIH HHS/United States
- U01 DK107014/DK/NIDDK NIH HHS/United States
- U01 DK106994/DK/NIDDK NIH HHS/United States
- U01 DK061034/DK/NIDDK NIH HHS/United States
- U01 DK085461/DK/NIDDK NIH HHS/United States
- U01 DK103180/DK/NIDDK NIH HHS/United States
- U01 DK085465/DK/NIDDK NIH HHS/United States
- U01 DK085504/DK/NIDDK NIH HHS/United States
LinkOut - more resources
Full Text Sources
Medical
