. 2020 Sep 8;3(11):e201900571.
doi: 10.26508/lsa.201900571. Print 2020 Nov.

Multiplexed chemogenetics in astrocytes and motoneurons restore blood-spinal cord barrier in ALS

Affiliations

Multiplexed chemogenetics in astrocytes and motoneurons restore blood-spinal cord barrier in ALS

Najwa Ouali Alami et al. Life Sci Alliance. .

Abstract

Blood-spinal cord barrier (BSCB) disruption is thought to contribute to motoneuron (MN) loss in amyotrophic lateral sclerosis (ALS). It is currently unclear whether impairment of the BSCB is the cause or consequence of MN dysfunction and whether its restoration may be directly beneficial. We revealed that SOD1 G93A , FUS ΔNLS , TDP43 G298S , and Tbk1 +/- ALS mouse models commonly shared alterations in the BSCB, unrelated to motoneuron loss. We exploit PSAM/PSEM chemogenetics in SOD1 G93A mice to demonstrate that the BSCB is rescued by increased MN firing, whereas inactivation worsens it. Moreover, we use DREADD chemogenetics, alone or in multiplexed form, to show that activation of Gi signaling in astrocytes restores BSCB integrity, independently of MN firing, with no effect on MN disease markers and dissociating them from BSCB disruption. We show that astrocytic levels of the BSCB stabilizers Wnt7a and Wnt5a are decreased in SOD1 G93A mice and strongly enhanced by Gi signaling, although further decreased by MN inactivation. Thus, we demonstrate that BSCB impairment follows MN dysfunction in ALS pathogenesis but can be reversed by Gi-induced expression of astrocytic Wnt5a/7a.


Conflict of interest statement

The authors declare that they have no conflict of interest.

Figures

Figure S1.
Figure S1.. Stability of mutant protein expression in amyotrophic lateral sclerosis mouse models over time.
(A, B) The expression of the mutant human SOD1 in SOD1G93A transgenic mice (B6SJL background) is stable across the P50, P90, and P120 time points (normalized for GAPDH). (C, D) Persistent and comparable protein expression of the mutant TDP-43 transgene in TDP-43G298S (B6SJLF1 background) at P150, P360, and P510 (normalized for GAPDH). (E, F) Stable protein expression of mutant FUS in the spinal cord lysate of knock-in FUSΔNLS/+ and WT mice; as expected, the expression of the mutant FUS is comparable with that of WT-FUS in the WT littermates. (G, H) Levels of TBK1 are persistently reduced in Tbk1+/− mice (normalized for actin). Data information: in (B, D, F, H), data are presented as means ± SD. **P < 0.01, ***P < 0.001, ****P < 0.0001 (two-way ANOVA [genotype × time point] with Bonferroni correction for multiple comparisons).
Figure S2.
Figure S2.. Quantification of motoneuron loss in SOD1, FUS, TDP-43and Tbk1 amyotrophic lateral sclerosis mouse models.
(A, C, E, G) Representative pictures of MN counts over time in the ventral horn of the lumbar spinal cord of (A) P20, P50, and P80 WT and SOD1G93A mice (B6SJL background); (C) P150, P360, and P510 WT and TDP-43G298S mice (B6SJLF1 background); (E) P150, P270, and P450 WT and FUSΔNLS/+mice (C57BI6 background); and (G) P270 and P450 WT and Tbk1+/− mice (B6.129P2 background). MNs are identified by choline acetyltransferase (ChAT) immunostaining (green). White dotted lines mark the border between white and gray matter. (B, D, F, H) Quantification of the ChAT+ cell number per section in the ventral horn of the lumbar spinal cord from (B) WT and transgenic SOD1G93A mice (N = 4) at P20, P50, and P80; (D) WT and TDP-43G298S mice (N = 3) at P150, P360, and P510; (F) WT and FUSΔNLS/+ mice (N = 3) at P150, P270, and P450; and WT and Tbk1+/− mice (N = 3) at P270 and P450 (n = 6 sections per mouse). Scale bars: 10 μm. Data information: in (B, D, F, H), data are presented as means ± SD. *P < 0.01, **P < 0.001, ***P < 0.0001, ****P < 0.0001 (two-way ANOVA [genotype × time point] with Bonferroni correction for multiple comparisons).
Figure 1.
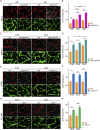
Figure 1.. Altered claudin-5 distribution in the spinal cord microvessels of SOD1, FUS, TDP-43 and Tbk1 amyotrophic lateral sclerosis mouse models.
(A, C, E, G) Representative pictures of ventral horn of the lumbar spinal cord sections stained for claudin-5 (CLN-5 [red]) and collagen-IV (COL-IV [green]) of (A) P20 and P80 WT and SOD1G93A mice (B6SJL background), (C) P150 and P510 WT and TDP-43G298S mice (B6SJLF1 background), (E) P150 and P450 WT and FUSΔNLS/+mice (C57BI6 background), and (G) P270 and P450 WT and Tbk1+/− mice (B6.129P2 background). CLN-5 breaks are indicated by yellow lines (drawn with ImageJ software), underlining the discontinuity of CLN-5 ribbon. (B, D, F, H) Quantification of the capillary bed length (identified by COL-IV immunostaining) devoid of CLN-5 ribbon-like immunolabeling (break length) in the ventral horn of the spinal cord capillaries from (B) WT and transgenic SOD1G93A mice (N = 4) at P20, P50, and P80; (D) WT and TDP-43G298S mice (N = 3) at P150, P360, and P510; (F) WT and FUSΔNLS/+ mice (N = 3) at P150, P270, and P450; and WT and Tbk1+/− mice (N = 3) at P270 and P450. The quantifications are expressed as % of the total vessel length (n = 6 sections per mouse). Scale bars: 20 μm. Data information: in (B, D, F, H), data are presented as means ± SD. *P < 0.01, **P < 0.001, ***P < 0.0001, ****P < 0.0001 (two-way ANOVA [genotype × time point] with Bonferroni correction for multiple comparisons).
Figure 2.
Figure 2.. Altered zonula occludens-1 (ZO-1) distribution in the spinal microvessels of SOD1, FUS, TDP-43 and Tbk1 amyotrophic lateral sclerosis mouse models.
(A, C, E, G) Representative pictures of ventral horn of the lumbar spinal cord sections stained for ZO-1 (red) and Lycopersicon esculentum (tomato) lectin (LEL [green]) of (A) P20, P50, and P80 WT and SOD1G93A mice (B6SJL background); (C) P150, P360, and P510 WT and TDP-43G298S mice (B6SJLF1 background); (E) P150, P270, and P450 WT and FUSΔNLS/+mice (C57BI6 background); and (G) P270 and P450 WT and Tbk1+/− mice (B6.129P2 background). ZO-1 breaks are indicated by yellow lines (drawn with ImageJ software), underlining the discontinuity of ZO-1 ribbon. (B, D, F, H) Quantification of the capillary bed length (identified by LEL immunostaining) devoid of ZO-1 ribbon-like immunolabeling (break length) in the ventral horn of the spinal cord capillaries from (B) WT and transgenic SOD1G93A mice (N = 4) at P20, P50, and P80; (D) WT and TDP-43G298S mice (N = 3) at P150, P360, and P510; (F) WT and FUSΔNLS/+ mice (N = 3) at P150, P270, and P450; and WT and Tbk1+/− mice (N = 3) at P270 and P450. The quantifications are expressed as % of the total vessel length (n = 6 sections per mouse). Scale bars: 20 μm. Data information: in (B, D, F, H), data are presented as means ± SD. *P < 0.01, **P < 0.001, ***P < 0.0001, ****P < 0.0001 (two-way ANOVA [genotype × time point] with Bonferroni correction for multiple comparisons).
Figure 3.
Figure 3.. Overall vascular density in SOD1, FUS, TDP-43 and Tbk1 amyotrophic lateral sclerosis mouse models.
(A, C, E, G) Representative pictures of microvasculature ramification in the ventral horn of the lumbar spinal cord of (A) P20, P50, and P80 WT and SOD1G93A mice (B6SJL background); (C) P150, P360, and P510 WT and TDP-43G298S mice (B6SJLF1 background), (E) P150, P270, and P450 WT and FUSΔNLS/+mice (C57BI6 background); and (G) P270 and P450 WT and Tbk1+/− mice (B6.129P2 background). The microvessel walls are stained with collagen-IV (COL-IV [green]), specific for type 4 collagen in the basal lamina. (B, D, F, H) Quantification of the COL-IV+ area in the ventral horn of the spinal cord from (B) WT and transgenic SOD1G93A mice (N = 4) at P20, P50, and P80; (D) WT and TDP-43G298S mice (N = 3) at P150, P360, and P510; (F) WT and FUSΔNLS/+ mice (N = 3) at P150, P270, and P450; and WT and Tbk1+/− mice (N = 3) at P270 and P450. The quantifications are expressed as % of COL-IV+ area per total area (n = 6 sections per mouse). Scale bars: 10 μm. Data information: in (B, D, F, H), data are presented as means ± SD. *P < 0.01, **P < 0.001, ***P < 0.0001, ****P < 0.0001 (two-way ANOVA [genotype × time point] with Bonferroni correction for multiple comparisons).
Figure S3.
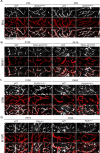
Figure S3.. PECAM-1+ endothelial cells line all COL-IV+ vessels in the spinal cord of SOD1, FUS, TDP-43 and Tbk1 amyotrophic lateral sclerosis mouse models.
(A, B, C, D) Representative pictures of microvasculature ramification in the ventral horn of the lumbar spinal cord of (A) P20 and P80 in WT and SOD1G93A mice (B6SJL background), (B) P150 and P510 in WT and TDP-43G298S mice (B6SJLF1 background), (C) P150 and P450 in WT and FUSΔNLS/+mice (C57BI6 background), and (D) P270 and P450 in WT and Tbk1+/− mice (B6.129P2 background). The microvessel walls are stained with collagen-IV (COL-IV [red]), specific for type 4 collagen in the basal lamina and PECAM-1 (white) specific for defining endothelial origin. Analysis is from N = 3 mice per group of experiments. Scale bars: 20 μm.
Figure 4.
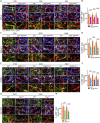
Figure 4.. Altered aquaporin-4+ astrocytic end-feet coverage of spinal cord vessels in SOD1, FUS, TDP-43 and Tbk1 amyotrophic lateral sclerosis mouse models.
(A, C, E, G) Representative images of astrocytic end-feet coverage around the vessels (red), immunostained with aquaporin-4 (AQP4 [green]) in the ventral horn of the lumbar spinal cord of (A) P20, P50, and P80 WT and SOD1G93A mice (B6SJL background); (C) P150, P360, and P510 WT and TDP-43G298S mice (B6SJLF1 background); (E) P150, P270, and P450 WT and FUSΔNLS/+mice (C57BI6 background); and (G) P270 and P450 WT and Tbk1+/− mice (B6.129P2 background). The first row shows the overlap of AQP4 surrounding the vessels, labeled with Lycopersicon esculentum (tomato) lectin (LEL [red]); the second row shows the extremity of astrocytes, immunolabeled with glial fibrillary acidic protein (white), wrapping the capillaries (red). Nuclei are detected by DAPI staining (blue); the third row represents a high magnification of the insert in the first row (white rectangle) and displays the distribution of AQP4 on the LEL+ endothelium, as a marker of blood–spinal cord barrier stability. The magnified pictures do not include DAPI staining. Scale bar: 20 μm. (B, D, F, H) Quantification of the AQP4+ area, expressed as % of the total vessel area in the ventral horn of the spinal cord from (B) WT and transgenic SOD1G93A mice (N = 4) at P20, P50, and P80; (D) WT and TDP-43G298S mice (N = 3) at P150, P360, and P510; (F) WT and FUSΔNLS/+ mice (N = 3) at P150, P270, and P450; and WT and Tbk1+/− mice (N = 3) at P270 and P450; (n = 6 sections per mouse). Scale bars: 10 μm. Data information: in (B, D, F, H), data are presented as means ± SD. ****P < 0.0001 (two-way ANOVA [genotype × time point] with Bonferroni correction for multiple comparisons).
Figure S4.
Figure S4.. Astrocytes density in the ventral horn of the spinal cord from SOD1, FUS, TDP-43 and Tbk1.
(A, D, G, J) Representative pictures of astrocytic distribution, identified by immunolabeling GFAP+ cells and area (white) in the ventral horn of the lumbar spinal cord of (A) P20, P50, and P80 WT and SOD1G93A mice; (D) P150, P360, and P510 WT and TDP-43G298S mice (B6SJLF1 background); (G) P150, P270, and P450 WT and FUSΔNLS/+mice (C57BI6 background); and (J) P270 and P450 WT and Tbk1+/− mice (B6.129P2 background). Nuclei are stained with DAPI (blue). (B, E, H, K) Number of GFAP+ cells per area (104 μm). (B, C, D, F, I, L) Quantification of % GFAP+ area versus total ventral horn area in the lumbar spinal cord from (B) WT and transgenic SOD1G93A mice (N = 4) at P20, P50, and P80; (D) WT and TDP-43G298S mice (N = 3) at P150, P360, and P510; (F) WT and FUSΔNLS/+ mice (N = 3) at P150, P270, and P450; and WT and Tbk1+/− mice (N = 3) at P270 and P450; (n = 6 sections per mouse). The values are expressed as % of the GFAP+ area per total area. Scale bars: 10 μm. Data information: in (B, C, E, F, H, I, K, L), data are presented as means ± SD. *P < 0.01, **P < 0.001, ***P < 0.0001, ****P < 0.0001 (two-way ANOVA [genotype × time point] with Bonferroni correction for multiple comparisons).
Figure 5.
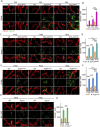
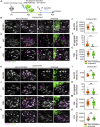
Figure 5.. Albumin extravasation demonstrates functional impairment of the blood–spinal cordbarrier in SOD1, FUS, TDP-43, and Tbk1 amyotrophic lateral sclerosis mouse models.
(A, C, E, G) Representative images displaying intraparenchymal albumin staining (green) around the vessels (COL-IV; red) localized in the ventral horn of the lumbar spinal cord of (A) P20, P50, and P80 WT and SOD1G93A mice (B6SJL background); (C) P150, P360, and P510 WT and TDP-43G298S mice (B6SJLF1 background); (E) P150, P270, and P450 WT and FUSΔNLS/+mice (C57BI6 background); and (G) P270 and P450 WT and Tbk1+/− mice (B6.129P2 background). The first row shows vessels immunostained with COL-IV (red) alone. The second row shows the distribution of albumin (green) in the parenchyma in the ventral horn of the spinal cord. The third row represents images merged from the two previous images. (B, D, F, H) Quantification of the area covered by albumin in the ventral horn of the spinal cord from (B) WT and transgenic SOD1G93A mice (N = 4) at P20, P50, and P80; (D) WT and TDP-43G298S mice (N = 3) at P150, P360, and P510; (F) WT and FUSΔNLS/+ mice (N = 3) at P150, P270, and P450; and WT and Tbk1+/− mice (N = 3) at P270 and P450 (n = 6 sections per mouse). Scale bars: 20 μm. Data information: in (B, D, F, H), data are presented as means ± SD. **P < 0.001, ***P < 0.0001, ****P < 0.0001 (two-way ANOVA [genotype × time point] with Bonferroni correction for multiple comparisons).
Figure 6.
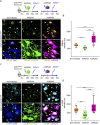
Figure 6.. PSAM/PSEM chemogenetics effectively modify MN activity.
(A, C) Schematic diagram representing the experimental design for control of MN excitation by inhPSAM/PSEM308 (green) and actPSAM/PSEM308 (magenta) on the assessment on (A) DREAM/KChIP3 (yellow) and (C) p-CREB expression in MNs (cyan blue). Dotted lines delimit the border of MNs, which are further detected by ChAT immunostaining (blue). (A, C) Cyan blue arrows indicate the absence or less (A) DREAM/KChIP3 and (C) p-CREB staining in noninfected MN nuclei and in inhPSAM/PSEM308-infected MN nuclei (green). (A, C) Yellow arrows point to increased levels of (A) DREAM/KChIP3 and (C) p-CREB staining in actPSAM/PSEM308-infected MN nuclei. (B, D) Quantification of (B) DREAM/KChIP3 and (D) p-CREB intensity, expressed in a.u. in nuclei of noninfected, inhPSAM/PSEM308 and actPSAM/PSEM308 MNs. The quantifications are represented by box-and-whisker plot; 10–90 percentile is considered. Scale bars: 20 μm. Data are from N = 5 mice per group. Data information: in (B, D), data are presented as means ± SD. **P < 0.001, ****P < 0.0001 (one-way ANOVA with Bonferroni correction for multiple comparisons).
Figure 7.
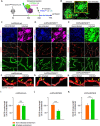
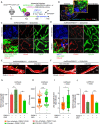
Figure 7.. Inhibition of MN firing increases claudin-5 breaks while MN firing enhancement restores blood–spinal cord barrier impairment.
(A) Experimental design for the chemogenetic control of MN excitation with inhPSAM/PSEM308 (green) or actPSAM/PSEM308 (magenta) in SOD1G93A/ChAT-cre mice injected at P20 and treated with the effector PSEM308 from P28 until P35. (B) Robust MN expression of the inhPSAM (green) upon intraspinal injection of AAV9 in contrast to no expression in the contralateral uninjected side. Dotted lines delineate the boundaries of gray and white matter in the ventral horns of the spinal cord. Scale bar: 50 μm. (C) Panel showing chemogenetic expression of actPSAM/veh (treated with vehicle instead of the effector PSEM308) in infected MNs (α-bungarotoxin in magenta) in contrast to uninfected MNs stained with VAChT. The panel shows no difference in cumulative breaks length (yellow lines) in CLN-5 ribbon (red) along microvessels (identified by COL-IV immunostaining in green) in the uninfected ventral horn, in comparison with the contralateral infected ventral horn (N = 4). (D) Panel showing chemogenetic expression of actPSAM/PSEM308 in infected MNs (α-BTX in magenta) in contrast to uninfected MNs stained with VAChT. Microvessels (green) in proximity of MN activated by actPSAM/PSEM308 (magenta) display a reduced cumulative breaks length (yellow) of CLN-5 ribbon (red) compared with contralateral uninfected MNs (N = 6). (E) Panel displaying chemogenetic expression of inhPSAM/PSEM308 in infected MNs (immunostained with GFP in green) in contrast to uninfected MNs stained with VAChT. Microvessels in proximity of MNs inactivated by inhPSAM/PSEM308 (green) display an increase in cumulative breaks length (yellow) of CLN-5 ribbon (red) compared with contralateral uninfected MNs (N = 6). (F, G, H) High-magnification view of CLN-5 distribution (white) in the single capillaries (red) of the noninfected and infected ventral horns in inhPSAM/veh, inhPSAM/PSEM308, or actPSAM/PSEM308. Yellow arrows indicate the breaks in the CLN-5 ribbon. Scale bar: 10 μm. (I, J, K) Quantification of blood–spinal cord barrier breaks in uninfected and infected ventral horn of the spinal cord of SOD1G93A/ChAT-cre mice subjected to chemogenetic control of activation/inhibition of MN firing. The values are expressed as % of the uninfected contralateral side. Scale bars: 20 μm. Data information: in (I, J, K), data are presented as means ± SD. ***P < 0.0001, ****P < 0.0001 (unpaired t test).
Figure 8.
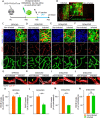
Figure 8.. Chemogenetic control of astrocytic Gi and Gq signaling restores blood–spinal cord barrier disruption.
(A) Experimental design for the injection of AAV8 encoding GFAP::DREADD-GFP, D(Gi), D(Gq), and D(Gs) in SOD1G93A/ChAT-cre mice, injected at P20 and treated with the agonist CNO from P28 until P35. (B) Pattern of expression of AAV8(GFAP::DREADD-GFP) injected in the ventral horn of the spinal cord and identified by GFP immunostaining (green). The dotted line depicts the boundary of gray and white matter. The insert shows a high magnification of infected astrocytes in the injected ventral horn in contrast to no GFP (astrocytes) staining in the contralateral uninjected ventral horn. Scale bar: 50 μm. (C) Panel showing the chemogenetic expression of AAV8(GFAP::GFP) (infected astrocytes in green), followed by CNO administration. The activation does not affect the cumulative breaks length (yellow lines) in CLN-5 ribbon (red) along the COL-IV+ vessels (green) in the infected ventral horn of the spinal cord compared with the contralateral uninfected ventral horn. (D) Panel displaying the activation of D(Gi)/CNO in astrocytes. The activation of astrocytic Gi signaling causes the reduction of CLN-5 break (yellow lines) burden in the infected horn compared with the contralateral uninfected horn. (E) Panel displaying representative pictures of D(Gq)/CNO activation in astrocytes, resulting in decreased CLN-5 break (yellow lines) burden in the infected ventral horn. (F) Representative pictures showing activation of D(Gs)/CNO in infected astrocytes. D(Gs) activation does not modify CLN-5 break (yellow lines) burden when compared with the contralateral uninfected ventral horn. (C, D, E, F) MNs in the uninjected ventral horn are detected by VAChT immunostaining (blue). Infected astrocytes, identified by GFP (green), are co-stained with COL-IV (red) to visualize the vasculature surrounding the astrocytes in the injected ventral horn. (G, H, I, J) High-magnification view of CLN-5 distribution (white) in the single microvessels (red), displaying the effect of control GFP/CNO, D(Gi)/CNO, D(Gq)/CNO, and D(Gs)/CNO activation in infected and noninfected ventral horns. Yellow arrows indicate the breaks in the CLN-5 ribbon. Scale bar: 10 μm. (K, L, M, N) Quantification of blood–spinal cord barrier breaks in uninfected and infected ventral horns of the spinal cord of SOD1G93A/ChAT-cre mice. Data are from N = 8 mice per group of experiments subjected to injection of AAV8(GFAP::GFP)/CNO, D(Gi)/CNO, D(Gq)/CNO, and D(Gs)/CNO. The values are expressed as % of the uninfected contralateral side. Scale bars: 20 μm. Data information: in (K, L, M, N), data are presented as means ± SD. ***P < 0.0001, ****P < 0.0001 (unpaired t test).
Figure 9.
Figure 9.. Astrocytic end-feet coverage of microvessels is enhanced by D(Gi) and D(Gq) activation, while diminished after MN firing inhibition.
(A) Experimental design for the injection of AAV8 encoding GFAP::DREADD-GFP, D(Gi), D(Gq), and D(Gs) in SOD1G93A/ChAT-cre mice, injected at P20 and treated with the agonist CNO from P28 until P35. (B) High magnification of single microvessels (red) showing astrocytic end-feet coverage (green) after GFP, D(Gi), D(Gq), and D(Gs) activation. The pattern of infected astrocytes (identified by GFP immunostaining in green) on the vessels significantly increases in D(Gi)/CNO, D(Gq)/CNO, and (DGs)/CNO compared with GFP/CNO alone. Scale bar: 7 μm. (C) Quantification of end-feet coverage of vessels after DREADD treatments, expressed as % of the GFP+ area on the total vessel area. (D). Representative pictures of aquaporin-4 (green) expression localized in the astrocytic end-feet enveloping microvessels (red) in the ventral horn of the spinal cord of SOD1G93A/ChAT-cre. Nuclei are immunostained with DAPI (blue). Inserts show high magnification of AQP4 (green) labeling, colocalized with a single microvessel identified by COL-IV (red) staining. Scale bars: 7 μm. (E) Quantification of the AQP4+ area surrounding the vessels in the SOD1G93A/ChAT-cre mice injected with D(Gi)/CNO (N = 3). Values are expressed as % of the total vessel area. (F) Experimental design displaying MN firing inactivation via inhPSAM/PSEM308 in SOD1G93A/ChAT-cre mice. The inhibition of MN firing reduces AQP4 expression at the level of astrocytic end-feet coverage surrounding the vessels, localized in the infected ventral horn compared with the uninfected contralateral horn. Inserts show high magnification of AQP4 immunostaining (green) colocalized with single microvessels (red). White arrows indicate the distribution of AQP4. Scale bar: 7 μm. (G) Quantification of the AQP4+ area surrounding the vessels in the SOD1G93A/ChAT-cre mice injected with inhPSAM/PSEM308. Data are from N = 3 mice per group of experiments. Values are expressed as % of the total vessel area. Scale bars: 20 μm. Data information: in (C, E, G), data are presented as means ± SD. (C, E, G) ****P < 0.0001 (one-way ANOVA with Bonferroni correction for multiple comparisons [C] and unpaired t test [E, G]).
Figure 10.
Figure 10.. Chemogenetic activation of astrocytic Gq, but not Gi, signaling decreases the burden of disease markers in MN.
(A) Experimental design for the injection of AAV8 encoding D(Gq) and D(Gi) in SOD1G93A/ChAT-cre mice, at P20 and treated with the agonist CNO from P28 until P35. (B, D, F) Representative pictures of (B) misfolded SOD1 (white), (D) p62 (white), and (F) KDEL (white) immunostaining in MN located close to the activated astrocytes (green) in the infected ventral horn and in MN in the contralateral uninfected ventral horn of SOD1G93A/ChAT-cre spinal cords subjected to AAV8 D(Gq)/CNO injection. MNs are identified by VAChT immunostaining (magenta), and infected astrocytes are detected by GFP (green). (B, D, F) Orange arrows indicate the overload of (B) misfolded SOD1 (white), (D) p62 (white), and (F) KDEL (white) burden in the MNs located in the noninfected ventral horn, and magenta arrows point to less accumulation of (B) misfolded SOD1 (white), (D) p62 (white), and (F) KDEL (white) burden in MN close to Gq activated astrocytes (green). (C, E, G) Quantification of (C) the intensity of misfolded SOD1, (E) p62 aggregates per total cell body, and (G) KDEL intensity in MNs located in the infected and uninfected contralateral ventral horns of mice subjected to chemogenetic activation of astrocytes via D(Gq)/CNO. (H, J, L, N) Representative pictures of (H) misfolded SOD1 (white), (J) p62 (white), (L) KDEL (white), and (N) LC3A (white) immunostaining in MN located close to infected astrocytes (green) in the infected ventral horn and in MNs in the contralateral uninfected ventral horn of SOD1G93A/ChAT-cre spinal cords subjected to AAV8 D(Gi)/CNO injection. (H, J, L, N) Orange arrows indicate the overload of (H) misfolded SOD1 (white), (J) p62 (white), (L) KDEL (white), and (N) LC3A (white) burden in the MNs located in the noninfected ventral horn, while magenta arrows point to decreased levels of (H) misfolded SOD1 (white), (J) p62 (white), (L) KDEL (white), and (N) LC3A (white) burden in MN close to Gi-activated astrocytes (green). The first column of each experiment shows MN markers alone, and the second column displays the co-immunostaining with VAChT or the co-immunostaining with VAChT and GFP (for infected astrocytes). (I, K, M, O) Quantification of (I) the intensity of misfolded SOD1, (K) p62 aggregates per total cell body, (M) KDEL, and (O) LC3A intensity in MNs located in the infected and uninfected contralateral ventral horns of mice subjected to chemogenetic activation of astrocytes via D(Gi)/CNO. The quantifications are represented by a box-and-whisker plot; 10–90 percentile is considered. Data are from N = 6 mice per group of experiments. Scale bars: 20 μm. Data information: in (C, E, G, I, K, M, O), data are presented as means ± SD. *P < 0.1, ****P < 0.0001 (unpaired t test).
Figure 11.
Figure 11.. Blood–spinal cord barrier (BSCB) restoration by astrocytic D(Gi) signaling is independent of MN excitation.
(A) Experimental design for the intraspinal injection of AAV9(hSyn::DIO-inhPSAM or -actPSAM) in combination with AAV8(GFAP::D(Gi)-Citrine) for the multiplexed chemogenetic experiments in the SOD1G93A/ChAT-cre mice at P20 and treated with the effector PSEM308 and the agonist CNO or vehicle from P28 until P35. (B) Representative picture of intraspinal injection of AAV9 encoding actPSAM, highly expressed in MNs (blue), in combination with injection of AAV8 D(Gi), highly specific for astrocytes (green) in the infected ventral horn in contrast to no expression pattern in the uninjected ventral horn. The dotted line depicts the boundary of gray and white matter. The insert shows a high magnification of infected MNs and astrocytes in the injected ventral horn. Scale bar: 50 μm. (C) Representative panel displaying immunostaining for the multiplexed chemogenetic experiments in which MN firing inhibition via inhPSAM/PSEM308 (infected MNs in green) combined with astrocytic Gi activation diminished the breaks (yellow lines) in CLN-5 ribbon (red) in the infected ventral horn compared with the uninfected contralateral ventral horn. (D) Panel showing immunostaining for the multiplexed chemogenetic experiment in which MN firing enhancement via actPSAM/PSEM308 (infected MNs detected by α-BXT in blue) combined with astrocytic Gi activation (astrocytes identified by GFP in green) further decreases breaks (yellow lines) along CLN-5 ribbon (red). MNs in the noninfected ventral horn are identified by VAChT immunostaining, whereas vessels are labeled with COL-IV (red in the combined picture and green in the single picture). (D, E, F) High-magnification view of CLN-5 distribution (white) along the single capillaries (red) in the multiplexed chemogenetics (E) inhPSAM/PSEM308 + D(Gi)/CNO and in (D) actPSAM/PSEM308 + D(Gi)/CNO. (D, E) Yellow arrows indicate the discontinuity of CLN-5 ribbon (white) in the noninfected ventral horn in contrast to a more homogeneous distribution in the infected ventral horn of (E, D) both experiments. Scale bar: 10 μm. (G) Quantification of BSCB disruption expressed as % of breaks of the contralateral uninfected ventral horn after multiplexed chemogenetic experiments with inhPSAM/PSEM308 + D(Gi)/CNO (CNO +) or with inhPSAM/PSEM308 + D(Gi)/veh (CNO − [column with milled pattern]). (H, I) Quantification of MN (H) LC3A intensity and (I) p62 aggregates per cell body in the double-infected (inhPSAM/PSEM308 + D(Gi)/CNO) ventral horn compared with the uninfected ventral horn. (J) Quantification of BSCB disruption expressed as % of breaks of the contralateral uninfected ventral horn after multiplexed chemogenetic experiments with actPSAM/PSEM308 + D(Gi)/CNO (CNO +) or with actPSAM/PSEM308 + D(Gi)/veh (CNO − [column with milled pattern]). (H, I) The quantifications of MN markers in (H, I) are represented by the box-and-whisker plot; 10–90 percentile is considered; N = 4–6 mice per group of experiments. Scale bars: 20 μm. Data information: in (G, H, I, J), data are presented as means ± SD. *P < 0.1, **P < 0.01, ***P < 0.001, ****P < 0.0001 (unpaired t test).
Figure 12.
Figure 12.. Astrocytic Wnt5a and Wnt7a mRNA up-regulation correlates with blood–spinal cord barrier restoration in amyotrophic lateral sclerosis under chemogenetic activation of astrocytic Gi signaling.
(A) Representative panel showing immunostaining for CLN-5 (red) and COL-IV (green) in WT and SOD1G93A mice at P38 treated with vehicle or porcupine (PORCN) inhibitor C-59. Breaks of CLN-5 ribbon (red) along the vessels (green) are marked with yellow lines. Scale bars: 20 μm. (B) Quantification of CLN-5 breaks length (expressed as % of WT [treated with vehicle] breaks) in WT and SOD1G93A mice treated with vehicle or C-59 (column with milled pattern). Data are from N = 3. (C, E) Representative picture of detection by in situ hybridization of (C) Wnt5a and (E) Wnt7a mRNA (green dots) in astrocytes, identified by glial fibrillary acidic protein immunofluorescence staining (red) in WT and SOD1G93A mice. Nuclei are depicted with DAPI (blue). (D, F) Quantification of mRNA levels of (D) Wnt5a and (F) Wnt7a in WT and SOD1G93A mice, expressed as the amount of dots. (G, I) Representative panel showing detection by in situ hybridization of (G) Wnt5a and (I) Wnt7a mRNA (green dots) in astrocytes in the inhPSAM/PSEM308 chemogenetic experiment. Astrocytes are identified by glial fibrillary acidic protein immunofluorescence staining (red). Nuclei are depicted with DAPI (blue). (H, J) Quantification of (H) Wnt5a and (J) Wnt7a mRNA amount in infected and uninfected contralateral ventral horns of the spinal cord of SOD1G93A/ChAT-cre mice injected with AAV9 inhPSAM/PSEM308. Data are from N = 4. (K, M) Representative panel showing detection by in situ hybridization of (K) Wnt5a and (M) Wnt7a mRNA (green dots) in astrocytes in the D(Gi)/CNO chemogenetic experiment. Nuclei are depicted with DAPI (blue). (L, N) Quantification of (L) Wnt5a and (N) Wnt7a mRNA amount in infected and uninfected contralateral ventral horns of the spinal cord of SOD1G93A/ChAT-cre mice subjected to D(Gi)/CNO chemogenetic treatment. Data are from N = 4. Scale bars: 5 μm. Data information: in (B, D, F, H, J, L, N), data are presented as means ± SD. (B, D, F, H, J, L, N) *P < 0.1, **P < 0.01, ***P < 0.001, ****P < 0.0001 (one-way ANOVA with Bonferroni correction for multiple comparisons [B] and unpaired t test [D, F, H, J, L, N]).
Figure 13.
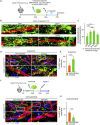
Figure 13.. Chemogenetic activation of astrocytic D(Gi) at later amyotrophic lateral sclerosis stage ameliorates microvessel integrity and MN disease markers.
(A) Experimental design for the injection of AAV8 encoding D(Gi) in SOD1G93A/ChAT-cre mice, at P20 and treated with the agonist CNO from P30 until P50. (B) Representative panel displaying the effect of the prolonged and late activation of astrocytic (DGi) on CLN-5 distribution (red) along the vessels (green). MNs are identified by VAChT immunostaining (blue), and infected astrocytes are stained with GFP (green). CLN-5 breaks are depicted in yellow lines. (C) High magnification of CLN-5 organization (white) along COL-IV+ vessels (red). Yellow arrows indicate CLN-5 interruptions along the ribbon in the noninfected ventral horn of SOD1G93A/ChAT-cre mice subjected to D(Gi) late and prolonged activation. Scale bars: 10 μm. (D) Quantification of blood–spinal cord barrier (BSCB) disruption, expressed as % of contralateral breaks length. (E) Representative pictures showing MN markers p62 and LC3A immunofluorescence staining (gray) in infected and uninfected contralateral ventral horn of SOD1G93A/ChAT-cre spinal cord sections. MNs are detected by VAChT immunostaining (red) and infected astrocytes by GFP (green). (F, G) Quantification of (F) p62 aggregates per cell body and (G) LC3A intensity in MN surrounding infected astrocytes and in MN located in the uninfected contralateral ventral horn. The quantifications are represented by the box-and-whisker plot; 10–90 percentile is considered. Data are from N = 3 mice. (I) Experimental design for multiplexed chemogenetic injection of AAV9 encoding inhPSAM + D(Gi) in SOD1G93A/ChAT-cre mice, at P20 and treated with respective ligands PSEM308 and CNO from P30 until P50. (H) Expression pattern of MNs activated by inhPSAM (green) and astrocytes activated by D(Gi). Dotted lines delineate the contour of the gray and white matter in the ventral horns of the spinal cord. The insert highlights infected MNs (green) surrounded by infected astrocytes (green). Scale bar: 50 μm. (J) Representative panel displaying the effect of the prolonged and late activation of multiplexed chemogenetic inhPSAM/PSEM308 + D(Gi)/CNO experiments on the BSCB grade of disruption in SOD1G93A/ChAT-cre mice. MNs in the noninfected horn are identified by VAChT immunostaining (blue), whereas infected MNs and astrocytes are stained with GFP (green). CLN-5 breaks are depicted in yellow lines along the ribbon (red). (K) High magnification of CLN-5 organization (white) along COL-IV+ vessels (red). Yellow arrows indicate CLN-5 interruptions along the ribbon in the noninfected ventral horn of SOD1G93A/ChAT-cre mice subjected to the late and prolonged multiplexed chemogenetic experiments. Scale bars: 10 μm. (L) Quantification of breaks length in the BSCB of SOD1G93A/ChAT-cre mice subjected to the late and prolonged multiplexed chemogenetic experiments, expressed as % of contralateral. Data are from N = 3 mice. Scale bars: 20 μm. Data information: in (D, F, G, L), data are presented as means ± SD. **P < 0.01, ***P < 0.001, ****P < 0.0001 (unpaired t test).
Figure S5.
Figure S5.. Interpretative model of the chemogenetic dissection of neuro–glio–vascular interactions in amyotrophic lateral sclerosis.
In amyotrophic lateral sclerosis mice, enhancement or depression of MN excitability using actPSAM (red) or inhPSAM (blue) (1) is sufficient to reduce or increase, respectively, the disruption of the blood–spinal cord barrier (BSCB). The interaction between MN firing (1) and BSCB integrity (5) is hypothesized to be mediated by astrocytes (2) possibly through G protein–coupled receptor. Nevertheless, activation of G protein–coupled receptor signaling in astrocytes is sufficient to restore BSCB integrity: Whereas astrocytic Ca2+-PKC-coupled DREADD(Gq) (orange) restores BSCB together with MN disease burden (2), the DREADD(Gi) (green) restores BSCB independently of MN firing (3) by up-regulating the expression of Wnt7a and Wnt5a (4). Whereas, at the very early stages of the pathogenic cascade, the restoration of the BSCB (5) does not affect disease manifestation, the opposite is true at later stages of disease progression, when restoration of the BSCB helps to reduce the disease burden in MNs (6).

References

    1. Abbott NJ, Rönnbäck L, Hansson E (2006) Astrocyte–endothelial interactions at the blood–brain barrier. Nat Rev Neurosci 7: 41 10.1038/nrn1824 - DOI - PubMed
    1. Adamsky A, Kol A, Kreisel T, Doron A, Ozeri-Engelhard N, Melcer T, Refaeli R, Horn H, Regev L, Groysman M (2018) Astrocytic activation generates de novo neuronal potentiation and memory enhancement. Cell 174: 59–71.e14. 10.1016/j.cell.2018.05.002 - DOI - PubMed
    1. Artus C, Glacial F, Ganeshamoorthy K, Ziegler N, Godet M, Guilbert T, Liebner S, Couraud P-O (2014) The Wnt/planar cell polarity signaling pathway contributes to the integrity of tight junctions in brain endothelial cells. J Cereb Blood Flow Metab 34: 433–440. 10.1038/jcbfm.2013.213 - DOI - PMC - PubMed
    1. Aurnhammer C, Haase M, Muether N, Hausl M, Rauschhuber C, Huber I, Nitschko H, Busch U, Sing A, Ehrhardt A (2011) Universal real-time PCR for the detection and quantification of adeno-associated virus serotype 2-derived inverted terminal repeat sequences. Hum Gene Ther B Methods 23: 18–28. 10.1089/hgtb.2011.034 - DOI - PubMed
    1. Bączyk M, Alami NO, Delestrée N, Martinot C, Tang L, Commisso B, Bayer D, Doisne N, Frankel W, Manuel M, et al. (2020) Synaptic restoration by cAMP/PKA drives activity-dependent neuroprotection to motoneurons in ALS. J Exp Med 217: e20191734 10.1084/jem.20191734 - DOI - PMC - PubMed

Publication types

MeSH terms