. 2020 Sep 22;117(38):23606-23616.
doi: 10.1073/pnas.1921473117. Epub 2020 Sep 8.

Hidden dynamic signatures drive substrate selectivity in the disordered phosphoproteome

Affiliations

Hidden dynamic signatures drive substrate selectivity in the disordered phosphoproteome

Min-Hyung Cho et al. Proc Natl Acad Sci U S A. .

Abstract

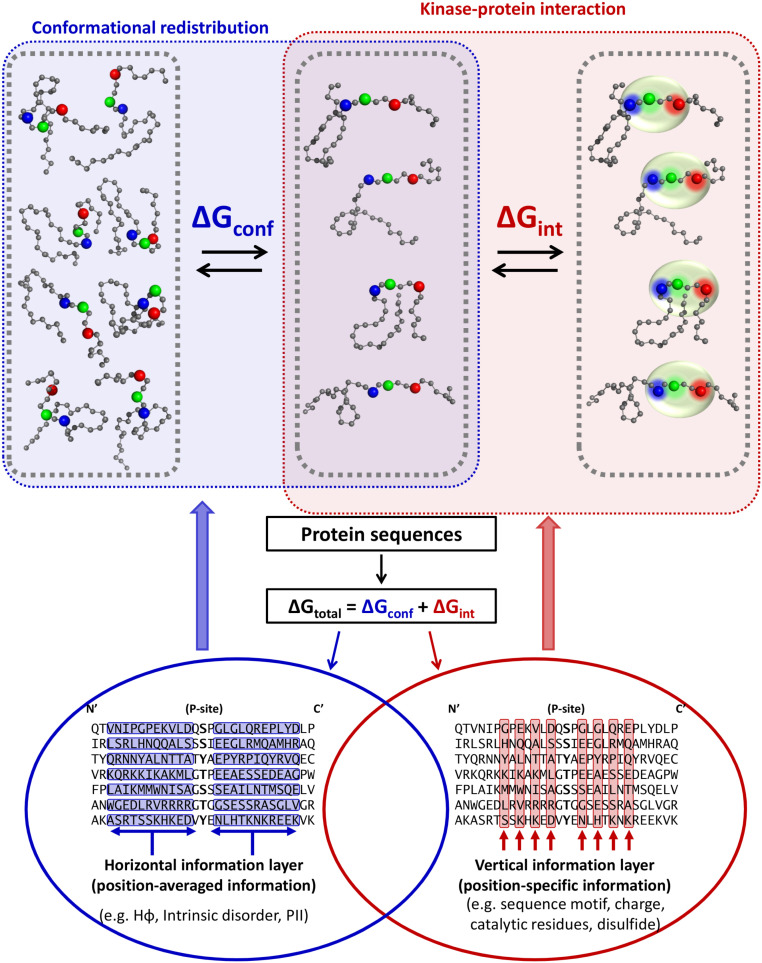
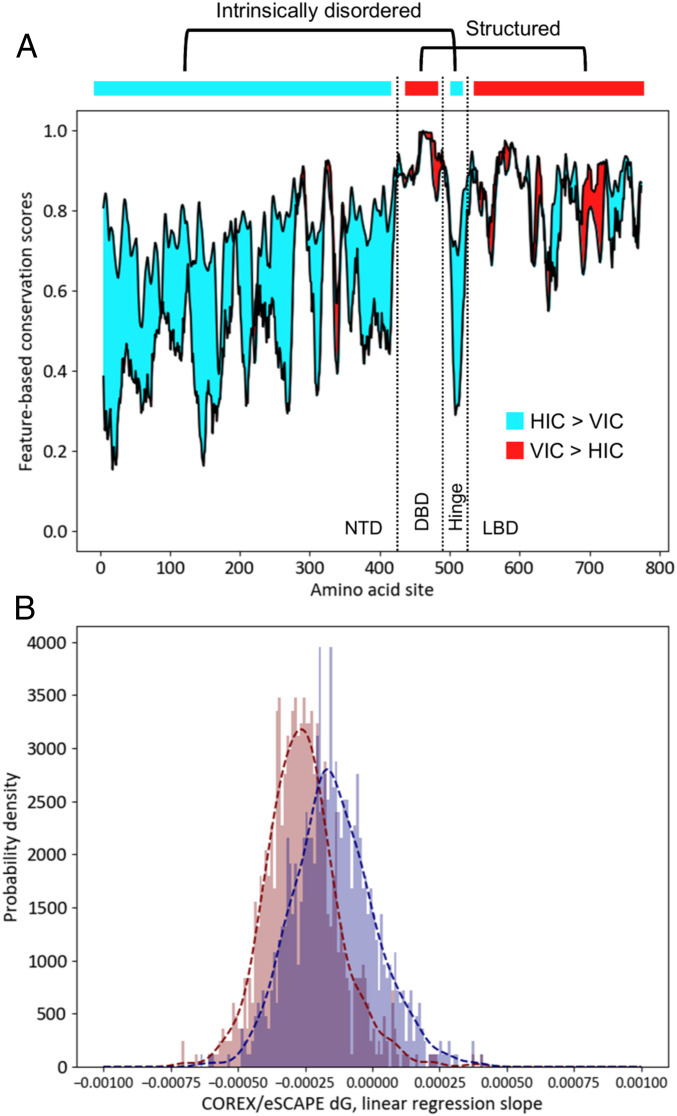
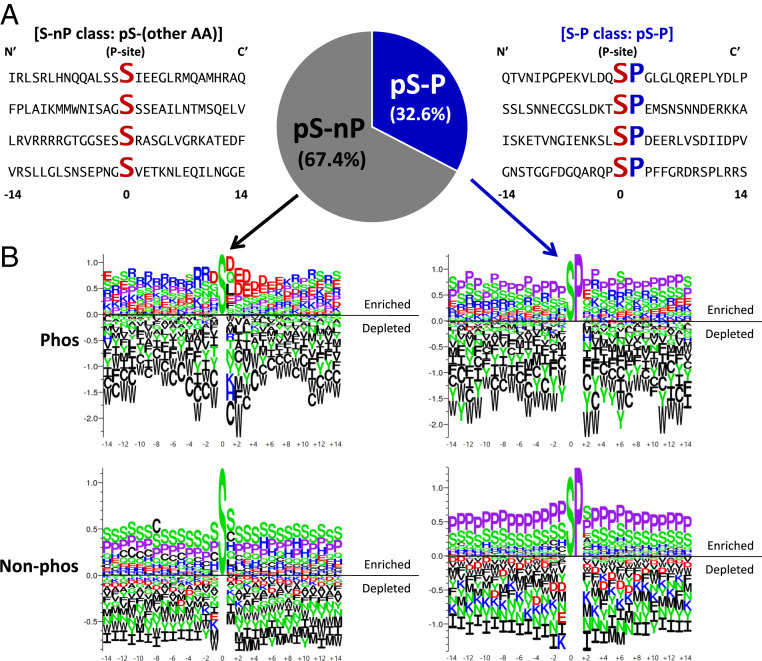
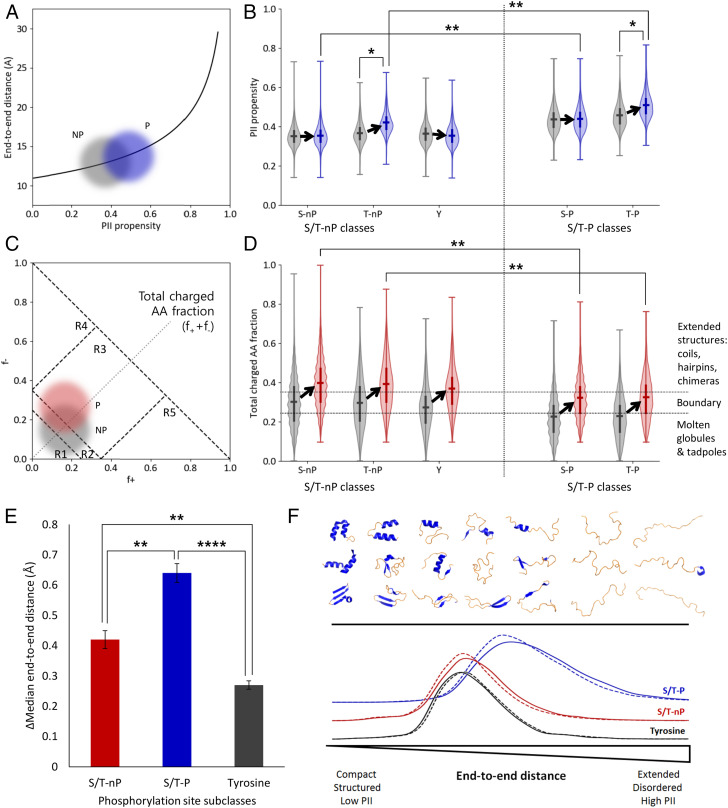
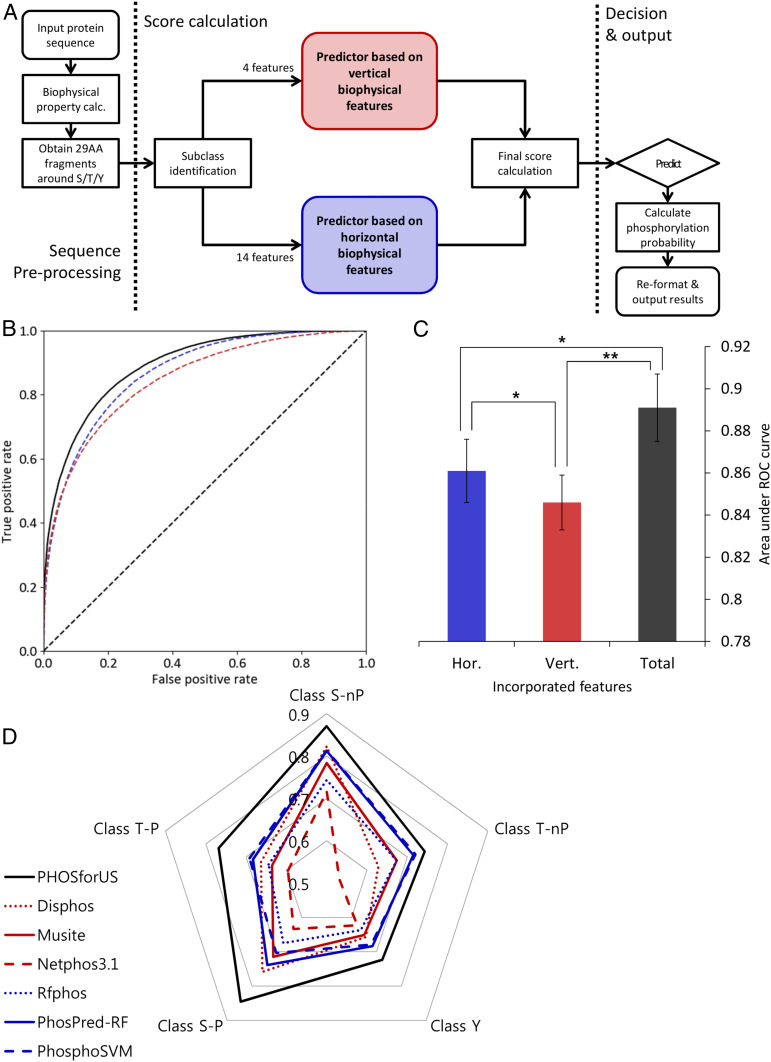
Phosphorylation sites are hyperabundant in the eukaryotic disordered proteome, suggesting that conformational fluctuations play a major role in determining to what extent a kinase interacts with a particular substrate. In biophysical terms, substrate selectivity may be determined not just by the structural-chemical complementarity between the kinase and its protein substrates but also by the free energy difference between the conformational ensembles that are, or are not, recognized by the kinase. To test this hypothesis, we developed a statistical-thermodynamics-based informatics framework, which allows us to probe for the contribution of equilibrium fluctuations to phosphorylation, as evaluated by the ability to predict Ser/Thr/Tyr phosphorylation sites in the disordered proteome. Essential to this framework is a decomposition of substrate sequence information into two types: vertical information encoding conserved kinase specificity motifs and horizontal information encoding substrate conformational equilibrium that is embedded, but often not apparent, within position-specific conservation patterns. We find not only that conformational fluctuations play a major role but also that they are the dominant contribution to substrate selectivity. In fact, the main substrate classifier distinguishing selectivity is the magnitude of change in local compaction of the disordered chain upon phosphorylation of these mostly singly phosphorylated sites. In addition to providing fundamental insights into the consequences of phosphorylation across the proteome, our approach provides a statistical-thermodynamic strategy for partitioning any sequence-based search into contributions from structural-chemical complementarity and those from changes in conformational equilibrium.

Keywords: cellular signaling; conformational equilibrium; intrinsic disorder; local unfolding; protein ensemble.


Conflict of interest statement

The authors declare no competing interest.

Figures

Fig. 1.
Fig. 1.
Horizontal and vertical protein sequence information reflected in the conformational and binding equilibria of kinase–substrate interaction. Cartoon of coupled equilibria (upper half) demonstrates a decrease of diversity in the substrate’s conformational ensemble mediated by horizontal information (blue box) necessary to position functional residues, mediated by vertical information (red box). Horizontal and vertical information are simultaneously encoded (lower half) in an amino acid sequence alignment. Black letters represent aligned sequences, with blue rows representing neighboring groups of amino acids exhibiting emergent biophysical properties and red columns representing conserved amino acids typically used for alignment and binding site identification. The central hypothesis of this work is that biological phosphorylation, and effective phosphorylation site prediction, critically depends on both types of information.
Fig. 2.
Fig. 2.
Horizontal information is more strongly conserved than vertical information in IDRs of protein families. (A) Difference between degrees of conservation of sequence and native-state free energy (ΔG, ref. 29) calculated for human glucocorticoid receptor (GR) and its orthologs (30). Cyan denotes regions where free energy conservation (HIC, horizontal information conservation) is stronger than sequence conservation (VIC, vertical information conservation), and red denotes the opposite. In human GR, the DNA binding domain (DBD) and the ligand binding domain (LBD) are structured, while the N-terminal domain (NTD) and hinge region are intrinsically disordered. Preponderance of cyan area demonstrates that horizontal information can be conserved when vertical information is not. (B) Coefficient of correlations between free energy and conservation score is calculated for ortholog alignments of 835 different transcription factors (30). Distribution of slope coefficients over many families show that sequence conservation (red) is more strongly correlated with calculated free energy, a property seen in A for a single family.
Fig. 3.
Fig. 3.
Proline residue at the +1 site (+1 Pro) of Ser phosphorylation sites defines a subclass of site (S-P) dependent on horizontal information. (A) Example 29-mer sequence neighborhoods centered on the phosphorylated Ser residue. Conserved Ser (S) and +1 Pro residues (P) are enlarged and bold. Frequencies of +1 Pro phosphorylation sites (S/T-P) make up one-third of all known human phosphorylated Ser. (B) Amino acid frequencies around S-P and S-nP demonstrate that S-P sites have little distinguishing sequence features as compared to nonphosphorylated sites with S-P dipeptide. (Top) Logos show enrichment/depletion patterns of amino acids around phosphorylated Ser sites. (Bottom) Logos show patterns around nonphosphorylated Ser sites. (Left) Logos show patterns where the Ser is immediately followed by amino acids other than Pro. (Right) Logos show patterns where the Ser is immediately followed by Pro (i.e., +1 Pro). Vertical scale indicates information content in bits. In all panels, aliphatic/nonpolar residues are colored black, prolines are lavender, polar residues are green, negatively charged side chains are red, and positively charged side chains are blue.
Fig. 4.
Fig. 4.
Phosphorylation sites containing +1 Pro (S/T-P) are energetically poised to respond to phosphorylation by local extension, mediated by charge and PII propensity. (A) Conceptual plot illustrating expected local end-to-end distance increase (32) due to phosphorylation of an ensemble distribution of 29-mer sequence fragments. Gray cloud represents nonphosphorylated sequences (NP) and blue cloud represents singly phosphorylated sequences (P). (B) Violin plots of ensemble distributions of sequence PII propensities (20) before (gray) and after (blue) phosphorylation. S/T-P classes in particular (the two rightmost pairs of distributions) exist in an extension range nearest the exponential increase in A. Significance bars demonstrate that the postphosphorylation ensembles of S/T-P occupy a very different conformational manifold than do the postphosphorylation ensembles of S/T-nP. (C) Conceptual plot illustrating expected charge change due to single phosphorylation (P) of a distribution of 29-mers. The numbered regions R1 through R5 represent conformational regimes as described in Das and Pappu (37). Note that the dashed diagonal line corresponds to the y axis in D. (D) Violin plots of ensemble distributions of sequence charge properties before (gray) and after (red) phosphorylation. Dotted horizontal lines represent conformational regimes as described in Das and Pappu (37). S/T-P sites (the two rightmost pairs of distributions) specifically exhibit a less unstructured conformational manifold prior to a phosphorylation event, and thus the Pro effectively buffers a conformational transition with an increased PII propensity. Significance bars demonstrate that the postphosphorylation ensembles of S/T-P occupy a very different conformational manifold than do the postphosphorylation ensembles of S/T-nP. Notably, the S/T-nP ensembles cross the boundary region, while the S/T-P ensembles do not. (E) S/T-P sites undergo the largest expected extension upon phosphorylation due to contributions from both extension (PII structure) and charge repulsion (see SI Appendix, Figs. S3–S6, in particular SI Appendix, Fig. S4). (F) Schematic summarizing local changes in the conformational ensemble upon phosphorylation. The top half represents an idealized conformational spectrum ranging from mostly folded (left side) with lower end-to-end distance to mostly disordered (right side) with higher end-to-end distance. Conformational change after the phosphorylation event is measured by end-to-end distance (bottom), mediated by PII propensity and charge interactions. Along this spectrum, tyrosine phosphorylation (black curve) exhibits the smallest population end-to-end distances, S/T-nP phosphorylation (red curve) exhibits intermediate distances, and S/T-P site phosphorylation exhibits the largest distances (blue curve). Dashed line: distribution before phosphorylation. Solid line: distribution after phosphorylation.*P < 0.05, **P < 0.01, ****P < 0.0001.
Fig. 5.
Fig. 5.
Architecture, training performance, and comparative effectiveness of the PHOSforUS predictor. (A) Simplified workflow of the PHOSforUS predictor algorithm. Biophysical properties of an arbitrary protein sequence are split into 29-mer fragments centered on Ser/Thr/Tyr residues. Five (or three) subclass-specific predictors are invoked, independently based on vertical (red) or horizontal (blue) information. Intermediate output is combined with gradient boost, and combination scores over a preset threshold are predicted as phosphorylated. (B) ROC of PHOSforUS constituent predictors. AUROC is indicated as a separate bar graph. (C) Performance of all subclasses of phosphorylation site are combined into a single curve. The combined predictor (Total, black) outperforms separate predictors based on vertical (Vert., red) or horizontal (Hor., blue) information. Notably, horizontal information significantly outperforms vertical information (C), demonstrating the importance of horizontal information. *P < 0.05, **P < 0.1. (D) Comparative effectiveness of protein phosphorylation site prediction by PHOSforUS. For five subclasses of phosphorylation site, PHOSforUS AUROC values meet or exceed those obtained on the identical data with six existing prediction tools.

Similar articles

Cited by

References

    1. Miller C. J., Turk B. E., Homing in: Mechanisms of substrate targeting by protein kinases. Trends Biochem. Sci. 43, 380–394 (2018). - PMC - PubMed
    1. Collins M. O., Yu L., Choudhary J. S., Analysis of protein phosphorylation on a proteome-scale. Proteomics 7, 2751–2768 (2007). - PubMed
    1. Deribe Y. L., Pawson T., Dikic I., Post-translational modifications in signal integration. Nat. Struct. Mol. Biol. 17, 666–672 (2010). - PubMed
    1. Humphrey S. J., James D. E., Mann M., Protein phosphorylation: A major switch mechanism for metabolic regulation. Trends Endocrinol. Metab. 26, 676–687 (2015). - PubMed
    1. Bah A., Forman-Kay J. D., Modulation of intrinsically disordered protein function by post-translational modifications. J. Biol. Chem. 291, 6696–6705 (2016). - PMC - PubMed

Publication types

MeSH terms

LinkOut - more resources