Dual-Localized WHIRLY1 Affects Salicylic Acid Biosynthesis via Coordination of ISOCHORISMATE SYNTHASE1, PHENYLALANINE AMMONIA LYASE1, and S-ADENOSYL-L-METHIONINE-DEPENDENT METHYLTRANSFERASE1
- PMID: 32900979
- PMCID: PMC7723104
- DOI: 10.1104/pp.20.00964
Dual-Localized WHIRLY1 Affects Salicylic Acid Biosynthesis via Coordination of ISOCHORISMATE SYNTHASE1, PHENYLALANINE AMMONIA LYASE1, and S-ADENOSYL-L-METHIONINE-DEPENDENT METHYLTRANSFERASE1
Abstract
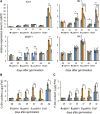
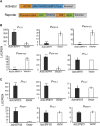
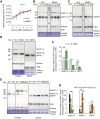
Salicylic acid (SA) influences developmental senescence and is spatiotemporally controlled by various mechanisms, including biosynthesis, transport, and conjugate formation. Altered localization of Arabidopsis WHIRLY1 (WHY1), a repressor of leaf natural senescence, in the nucleus or chloroplast causes a perturbation in SA homeostasis, resulting in adverse plant senescence phenotypes. WHY1 loss-of-function mutation resulted in SA peaking 5 d earlier compared to wild-type plants, which accumulated SA at 42 d after germination. SA accumulation coincided with an early leaf-senescence phenotype, which could be prevented by ectopic expression of the nuclear WHY1 isoform (nWHY1). However, expressing the plastid WHY1 isoform (pWHY1) greatly enhanced cellular SA levels. Transcriptome analysis in the WHY1 loss-of-function mutant background following expression of either pWHY1 or nWHY1 indicated that hormone metabolism-related genes were most significantly altered. The pWHY1 isoform predominantly affected stress-related gene expression, whereas nWHY1 primarily controlled developmental gene expression. Chromatin immunoprecipitation-quantitative PCR assays indicated that nWHY1 directly binds to the promoter region of isochorismate synthase1 (ICS1), thus activating its expression at later developmental stages, but that it indirectly activates S-adenosyl- l -Met-dependent methyltransferase1 (BSMT1) expression via ethylene response factor 109 (ERF109). Moreover, nWHY1 repressed expression of Phe ammonia lyase-encoding gene (PAL1) via R2R3-MYB member 15 (MYB15) during the early stages of development. Interestingly, rising SA levels exerted a feedback effect by inducing nWHY1 modification and pWHY1 accumulation. Thus, the alteration of WHY1 organelle isoforms and the feedback of SA are involved in a circularly integrated regulatory network during developmental or stress-induced senescence in Arabidopsis.
© 2020 American Society of Plant Biologists. All Rights Reserved.
Figures


Comment in
-
Here, There, and Everywhere: Plastid- and Nuclear-Localized WHIRLY1 Regulates Salicylic Acid Homeostasis during Developmental Senescence.Plant Physiol. 2020 Dec;184(4):1620-1621. doi: 10.1104/pp.20.01475. Plant Physiol. 2020. PMID: 33277328 Free PMC article. No abstract available.
Similar articles
-
H2O2 as a Feedback Signal on Dual-Located WHIRLY1 Associates with Leaf Senescence in Arabidopsis.Cells. 2019 Dec 6;8(12):1585. doi: 10.3390/cells8121585. Cells. 2019. PMID: 31817716 Free PMC article.
-
Biosynthesis of salicylic acid in plants.Plant Signal Behav. 2009 Jun;4(6):493-6. doi: 10.4161/psb.4.6.8392. Epub 2009 Jun 12. Plant Signal Behav. 2009. PMID: 19816125 Free PMC article. Review.
-
In-depth analysis of isochorismate synthase-derived metabolism in plant immunity: Identification of meta-substituted benzoates and salicyloyl-malate.J Biol Chem. 2024 Sep;300(9):107667. doi: 10.1016/j.jbc.2024.107667. Epub 2024 Aug 12. J Biol Chem. 2024. PMID: 39128721 Free PMC article.
-
Cooperative functioning between phenylalanine ammonia lyase and isochorismate synthase activities contributes to salicylic acid biosynthesis in soybean.New Phytol. 2016 Nov;212(3):627-636. doi: 10.1111/nph.14078. Epub 2016 Jul 13. New Phytol. 2016. PMID: 27411159
-
Salicylic acid: an old hormone up to new tricks.Mol Plant Pathol. 2013 Aug;14(6):623-34. doi: 10.1111/mpp.12035. Epub 2013 Apr 28. Mol Plant Pathol. 2013. PMID: 23621321 Free PMC article. Review.
Cited by
-
UPL5 modulates WHY2 protein distribution in a Kub-site dependent ubiquitination in response to [Ca2+]cyt-induced leaf senescence.iScience. 2023 Mar 6;26(3):106216. doi: 10.1016/j.isci.2023.106216. eCollection 2023 Mar 17. iScience. 2023. Retraction in: iScience. 2023 Jun 01;26(6):106974. doi: 10.1016/j.isci.2023.106974. PMID: 36994183 Free PMC article. Retracted.
-
WHIRLY proteins maintain seed longevity by effects on seed oxygen signalling during imbibition.Biochem J. 2023 Jul 12;480(13):941-956. doi: 10.1042/BCJ20230008. Biochem J. 2023. PMID: 37351567 Free PMC article.
-
Evolution of Whirly1 in the angiosperms: sequence, splicing, and expression in a clade of early transitional mycoheterotrophic orchids.Front Plant Sci. 2024 Jun 28;15:1241515. doi: 10.3389/fpls.2024.1241515. eCollection 2024. Front Plant Sci. 2024. PMID: 39006962 Free PMC article.
-
Alternaria TeA toxin activates a chloroplast retrograde signaling pathway to facilitate JA-dependent pathogenicity.Plant Commun. 2024 Mar 11;5(3):100775. doi: 10.1016/j.xplc.2023.100775. Epub 2023 Dec 4. Plant Commun. 2024. PMID: 38050356 Free PMC article.
-
Leaf senescence: progression, regulation, and application.Mol Hortic. 2021 Jun 16;1(1):5. doi: 10.1186/s43897-021-00006-9. Mol Hortic. 2021. PMID: 37789484 Free PMC article. Review.
References
-
- Aboul-Soud MAM, Cook K, Loake GJ(2004) Measurement of salicylic acid by a high-performance liquid chromatography procedure based on ion-exchange. Chromatographia 59: 129–133
-
- An C, Mou Z(2011) Salicylic acid and its function in plant immunity. J Integr Plant Biol 53: 412–428 - PubMed
-
- Bartsch M, Bednarek P, Vivancos PD, Schneider B, von Roepenack-Lahaye E, Foyer CH, Kombrink E, Scheel D, Parker JE(2010) Accumulation of isochorismate-derived 2,3-dihydroxybenzoic 3-O-β-d-xyloside in Arabidopsis resistance to pathogens and ageing of leaves. J Biol Chem 285: 25654–25665 - PMC - PubMed
Publication types
MeSH terms
Substances
LinkOut - more resources
Full Text Sources
Molecular Biology Databases
Miscellaneous

