. 2020 Sep 8;11(1):4241.
doi: 10.1038/s41467-020-17966-z.

Forest carbon sink neutralized by pervasive growth-lifespan trade-offs

Affiliations

Forest carbon sink neutralized by pervasive growth-lifespan trade-offs

R J W Brienen et al. Nat Commun. .

Abstract

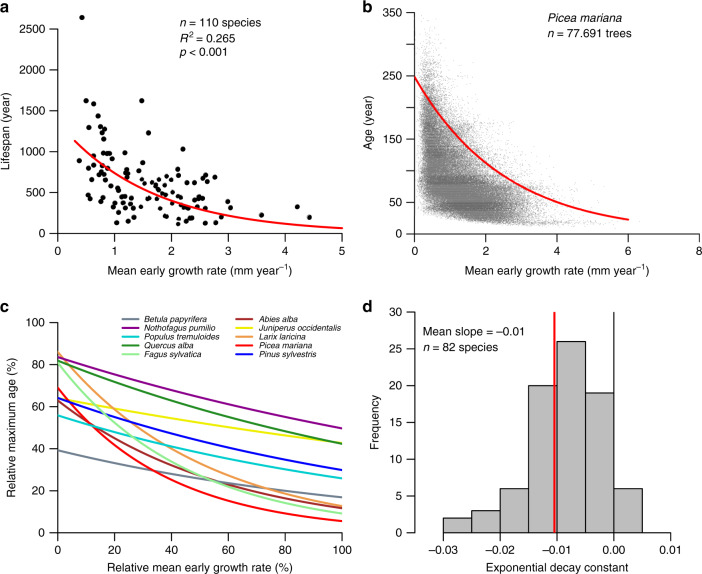
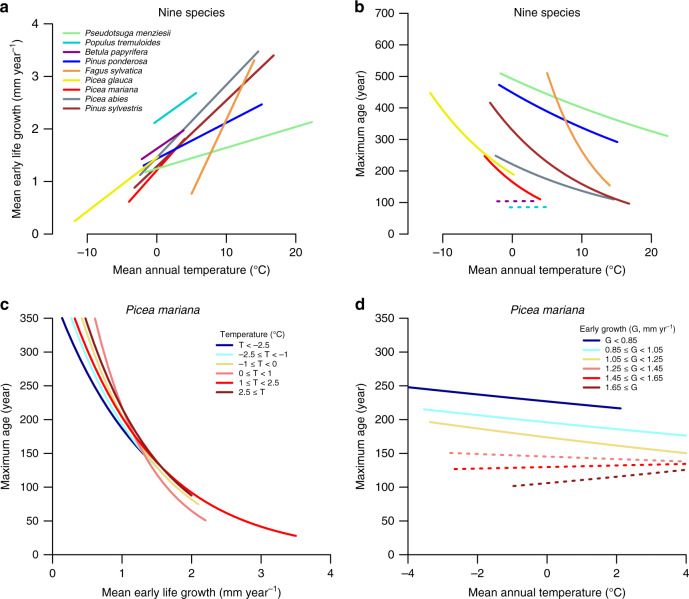
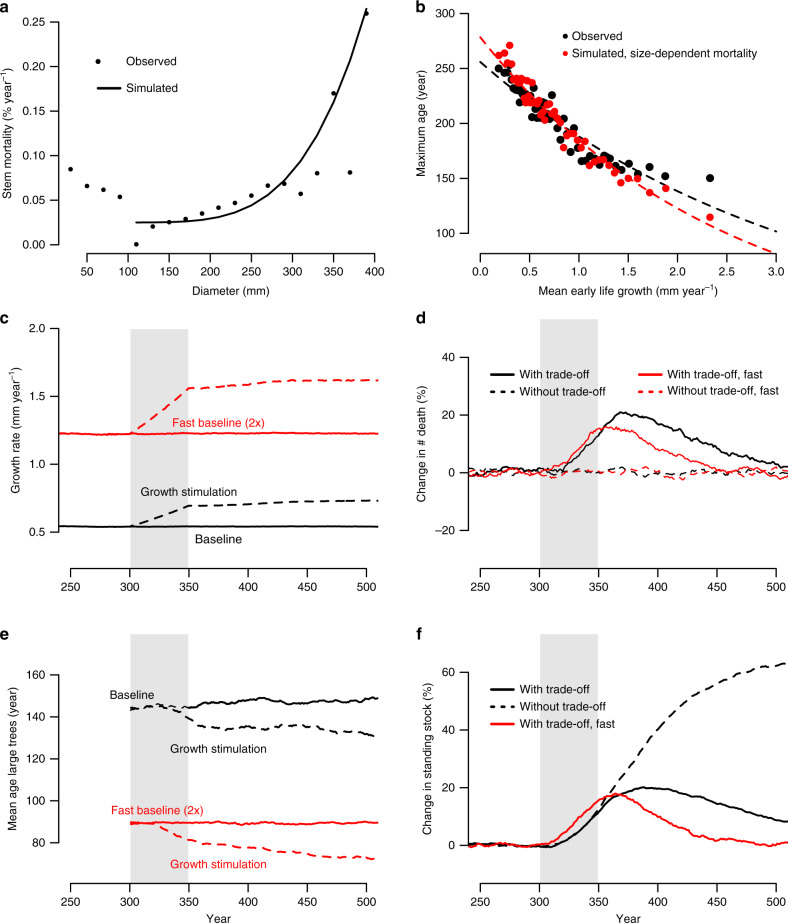
Land vegetation is currently taking up large amounts of atmospheric CO2, possibly due to tree growth stimulation. Extant models predict that this growth stimulation will continue to cause a net carbon uptake this century. However, there are indications that increased growth rates may shorten trees' lifespan and thus recent increases in forest carbon stocks may be transient due to lagged increases in mortality. Here we show that growth-lifespan trade-offs are indeed near universal, occurring across almost all species and climates. This trade-off is directly linked to faster growth reducing tree lifespan, and not due to covariance with climate or environment. Thus, current tree growth stimulation will, inevitably, result in a lagged increase in canopy tree mortality, as is indeed widely observed, and eventually neutralise carbon gains due to growth stimulation. Results from a strongly data-based forest simulator confirm these expectations. Extant Earth system model projections of global forest carbon sink persistence are likely too optimistic, increasing the need to curb greenhouse gas emissions.


Conflict of interest statement

The authors declare no competing interests.

Figures

Fig. 1
Fig. 1. Relationship between growth rate and maximum lifespan derived from tree rings.
a Mean early growth rate (mean ring width over first 10 years) versus maximum lifespan for 110 species, and estimated early growth rate-lifespan relationship (red line) using negative exponential major axis regression. b Early growth rate versus age for Picea mariana, and estimated early growth rate-lifespan relationship (red line) using negative exponential 95th quantile regression. c Estimated relative early growth rate-lifespan relationships within species for five angiosperm and gymnosperm species (for individual plots of these species see Supplementary Fig. 4). Relative early growth and relative lifespan were calculated as the ratio of the early growth rate or age of each tree relative to the maximum growth or age for each species. d Histogram of the exponential decay constant of relative early growth rate vs. relative lifespan relationships for 82 species with sufficiently large datasets.
Fig. 2
Fig. 2. Effect of temperature on early growth and tree lifespan.
a Relationship between early growth rates (mean ring width over first 10 years) and temperature for nine different species sampled across North America and Europe. b Relationship between maximum lifespan and temperature for the same species. c Early growth and lifespan relationships for Picea mariana from Quebec for sites within a fixed annual temperature range. d Relationship between temperature and lifespan for trees within a fixed early growth rate band. Non-significant relationships (p > 0.05) are shown with stippled lines. No adjustments were made for multiple comparisons.
Fig. 3
Fig. 3. Relationships between diameter-mortality and growth rate-lifespan for Picea mariana, and simulation results.
a Observed and simulated mortality rates as a function of tree diameter for Picea mariana from Quebec, Canada. b Observed (black) and simulated (red) relationships between early growth rate and maximum age. cf Effect of tree growth stimulation on mean radial growth rates (c), mortality rates (d), mean age of large trees at death (e), and standing stocks of tree basal area (f). Black lines show results for the simulation scenario using the observed tree ring data, and red lines show results for a fast scenario with growth rates two times faster than observed. Broken lines in panels c and e show results for the scenario with growth stimulation, and broken lines in d and f show results for a scenario based on age-dependent mortality (i.e. without trade-off between growth and tree lifespan). Percent change in tree death rate (d) and basal area stocks (f) are calculated with respect to the no-growth stimulation or baseline scenario. Shaded area in panels cd indicate the period of simulated growth stimulation from year 300 to 350.

References

    1. Ballantyne AP, Alden CB, Miller JB, Tans PP, White JWC. Increase in observed net carbon dioxide uptake by land and oceans during the past 50 years. Nature. 2012;488:70–72. - PubMed
    1. Pan Y, et al. A Large and persistent carbon sink in the world′s forests. Science. 2011;333:988–993. - PubMed
    1. Pugh TA, et al. Role of forest regrowth in global carbon sink dynamics. Proc. Natl Acad. Sci. USA. 2019;116:4382–4387. - PMC - PubMed
    1. Brienen R, et al. Long-term decline of the Amazon carbon sink. Nature. 2015;519:344–348. - PubMed
    1. Sitch S, et al. Evaluation of the terrestrial carbon cycle, future plant geography and climate-carbon cycle feedbacks using five Dynamic Global Vegetation Models (DGVMs) Glob. Change Biol. 2008;14:2015–2039.

Publication types