. 2020 Sep 8;7(1):294.
doi: 10.1038/s41597-020-00633-9.

Large scale in silico characterization of repeat expansion variation in human genomes

Affiliations

Large scale in silico characterization of repeat expansion variation in human genomes

Sarah Fazal et al. Sci Data. .

Abstract

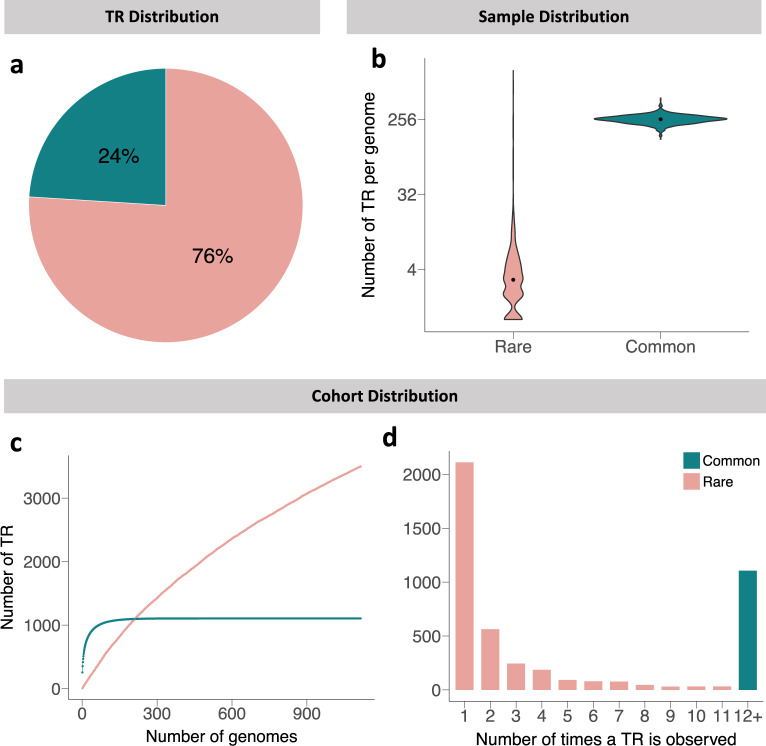
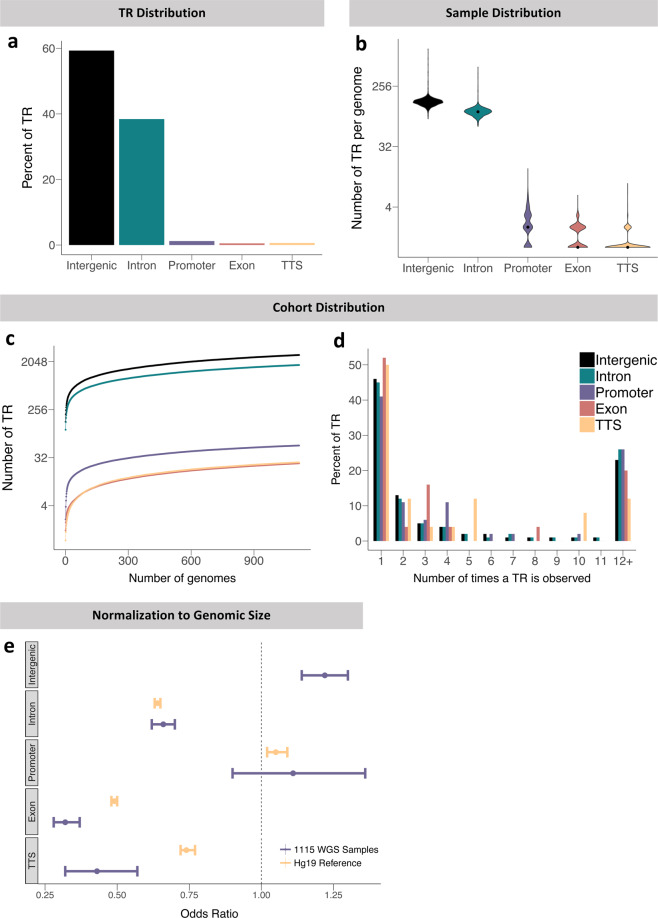
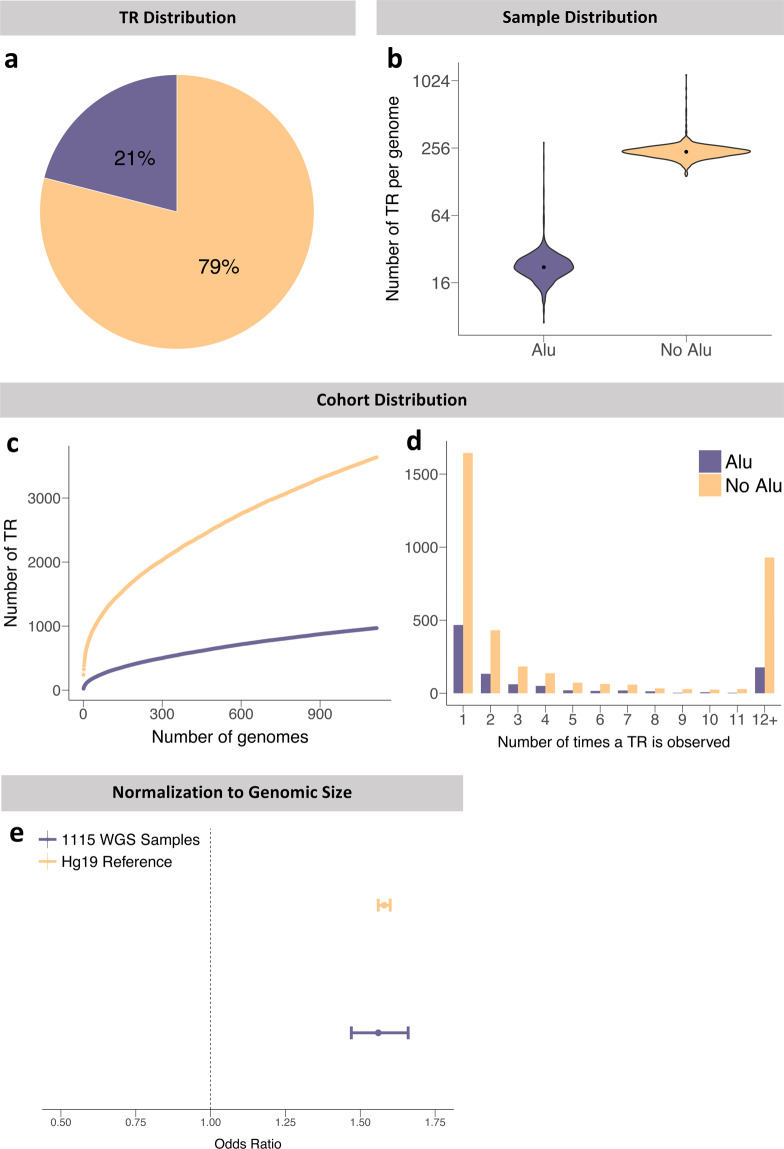
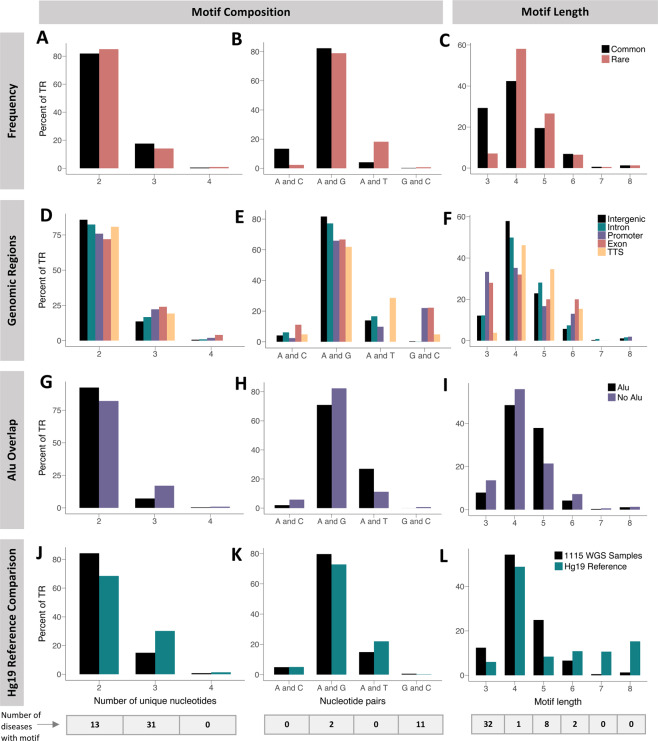
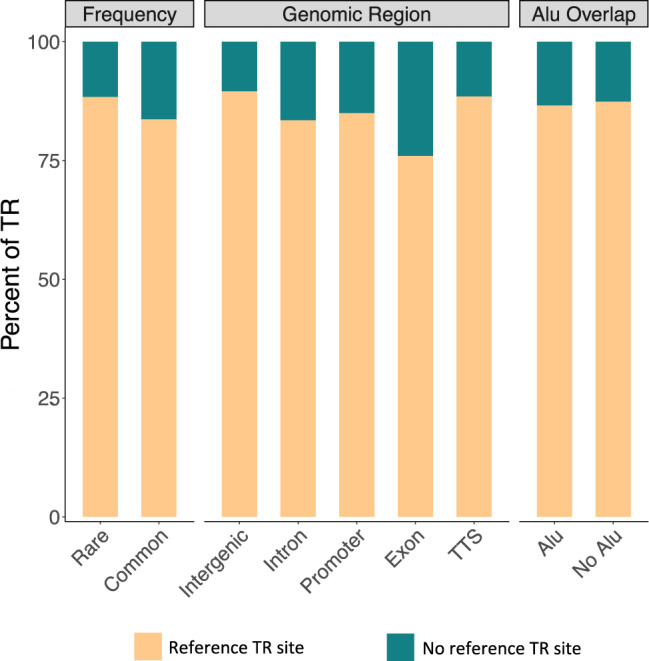
Significant progress has been made in elucidating single nucleotide polymorphism diversity in the human population. However, the majority of the variation space in the genome is structural and remains partially elusive. One form of structural variation is tandem repeats (TRs). Expansion of TRs are responsible for over 40 diseases, but we hypothesize these represent only a fraction of the pathogenic repeat expansions that exist. Here we characterize long or expanded TR variation in 1,115 human genomes as well as a replication cohort of 2,504 genomes, identified using ExpansionHunter Denovo. We found that individual genomes typically harbor several rare, large TRs, generally in non-coding regions of the genome. We noticed that these large TRs are enriched in their proximity to Alu elements. The vast majority of these large TRs seem to be expansions of smaller TRs that are already present in the reference genome. We are providing this TR profile as a resource for comparison to undiagnosed rare disease genomes in order to detect novel disease-causing repeat expansions.


Conflict of interest statement

E.D. and M.A.E. are employees of Illumina, Inc., a public company that develops and markets systems for genetic analysis.

Figures

Fig. 1
Fig. 1
Distributions of rare and common TRs. (a) Percentage distribution of TRs into the rare and common subcategories. (b) Number of TRs per genome in each category. (c) Number of TRs as a function of sample size. (d) Frequency plot of the number of times a TR is observed in the cohort.
Fig. 2
Fig. 2
Distributions of TRs in different genomic regions; intergenic, intron, promoter, exon, and TTS. (a) Percentage distribution of TRs into the genomic region subcategories. (b) Number of TRs per genome in each category. (c) Number of TRs as a function of sample size. (d) Frequency plot of the number of times a TR is observed in the cohort. (e) Odds ratios calculated by Fisher’s exact test for TRs in different genomic regions, in both our dataset and the hg19 reference genome. There is no odds ratio produced for the intergenic category of hg19 because the number of overlaps between the simple repeats and intergenic regions exceeds that of the total number of intergenic regions. This produces a contingency table that results in an undefined value for the odds ratio.
Fig. 3
Fig. 3
Distributions of TRs in Alu and non-Alu overlapping regions. (a) Percentage distribution of TRs into the subcategories. (b) Number of TRs per genome in each category. (c) Number of TRs as a function of sample size. (d) Frequency plot of the number of times a TR is observed in the cohort. (e) Odds ratios calculated by Fisher’s exact test for TRs in each category, in both our dataset and the reference genome.
Fig. 4
Fig. 4
Characterization of observed motifs. Comparison of motifs (AC) belonging to rare versus common TRs, (D–F) stratified by genomic region, (G–I) overlapping an Alu element or not, and (J–L) observed in the 1,115 WGS samples versus those in the hg19 reference genome. In each set of comparisons, the first column (A,D,G,J) shows the frequency of motifs composed of different numbers of unique nucleotides; the second column (B,E,H,K) presents the frequency of motifs of different pairs of nucleotides; and the third column (C,F,I,L) plots the frequency of motifs of lengths 3–8 bp. At the bottom, the number of known repeat expansion diseases with motifs fitting each subcategory described on the X axis is provided.
Fig. 5
Fig. 5
Percent of TRs originating from reference repeat loci with matching motifs in categorical subsets of frequency, genomic regions, and Alu overlap.
Fig. 6
Fig. 6
TR variation at known disease loci. (a) Schematic demonstrating the color-coded legend for panel B. Reference motif only refers to loci that require a mutated motif for disease manifestation. Reference motif = Disease motif refers to loci that require an expanded version of the control motif for disease manifestation. Neither reference nor disease motif refers to loci that have alternative motifs that differ from the reference and disease motifs but do not result in disease. (b) Frequency of genomes with TRs larger than the read length at known disease loci.

References

    1. Haghighi A, et al. An integrated clinical program and crowdsourcing strategy for genomic sequencing and Mendelian disease gene discovery. Genomic Medicine. 2018;3:21. doi: 10.1038/s41525-018-0060-9. - DOI - PMC - PubMed
    1. Gloss BS, Dinger ME. Realizing the significance of noncoding functionality in clinical genomics. Experimental & Molecular Medicine. 2018;50:97. doi: 10.1038/s12276-018-0087-0. - DOI - PMC - PubMed
    1. Maroilley T, Tarailo-Graovac M. Uncovering Missing Heritability in Rare Diseases. Genes. 2019;10:275. doi: 10.3390/genes10040275. - DOI - PMC - PubMed
    1. Chiang C, et al. The impact of structural variation on human gene expression. Nature Genetics. 2017;49:692–699. doi: 10.1038/ng.3834. - DOI - PMC - PubMed
    1. Paulson, H. Handbook of Clinical Neurology. Vol. 147, 105–123 (Elsevier B.V, 2018). - PMC - PubMed

Publication types