. 2020 Nov;30(11):950-965.
doi: 10.1038/s41422-020-00402-8. Epub 2020 Sep 8.

Single-cell transcriptomic analysis defines the interplay between tumor cells, viral infection, and the microenvironment in nasopharyngeal carcinoma

Affiliations

Single-cell transcriptomic analysis defines the interplay between tumor cells, viral infection, and the microenvironment in nasopharyngeal carcinoma

Shanzhao Jin et al. Cell Res. 2020 Nov.

Abstract

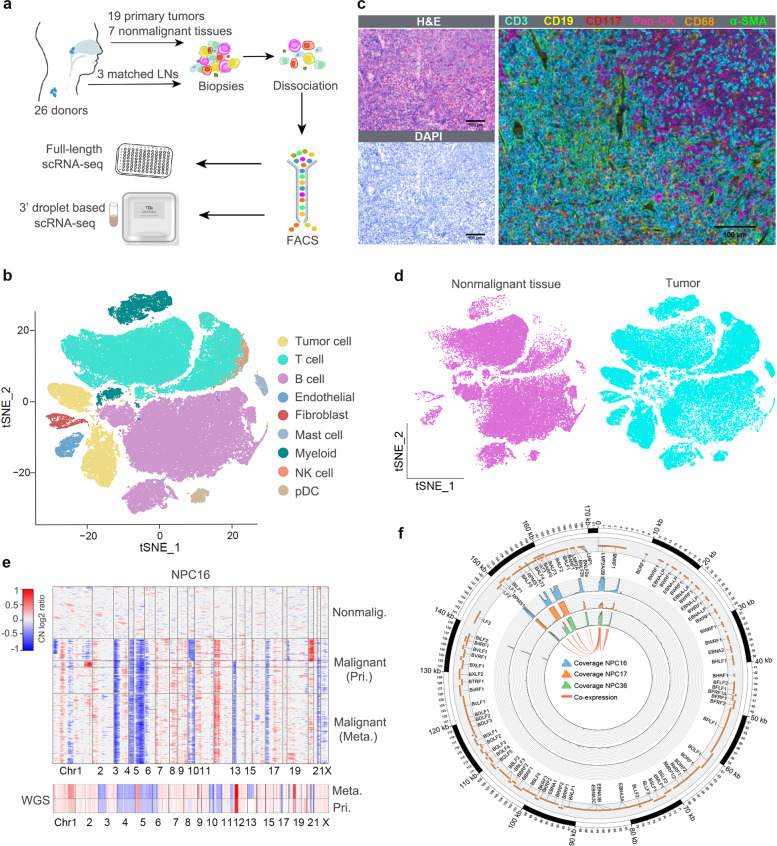
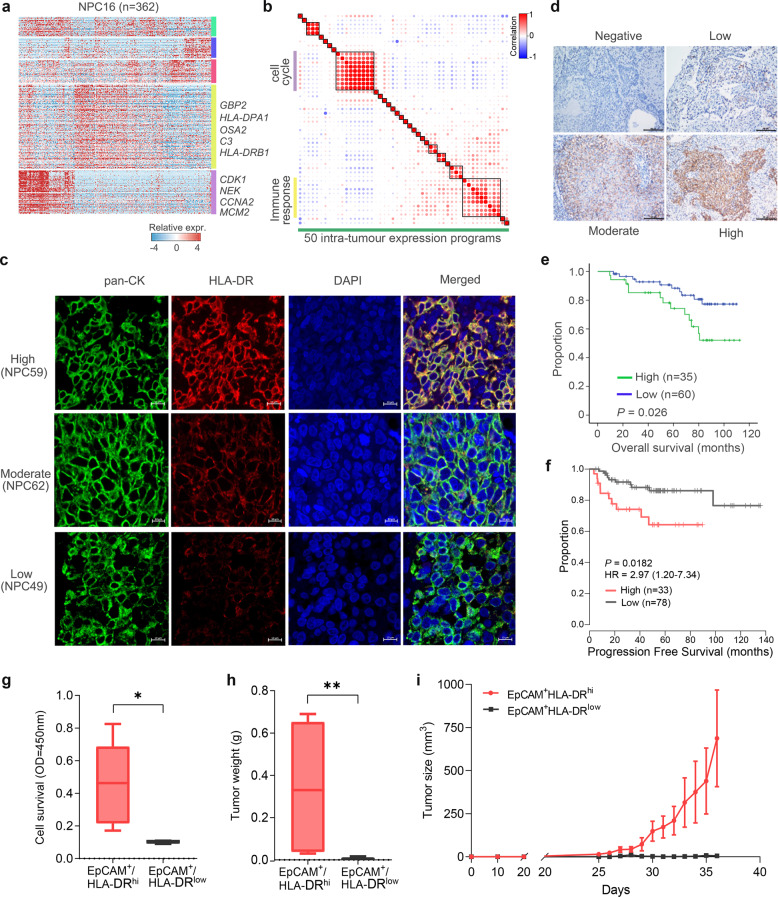
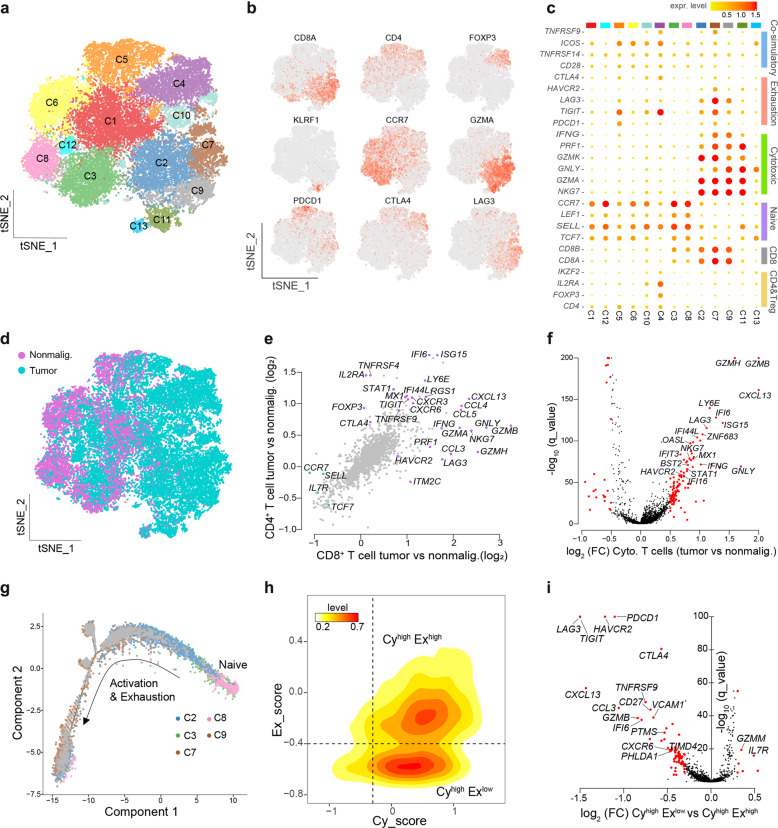
Nasopharyngeal carcinoma (NPC) is an Epstein-Barr virus (EBV)-associated malignancy with a complex tumor ecosystem. How the interplay between tumor cells, EBV, and the microenvironment contributes to NPC progression and immune evasion remains unclear. Here we performed single-cell RNA sequencing on ~104,000 cells from 19 EBV+ NPCs and 7 nonmalignant nasopharyngeal biopsies, simultaneously profiling the transcriptomes of malignant cells, EBV, stromal and immune cells. Overall, we identified global upregulation of interferon responses in the multicellular ecosystem of NPC. Notably, an epithelial-immune dual feature of malignant cells was discovered and associated with poor prognosis. Functional experiments revealed that tumor cells with this dual feature exhibited a higher capacity for tumorigenesis. Further characterization of the cellular components of the tumor microenvironment (TME) and their interactions with tumor cells revealed that the dual feature of tumor cells was positively correlated with the expression of co-inhibitory receptors on CD8+ tumor-infiltrating T cells. In addition, tumor cells with the dual feature were found to repress IFN-γ production by T cells, demonstrating their capacity for immune suppression. Our results provide new insights into the multicellular ecosystem of NPC and offer important clinical implications.


Conflict of interest statement

The authors declare no competing interests.

Figures

Fig. 1
Fig. 1. Expression profiling of ~104,000 single cells from 26 samples.
a Workflow showing the process of sample collection, single-cell dissociation, sorting, and scRNA-seq using two platforms. b t-SNE plot of all single cells from 10× Genomics. c Multi-IHC staining with anti-CD3 (T cells), anti-CD19 (B cells), anti-CD117 (mast cells), anti-Pan-CK (tumor cells), anti-CD68 (macrophages) and anti-α-SMA (fibroblasts) antibodies. Scale bar, 100 μm. d t-SNE plots comparing the distribution of single cells derived from tumors and nonmalignant tissues. e The upper panel shows large-scale CNVs of single cells from a representative tumor (NPC16) that were inferred based on scRNA-seq data. The lower panel exhibits CNVs inferred from whole-genome sequencing. f An annotated Circos plot showing the total coverage of EBV-derived sequencing reads in single cells from three tumors. EBV genes are plotted according to their position and CDS regions. Potential coexpression gene regions are linked by bands with widths proportional to the number of coexpression events among single cells.
Fig. 2
Fig. 2. Deciphering expression programs revealed the epithelial–immune dual feature of malignant cells.
a Heatmap showing gene expression programs deciphered from a representative tumor (NPC16) using NMF. b Pearson correlation clustering of 50 intra-tumor expression programs. The dot size is proportional to the absolute value of the correlation. c The gradient of immunohistochemical staining of HLA-DRB1 in NPC tumors. Top, the strong immunoreactivity of HLA-DR in NPC59 tissue; middle, the moderate immunoreactivity of HLA-DR in NPC62 tissue; bottom, the weak immunoreactivity of HLA-DR in NPC49 tissue. pan-CK was used as a biomarker for NPC tumor cells and DAPI was used for nucleus staining. Scale bar, 10 μm. d Immunohistochemical staining with anti-HLA-DR. Scale bar, 100 μm. e Overall survival of patients with high or low HLA-DR expression. P-value was calculated by the log-rank test. f Progression-free survival of patients with different ISs inferred from bulk RNA-seq data. P-value was calculated by the multivariate Cox regression test. g Comparison of cell survival between IS-high and IS-low populations from a C17 NPC xenograft by the CCK-8 assay. IS-high, EpCAM+HLA-DRhi; IS-low, EpCAM+HLA-DRlow. h, i Comparison of tumor weight and size in nude mice generated from IS-high and IS-low populations injected into a C17 NPC xenograft. Data are means ± SEM. IS-high, EpCAM+HLA-DRhi; IS-low, EpCAM+HLA-DRlow.
Fig. 3
Fig. 3. Assessing the functional states of tumor-infiltrating T cells in NPC.
a t-SNE plot showing 13 clusters of 33,895T cells. b Expression and distribution of canonical T cell marker genes among cells. Red to gray: high to low expression. c Average expression of T cell-specific markers across different clusters. The dot size is proportional to the relative expression level of each gene. d T cell distributions from tumors and nonmalignant tissues. e Scatterplot showing DEGs in tumor-derived CD8+ and CD4+ T cells in comparison with those derived from nonmalignant tissues. Representative genes are labeled. f Volcano plot showing DEGs in tumor-derived cytotoxic T cells in comparison with those derived from nonmalignant tissues. Representative genes are labeled. g The developmental trajectory of CD8+ T cells inferred by Monocle2. h 2D density plot of the cytotoxicity and exhaustion states of CD8+ T cells. Cells are partitioned into ‘high cytotoxicity & high exhaustion’ (CyhighExhigh) and ‘high cytotoxicity & low exhaustion’ (CyhighExlow) groups. i Scatterplot shows DEGs (red dots) between the CyhighExhigh and CyhighExlow groups.
Fig. 4
Fig. 4. Detailed characterization of myeloid cells and fibroblasts.
a t-SNE plot showing 12 clusters of myeloid cells. b 3D diffusion map displaying the developmental trajectory of myeloid cells. The magnified section shows the possible activation paths of macrophages. Cells are colored by their derived clusters. pDCs, plasmacytoid dendritic cells; cpDCs, cross-presenting dendritic cells; mDCs, myeloid-derived dendritic cells. c Scatterplot showing the correlation between the M1 and M2 scores. d t-SNE plot showing 7 clusters of fibroblasts. e Violin plots showing the expression levels of different marker genes across 7 fibroblast clusters. f 3D diffusion map displaying the developmental trajectory of different clusters of fibroblasts. The dashed circle highlights cells that may bridge CAFs and myofibroblasts. g Comparison of IFN-α and IFN-γ scores of single cells in various cellular components of the TME between NPCs and nonmalignant tissues.
Fig. 5
Fig. 5. Composition and cell–cell interactions of the NPC TME.
a Heatmap showing the relative expression levels of cell type-specific genes in 140 NPC bulk expression profiles. b Multi-IHC staining in NPC TME. Staining with anti-CD3 (T cells), anti-CD19 (B cells), anti-CD117 (mast cells), anti-Pan-CK (tumor cells), anti-CD68 (macrophages) and anti-α-SMA (fibroblasts) antibodies in two representative tumors. Scale bar, 100 μm. c Progression-free survival of patients with different TME compositions. P-values were calculated by the log-rank test. d, e Circos plots displaying putative ligand–receptor interactions between tumor cells and nonmalignant cells. Interactions are divided into incoming and outgoing events. The brand links pairs of interacting cell types, and its width is proportional to the number of events, which is also labeled in the graph. Representative ligand–receptor pairs are labeled. f, g Scatterplots depicting inferred cell–cell interactions between fibroblasts and ECs (f), tumor cells and T cells (g). h Summary of selected ligand–receptor interactions between different cell types. P–values (permutation test) are represented by the size of each circle. The color gradient indicates the level of interaction. Black triangles indicate that the interacting cell types are derived from nonmalignant tissues.
Fig. 6
Fig. 6. Inhibitory receptor expression by TILs was induced by EpCAM+HLA-DRhi tumor cells.
a Summary of selected ligand–receptor interactions between subgroups of tumor cells with T cell types. P-values (permutation test) are represented by the size of each circle. The color gradient indicates the level of interaction. Black triangles indicate that the interacting cell types were derived from nonmalignant tissues. b Correlation of inhibitory receptors expression in the infiltrating tumor CD8+ T cell subgroup with the percentage of EpCAM+HLA-DRhi tumor cells from NPC tissues (n = 27). c Comparison of co-expression of inhibitory receptors in CD8+ T cells between EpCAM+HLA-DRhi and EpCAM+HLA-DRlow subgroups of NPC samples (n = 27, EpCAM+HLA-DRhi and EpCAM+HLA-DRlow subgroups were defined using the median expression of HLA-DR). d, e Quantification of IFN-γ production by the ELISPOT assay after co-culturing of TILs with a panel of IS-high (EpCAM+HLA-DRhi) and IS-low (EpCAM+HLA-DRlow) tumor cells with particular degradant ratios (TILs:tumor cells, 100:1, 50:1, 20:1). f Comparison of co-inhibitory receptor expression in CD8+ T cells after co-culturing with EpCAM+HLA-DRhi or EpCAM+HLA-DRlow tumor cells (TILs:tumor cells, 100:1).

References

    1. Wei WI, Sham JST. Nasopharyngeal carcinoma. Lancet. 2005;365:2041–2054. - PubMed
    1. Lin DC, et al. The genomic landscape of nasopharyngeal carcinoma. Nat. Genet. 2014;46:866–871. - PubMed
    1. Tsang CM, Tsao SW. The role of Epstein-Barr virus infection in the pathogenesis of nasopharyngeal carcinoma. Virol. Sin. 2015;30:107–121. - PMC - PubMed
    1. Jha HC, Pei YG, Robertson ES. Epstein-Barr Virus: diseases linked to infection and transformation. Front. Microbiol. 2016;7:1602. - PMC - PubMed
    1. Young LS, Yap LF, Murray PG. Epstein-Barr virus: more than 50 years old and still providing surprises. Nat. Rev. Cancer. 2016;16:789–802. - PubMed

Publication types

MeSH terms