

Accounting for Global COVID-19 Diffusion Patterns, January-April 2020
- PMID: 32901228
- PMCID: PMC7471593
- DOI: 10.1007/s41885-020-00071-2
Accounting for Global COVID-19 Diffusion Patterns, January-April 2020
Abstract
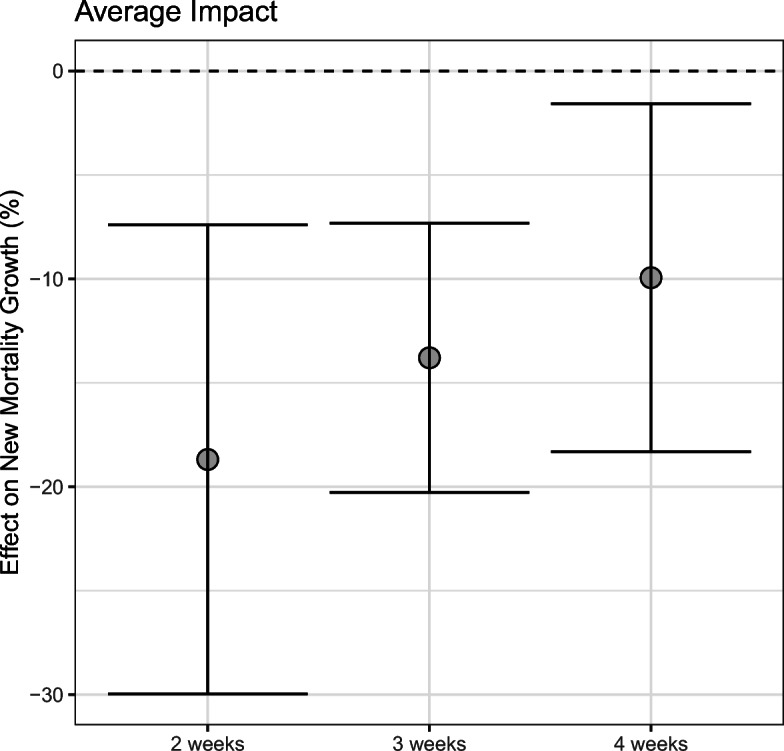
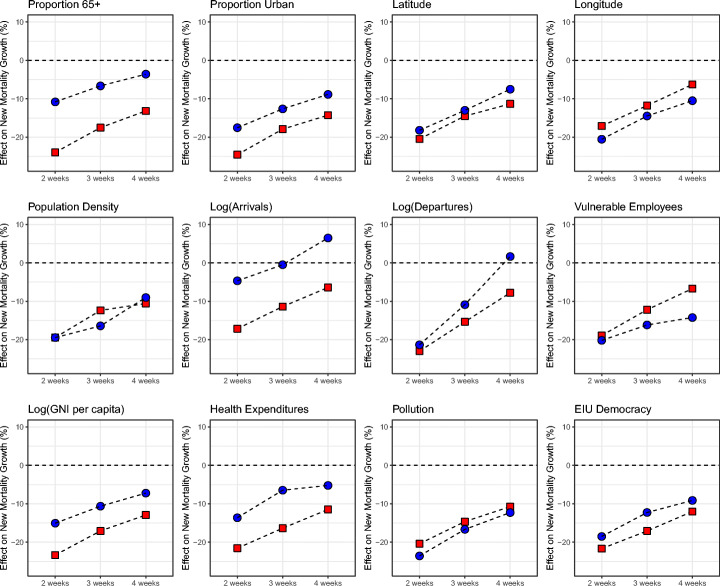
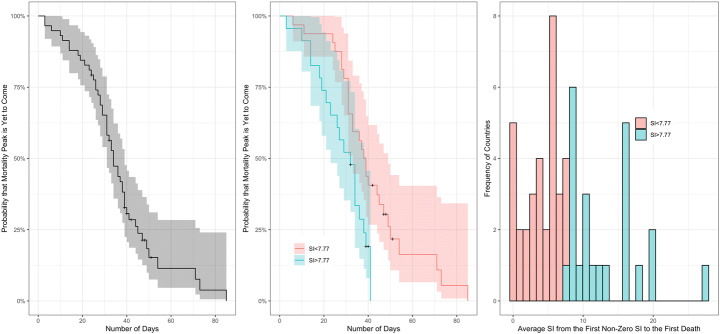
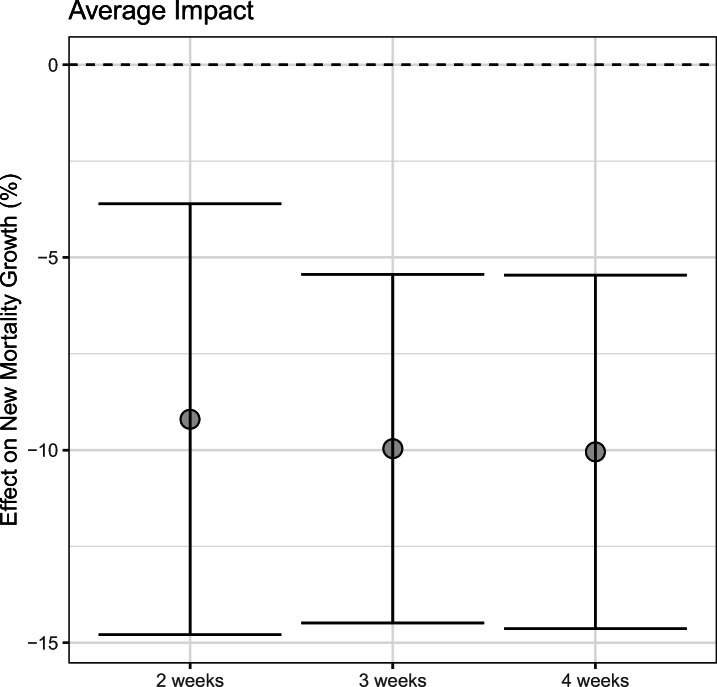
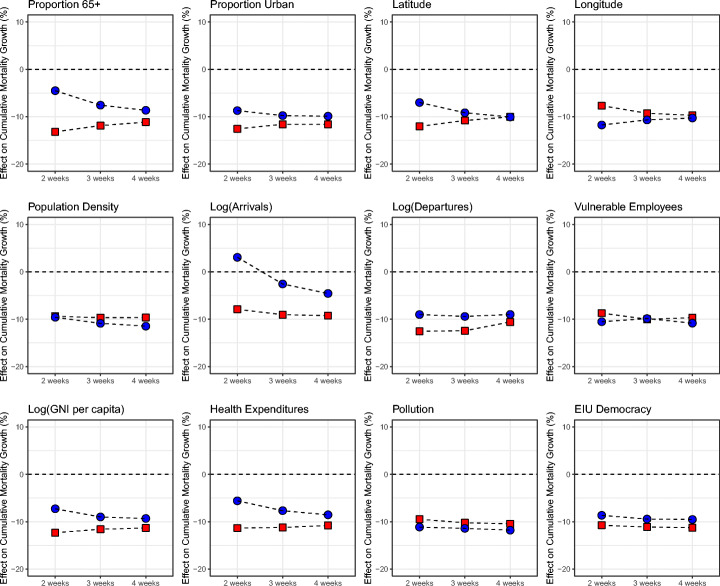
Key factors in modeling a pandemic and guiding policy-making include mortality rates associated with infections; the ability of government policies, medical systems, and society to adapt to the changing dynamics of a pandemic; and institutional and demographic characteristics affecting citizens' perceptions and behavioral responses to stringent policies. This paper traces the cross-country associations between COVID-19 mortality, policy interventions aimed at limiting social contact, and their interactions with institutional and demographic characteristics. We document that, with a lag, more stringent pandemic policies were associated with lower mortality growth rates. The association between stricter pandemic policies and lower future mortality growth is more pronounced in countries with a greater proportion of the elderly population and urban population, greater democratic freedoms, and larger international travel flows. Countries with greater policy stringency in place prior to the first death realized lower peak mortality rates and exhibited lower durations to the first mortality peak. In contrast, countries with higher initial mobility saw higher peak mortality rates in the first phase of the pandemic, and countries with a larger elderly population, a greater share of employees in vulnerable occupations, and a higher level of democracy took longer to reach their peak mortalities. Our results suggest that policy interventions are effective at slowing the geometric pattern of mortality growth, reducing the peak mortality, and shortening the duration to the first peak. We also shed light on the importance of institutional and demographic characteristics in guiding policy-making for future waves of the pandemic.
Keywords: Covid-19; Cross-country estimates; Flattening the mortality curve; Government intervention; Lock-down; Pandemic; Policy stringency; Socioeconomic indicators.
© Springer Nature Switzerland AG 2020.
Figures
Similar articles
-
Policy stringency and mental health during the COVID-19 pandemic: a longitudinal analysis of data from 15 countries.Lancet Public Health. 2022 May;7(5):e417-e426. doi: 10.1016/S2468-2667(22)00060-3. Epub 2022 Apr 21. Lancet Public Health. 2022. PMID: 35461592 Free PMC article.
-
The value conflict between freedom and security: Explaining the variation of COVID-19 policies in democracies and autocracies.PLoS One. 2022 Sep 9;17(9):e0274270. doi: 10.1371/journal.pone.0274270. eCollection 2022. PLoS One. 2022. PMID: 36083998 Free PMC article.
-
Assessing COVID-19 pandemic policies and behaviours and their economic and educational trade-offs across US states from Jan 1, 2020, to July 31, 2022: an observational analysis.Lancet. 2023 Apr 22;401(10385):1341-1360. doi: 10.1016/S0140-6736(23)00461-0. Epub 2023 Mar 23. Lancet. 2023. PMID: 36966780 Free PMC article.
-
Battling COVID-19 pandemic waves in six South-East Asian countries: A real-time consensus review.Med J Malaysia. 2020 Nov;75(6):613-625. Med J Malaysia. 2020. PMID: 33219168 Review.
-
Classification Schemes of COVID-19 High Risk Areas and Resulting Policies: A Rapid Review.Front Public Health. 2022 Feb 25;10:769174. doi: 10.3389/fpubh.2022.769174. eCollection 2022. Front Public Health. 2022. PMID: 35284361 Free PMC article.
Cited by
-
COVID-19: The impact of social distancing policies, cross-country analysis.Econ Disaster Clim Chang. 2021;5(1):135-159. doi: 10.1007/s41885-020-00076-x. Epub 2020 Oct 15. Econ Disaster Clim Chang. 2021. PMID: 33078135 Free PMC article.
-
Crowding on public transport using smart card data during the COVID-19 pandemic: New methodology and case study in Chile.Sustain Cities Soc. 2023 Sep;96:104712. doi: 10.1016/j.scs.2023.104712. Epub 2023 Jun 8. Sustain Cities Soc. 2023. PMID: 37313370 Free PMC article.
-
Quantifying the Regional Disproportionality of COVID-19 Spread: Modeling Study.JMIR Form Res. 2025 Jan 3;9:e59230. doi: 10.2196/59230. JMIR Form Res. 2025. PMID: 39757976 Free PMC article.
-
Impacts of the COVID-19 pandemic on life expectancy at birth in Asia.BMC Public Health. 2023 Aug 9;23(1):1508. doi: 10.1186/s12889-023-16426-9. BMC Public Health. 2023. PMID: 37558978 Free PMC article.
-
Machine Learning for Analyzing Non-Countermeasure Factors Affecting Early Spread of COVID-19.Int J Environ Res Public Health. 2021 Jun 23;18(13):6750. doi: 10.3390/ijerph18136750. Int J Environ Res Public Health. 2021. PMID: 34201618 Free PMC article.
References
-
- Acemoglu D, Chernozhukov V., Werning I., Whinston MD (2020) A multi-risk SIR model with optimally targeted Lockdownm. NBER working paper no. 27102
-
- Ang YY (2020) When COVID-19 meets centralized, personalized power. Nat Hum Behav 4(5):445–447. - PubMed
-
- Atkeson A (2020) How deadly is COVID-19? Understanding the difficulties with estimation of its fatality rate. NBER Working Paper No. 26965
-
- Avery C, Bossert W, Clark A, Ellison G, Ellison SF (2020) Policy implications of models of the spread of coronavirus: perspectives and opportunities for economists. NBER Working Paper No. 27007
LinkOut - more resources
Full Text Sources
Miscellaneous