. 2020 Feb 20;2(1):fcaa018.
doi: 10.1093/braincomms/fcaa018. eCollection 2020.

The rise and fall of fasciculations in amyotrophic lateral sclerosis

Affiliations

The rise and fall of fasciculations in amyotrophic lateral sclerosis

James A Bashford et al. Brain Commun. .

Abstract

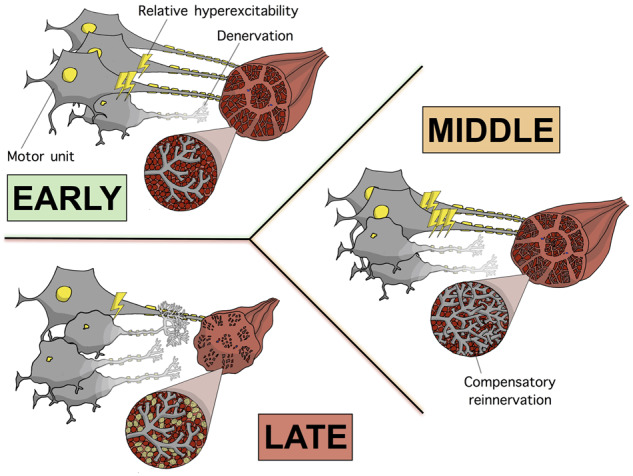
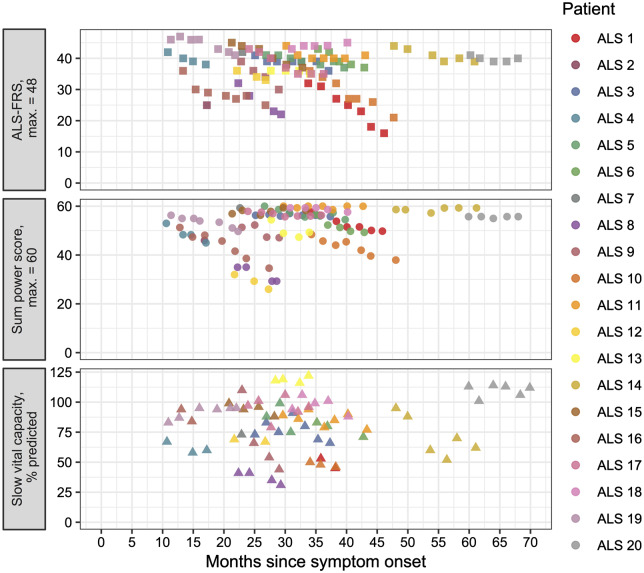
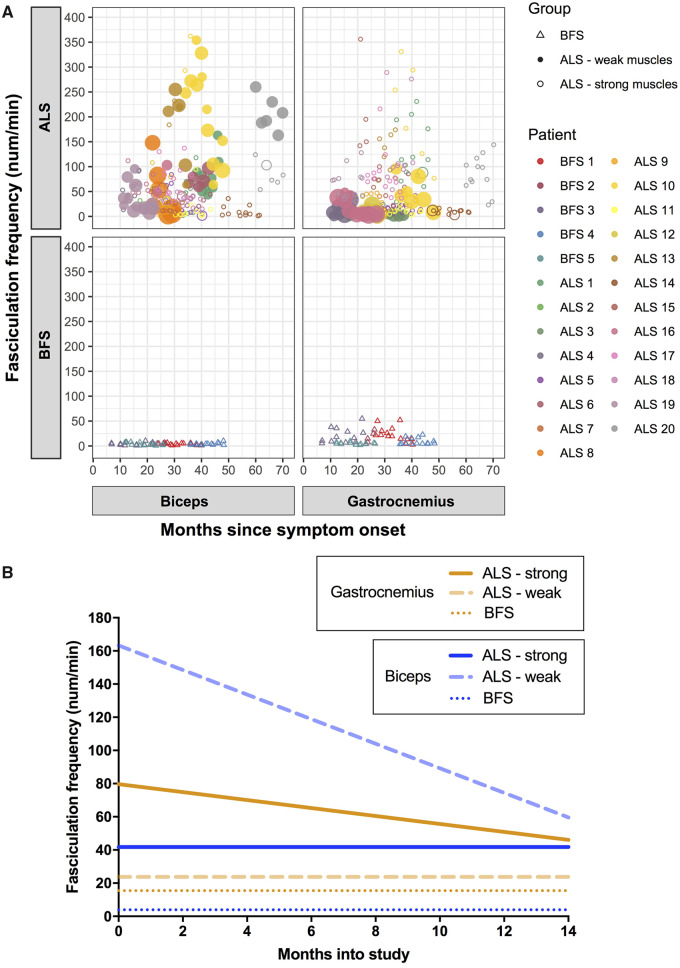
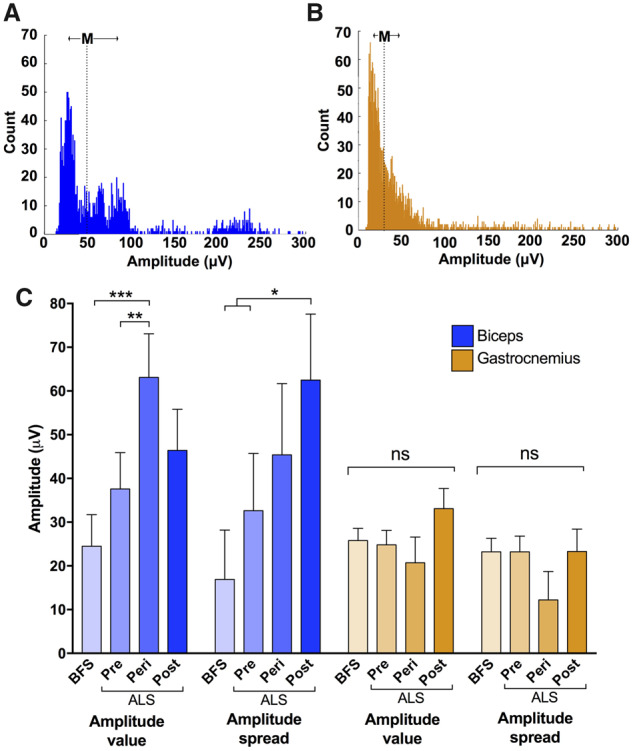
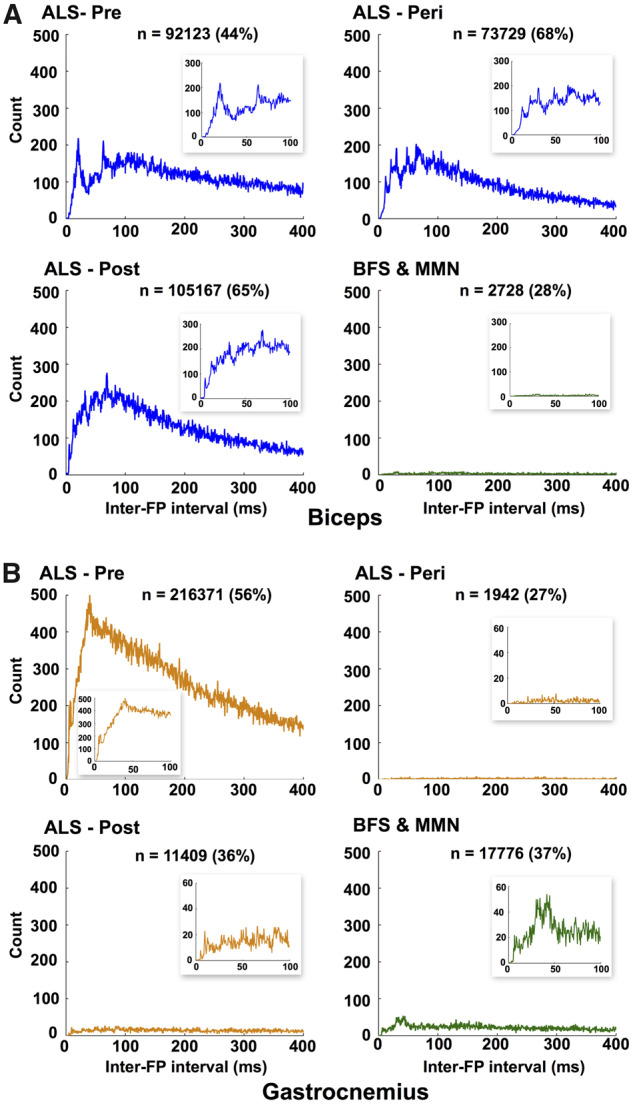
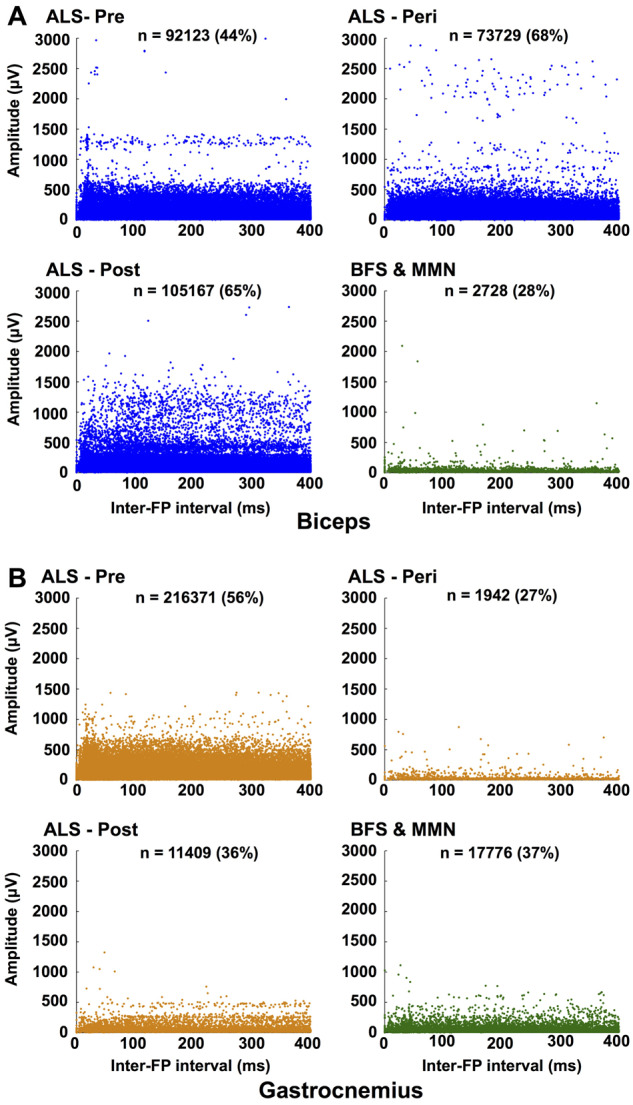
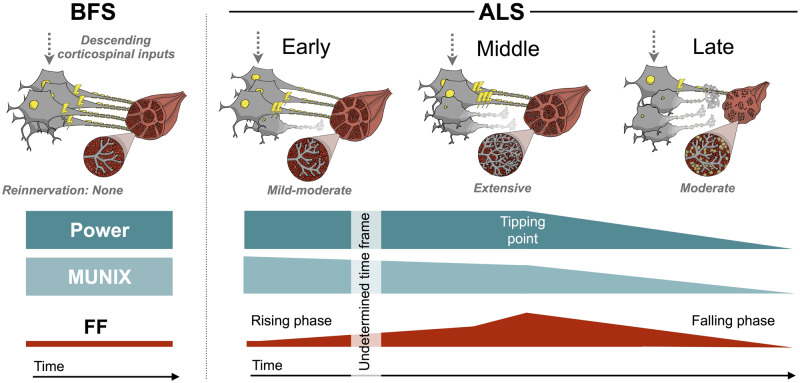
Amyotrophic lateral sclerosis is a devastating neurodegenerative disease with a median survival of 3 years from symptom onset. Accessible and reliable biomarkers of motor neuron decline are urgently needed to quicken the pace of drug discovery. Fasciculations represent an early pathophysiological hallmark of amyotrophic lateral sclerosis and can be reliably detected by high-density surface electromyography. We set out to quantify fasciculation potentials prospectively over 14 months, seeking comparisons with established markers of disease progression. Twenty patients with amyotrophic lateral sclerosis and five patients with benign fasciculation syndrome underwent up to seven assessments each. At each assessment, we performed the amyotrophic lateral sclerosis-functional rating scale, sum power score, slow vital capacity, 30-min high-density surface electromyography recordings from biceps and gastrocnemius and the motor unit number index. We employed the Surface Potential Quantification Engine, which is an automated analytical tool to detect and characterize fasciculations. Linear mixed-effect models were employed to account for the pseudoreplication of serial measurements. The amyotrophic lateral sclerosis-functional rating scale declined by 0.65 points per month (P < 0.0001), 35% slower than average. A total of 526 recordings were analysed. Compared with benign fasciculation syndrome, biceps fasciculation frequency in amyotrophic lateral sclerosis was 10 times greater in strong muscles and 40 times greater in weak muscles. This was coupled with a decline in fasciculation frequency among weak muscles of -7.6/min per month (P = 0.003), demonstrating the rise and fall of fasciculation frequency in biceps muscles. Gastrocnemius behaved differently, whereby strong muscles in amyotrophic lateral sclerosis had fasciculation frequencies five times greater than patients with benign fasciculation syndrome while weak muscles were increased by only 1.5 times. Gastrocnemius demonstrated a significant decline in fasciculation frequency in strong muscles (2.4/min per month, P < 0.0001), which levelled off in weak muscles. Fasciculation amplitude, an easily quantifiable surrogate of the reinnervation process, was highest in the biceps muscles that transitioned from strong to weak during the study. Pooled analysis of >900 000 fasciculations revealed inter-fasciculation intervals <100 ms in the biceps of patients with amyotrophic lateral sclerosis, particularly in strong muscles, consistent with the occurrence of doublets. We hereby present the most comprehensive longitudinal quantification of fasciculation parameters in amyotrophic lateral sclerosis, proposing a unifying model of the interactions between motor unit loss, muscle power and fasciculation frequency. The latter showed promise as a disease biomarker with linear rates of decline in strong gastrocnemius and weak biceps muscles, reflecting the motor unit loss that drives clinical progression.

Keywords: EMG; amyotrophic lateral sclerosis; biomarker; fasciculation; nerve excitability.


Conflict of interest statement

Competing interests The authors report no competing interests.

Figures

Graphical Abstract
Graphical Abstract
Figure 1
Figure 1
Change in clinical parameters over time. Plots of amyotrophic lateral sclerosis-functional rating scale (top, square symbols), sum MRC power score (middle, circle symbols) and slow vital capacity (bottom, triangle symbols) per patient (colour coded as per legend) against months elapsed since symptom onset (see ‘Results’ section for statistical analyses).
Figure 2
Figure 2
Change in FF over time. (A) FF against months since symptom onset per muscle per patient group. Individual patients are colour coded (see legend). Weak amyotrophic lateral sclerosis muscles are filled circles, and strong amyotrophic lateral sclerosis muscles are clear circles. The larger the symbol, the weaker the muscle at the time of recording. (B) Representation of FF over time for each muscle group, based on results from linear mixed-effect models (see ‘Results’ section).
Figure 3
Figure 3
Comparison of amplitude parameters. Representative amplitude histograms from individual 30-min recordings from (A) biceps of a patient with amyotrophic lateral sclerosis and (B) gastrocnemius of a patient with benign fasciculation syndrome. Note multiple peaks in ‘a’, typical of an amyotrophic lateral sclerosis recording. ‘M’ depicts median amplitude and arrows indicate inter-quartile range (IQR). Bin width = 1 μV. (C) The average amplitude value (median) and amplitude spread (IQR) have been calculated for each 30-min recording. Statistical comparisons were made using linear mixed-effect models with group (benign fasciculation syndrome/pre/peri/post) as fixed effect. ‘Pre’ refers to pre-weakness (i.e. amyotrophic lateral sclerosis muscles that remained strong throughout the whole study), ‘peri’ refers to peri-weakness (i.e. amyotrophic lateral sclerosis muscles that transitioned from strong to weak during the course of the study) and ‘post’ refers to post-weakness (i.e. amyotrophic lateral sclerosis muscles that began the study weak). Boxes and whiskers display means and standard error. Post hoc multiple comparison testing was performed using Holm-Bonferroni correction in R.
Figure 4
Figure 4
Analysis of IFIs. Histogram of intervals between successive FPs in the ‘super-channel’ (see ‘Materials and methods’ section for explanation) for (A) biceps and (B) gastrocnemius. These represent intervals between FPs arising from different MUs. FPs have been recorded from bilateral muscles of 26 patients with amyotrophic lateral sclerosis (1–7 assessments per patient), 6 patients with benign fasciculation syndrome (2–7 assessments per patient) and 1 patient with multifocal motor neuropathy (6 assessments). Bin width = 0.5 ms. x-Axis cut-off at 400 ms. n = number of IFIs detected in range 0–400 ms (percentage of total number within each group given in brackets). Insets show zoomed results between 0 and 100 ms. Note varying y-axis scales of insets. FP: fasciculation potential.
Figure 5
Figure 5
Relationship between IFIs and FP amplitude. Scatterplots for ‘amyotrophic lateral sclerosis-pre-weakness’, ‘amyotrophic lateral sclerosis-peri-weakness’, ‘amyotrophic lateral sclerosis-post-weakness’ and ‘benign fasciculation syndrome and multifocal motor neuropathy’ for (A) biceps and (B) gastrocnemius (see ‘Materials and methods’ section for the explanation of groups). For each interval between two successive fasciculations, each FP amplitude is plotted separately. x-Axis cut-off at 400 ms. n = number of intervals detected in range 0–400 ms (percentage of total number within each group given in brackets). FP: fasciculation potential.
Figure 6
Figure 6
Proposed model—the rise and fall of fasciculations in individual amyotrophic lateral sclerosis muscles. This is our proposed model of the interactions between muscle power, size of viable MU pool (as assessed by MUNIX) and FF in benign fasciculation syndrome and three stages of disease in amyotrophic lateral sclerosis. The diagrams depict the dynamic changes in MU architecture and relative hyperexcitability (depicted by electric bolts) as a consequence of motor neuron degeneration and MU loss. In benign fasciculation syndrome, there is global hyperexcitability affecting all MUs to a similar degree in the absence of motor neuron degeneration. In early amyotrophic lateral sclerosis, a subset of MUs are hyperexcitable, MU loss has begun and mild–moderate compensatory reinnervation has occurred. Due to the stability of biceps FF in strong muscles over 14 months (at a firing rate ∼10× greater than the benign fasciculation syndrome baseline), the rising phase is hypothesized to begin many years before muscle weakness first appears. It is postulated that towards the latter end of the rising phase, the rate of increase in FF speeds up, so that by the onset of weakness, FF is ∼40× the benign fasciculation syndrome baseline. In the middle stage, the ongoing loss of MUs has promoted extensive reinnervation of surviving MUs, which then become hyperexcitable themselves. This compensatory mechanism leads to fasciculations of greater amplitude and allows muscles to remain strong by staving off muscular atrophy. However, a tipping point is reached, whereby these compensatory mechanisms saturate, leading to the onset of muscle atrophy and weakness. In late amyotrophic lateral sclerosis, the death of the most reinnervated MUs leads to worsening muscle atrophy and weakness. The relentless loss of MUs drives the falling FF. Evidence of doublets with IFIs in the 20–80 ms range is consistent with the supernormal period of MU subtypes (fast-slow), supporting a proximal origin of fasciculations at the soma. Consequently, throughout all stages of amyotrophic lateral sclerosis and in benign fasciculation syndrome, the degree of hyperexcitability of the lower motor neuron is likely to be driven and/or influenced by descending corticospinal inputs.

References

    1. Al-Chalabi A, Hardiman O.. The epidemiology of ALS: a conspiracy of genes, environment and time. Nat Rev Neurol 2013; 9: 617–28. - PubMed
    1. Alonso A, Logroscino G, Jick SS, Hernán MA.. Incidence and lifetime risk of motor neuron disease in the United Kingdom: a population-based study. Eur J Neurol 2009; 16: 745–51. - PMC - PubMed
    1. Andrews JA, Meng L, Kulke SF, Rudnicki SA, Wolff AA, Bozik ME, et al.Association between decline in slow vital capacity and respiratory insufficiency, use of assisted ventilation, tracheostomy, or death in patients with amyotrophic lateral sclerosis. JAMA Neurol 2018; 75: 58–64. - PMC - PubMed
    1. Barkhaus PE, Nandedkar SD.. Recording characteristics of the surface EMG electrodes. Muscle Nerve 1994; 17: 1317–23. - PubMed
    1. Bashford J, Wickham A, Iniesta R, Drakakis E, Boutelle M, Mills K, et al.SPiQE: An automated analytical tool for detecting and characterising fasciculations in amyotrophic lateral sclerosis. Clin Neurophysiol 2019; 130: 1083–90. - PMC - PubMed

LinkOut - more resources