Knockout of VDAC1 in H9c2 Cells Promotes Oxidative Stress-Induced Cell Apoptosis through Decreased Mitochondrial Hexokinase II Binding and Enhanced Glycolytic Stress
- PMID: 32901466
- PMCID: PMC7898235
- DOI: 10.33594/000000274
Knockout of VDAC1 in H9c2 Cells Promotes Oxidative Stress-Induced Cell Apoptosis through Decreased Mitochondrial Hexokinase II Binding and Enhanced Glycolytic Stress
Abstract
Background/aims: The role of VDAC1, the most abundant mitochondrial outer membrane protein, in cell death depends on cell types and stimuli. Both silencing and upregulation of VDAC1 in various type of cancer cell lines can stimulate apoptosis. In contrast, in mouse embryonic stem (MES) cells and mouse embryonic fibroblasts (MEFs), the roles of VDAC1 knockout (VDAC1-/-) in apoptotic cell death are contradictory. The contribution and underlying mechanism of VDAC1-/- in oxidative stress-induced cell death in cardiac cells has not been established. We hypothesized that VDAC1 is an essential regulator of oxidative stress-induced cell death in H9c2 cells.
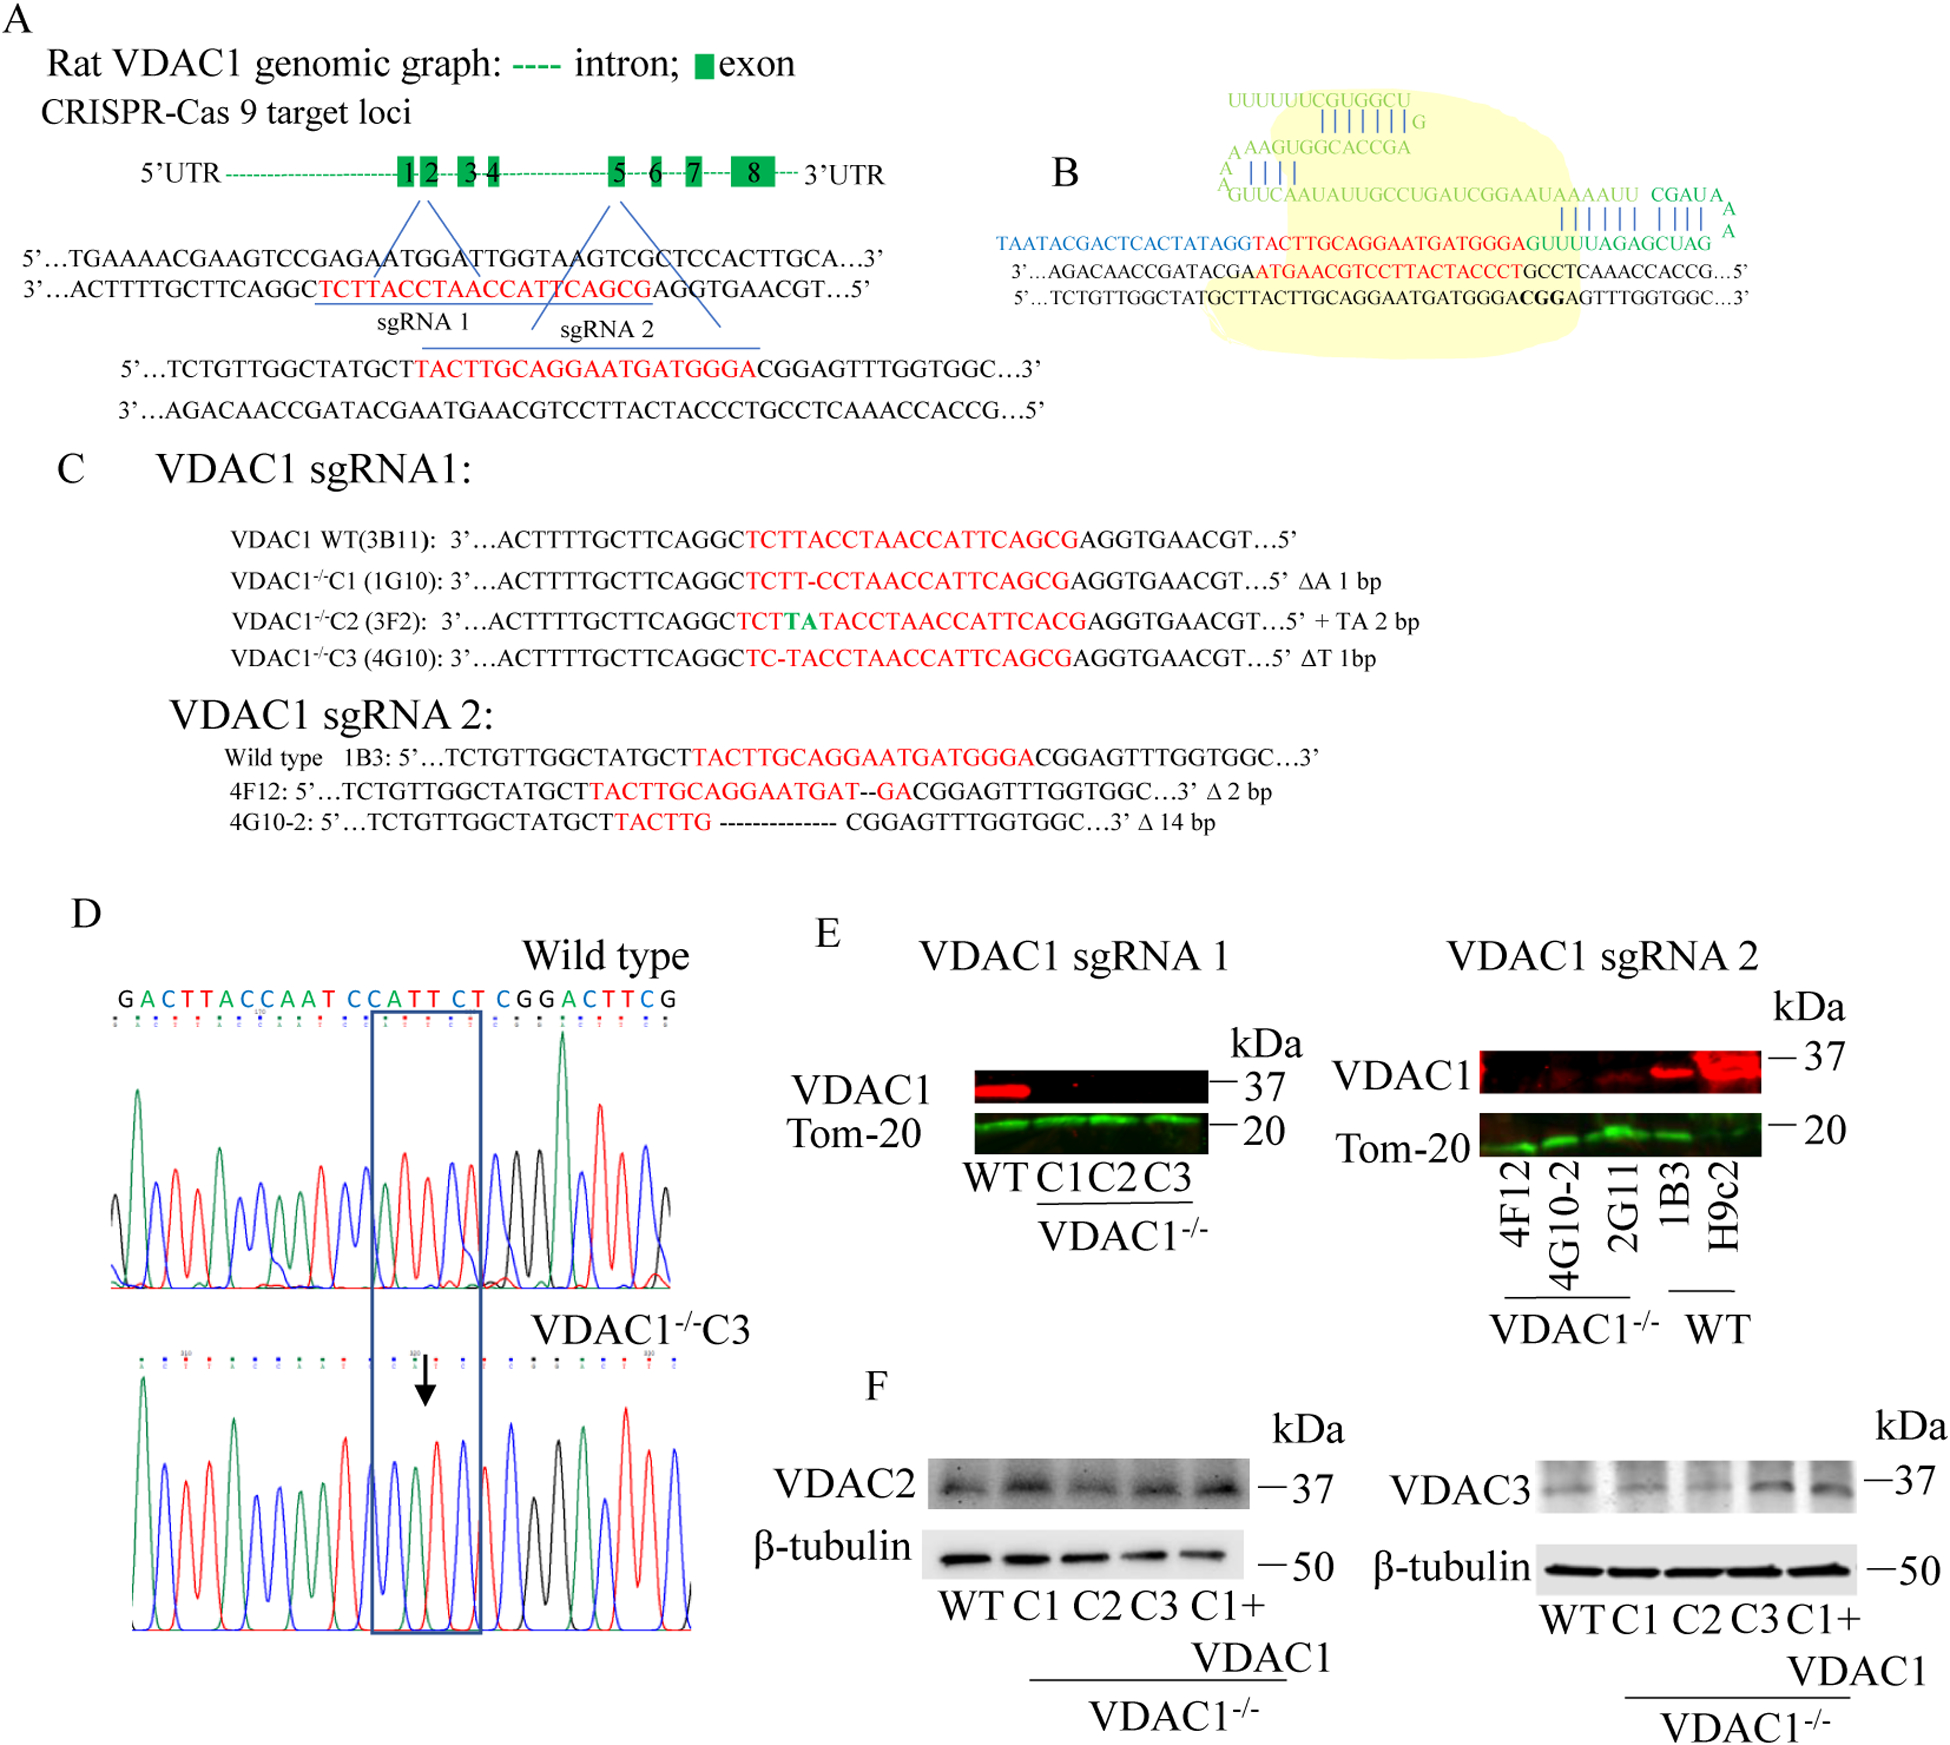
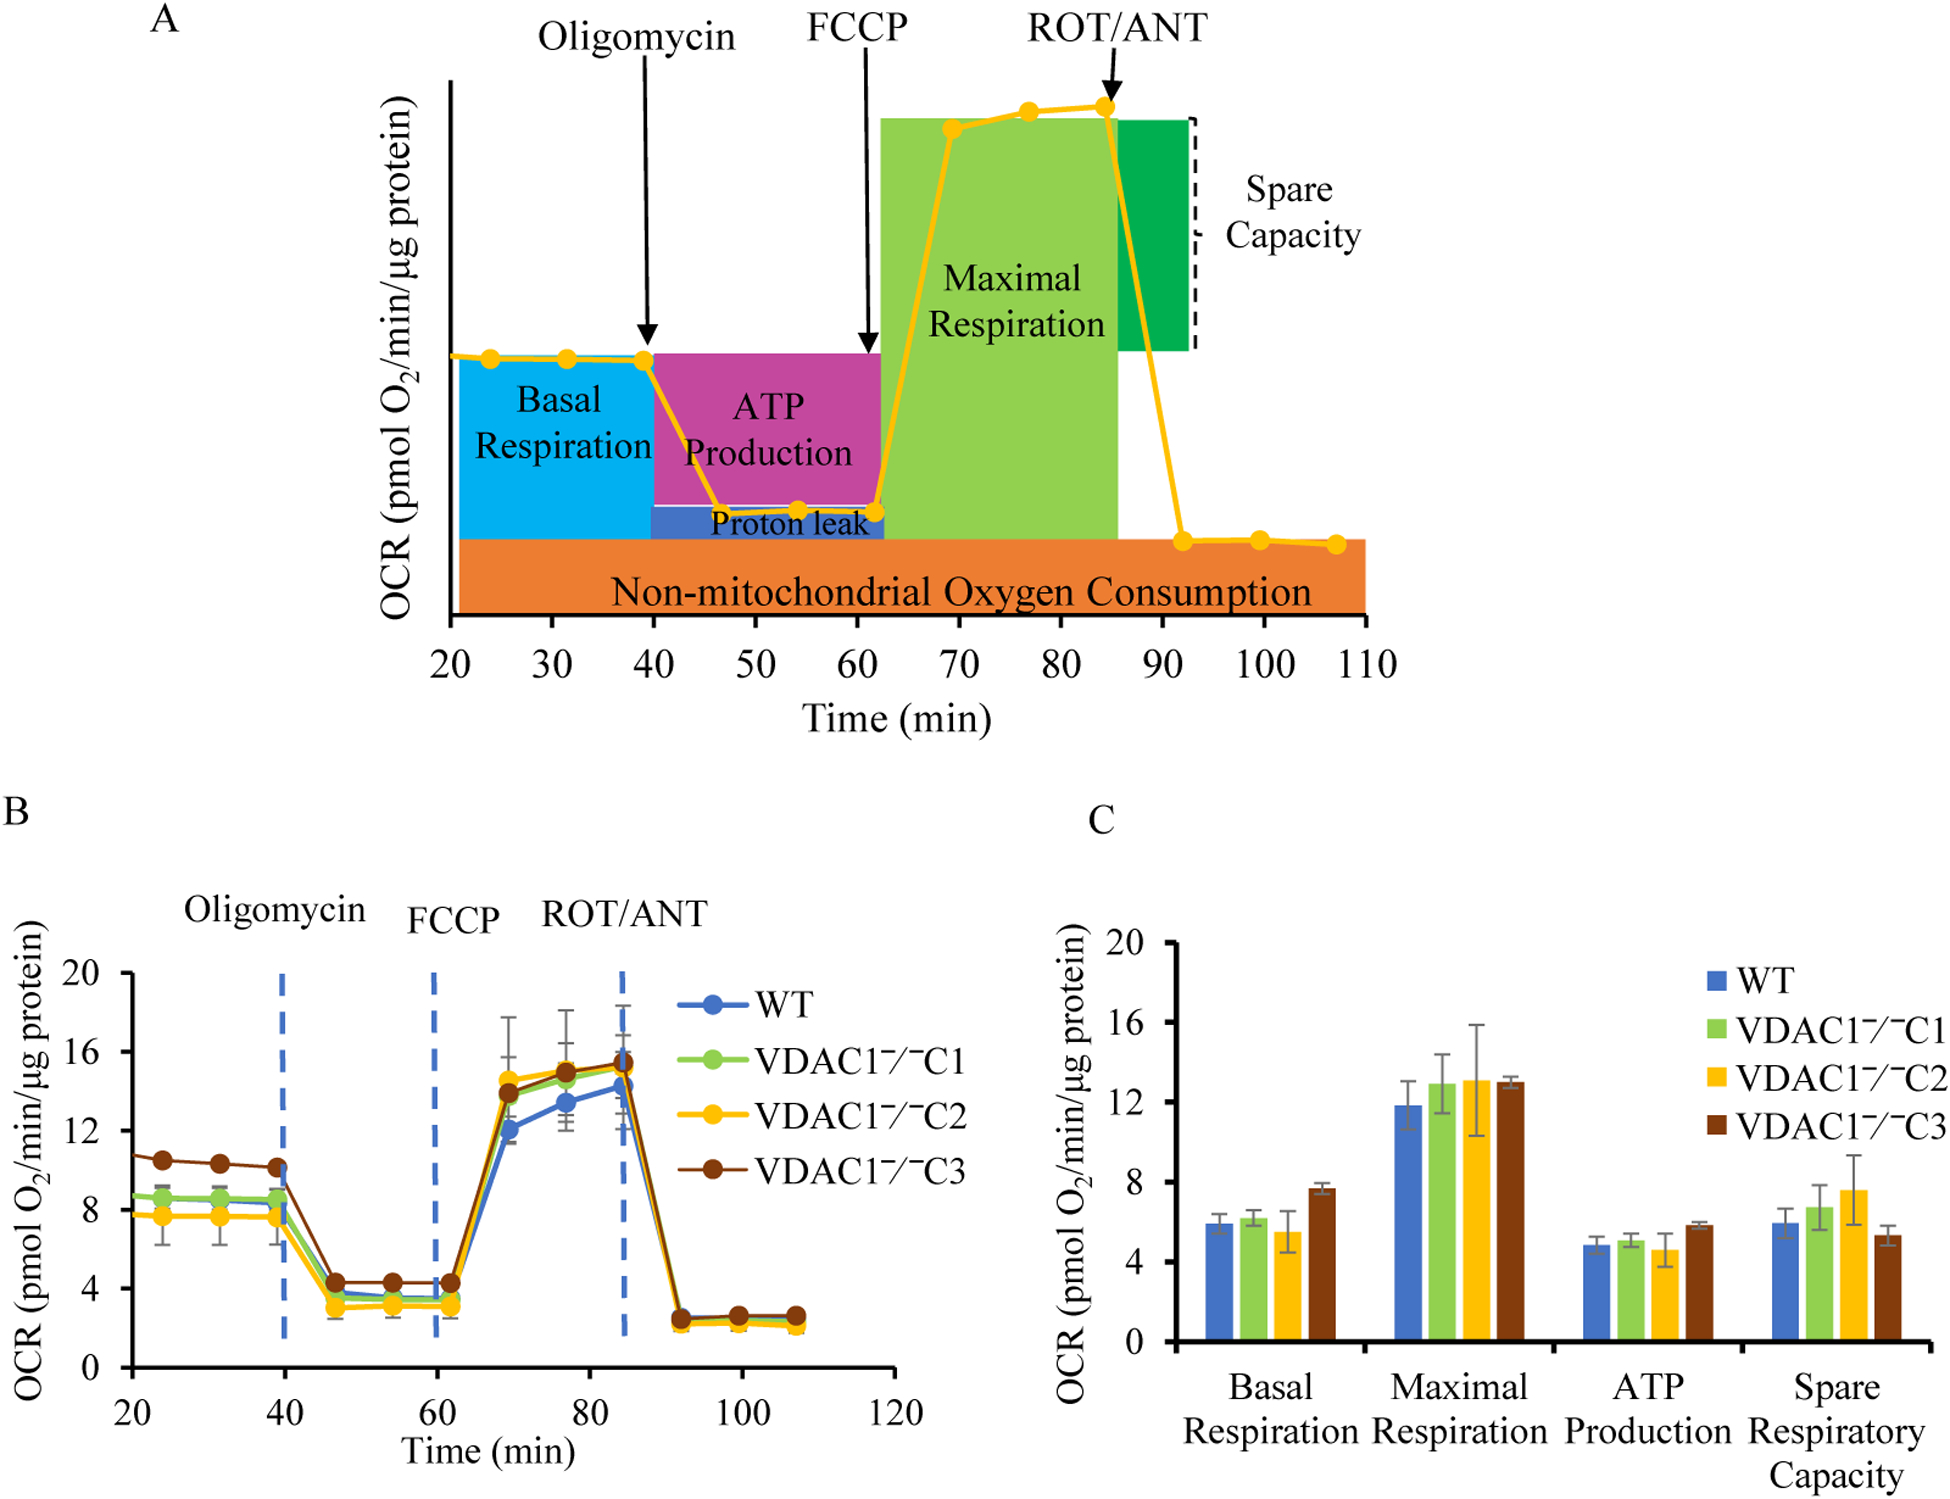
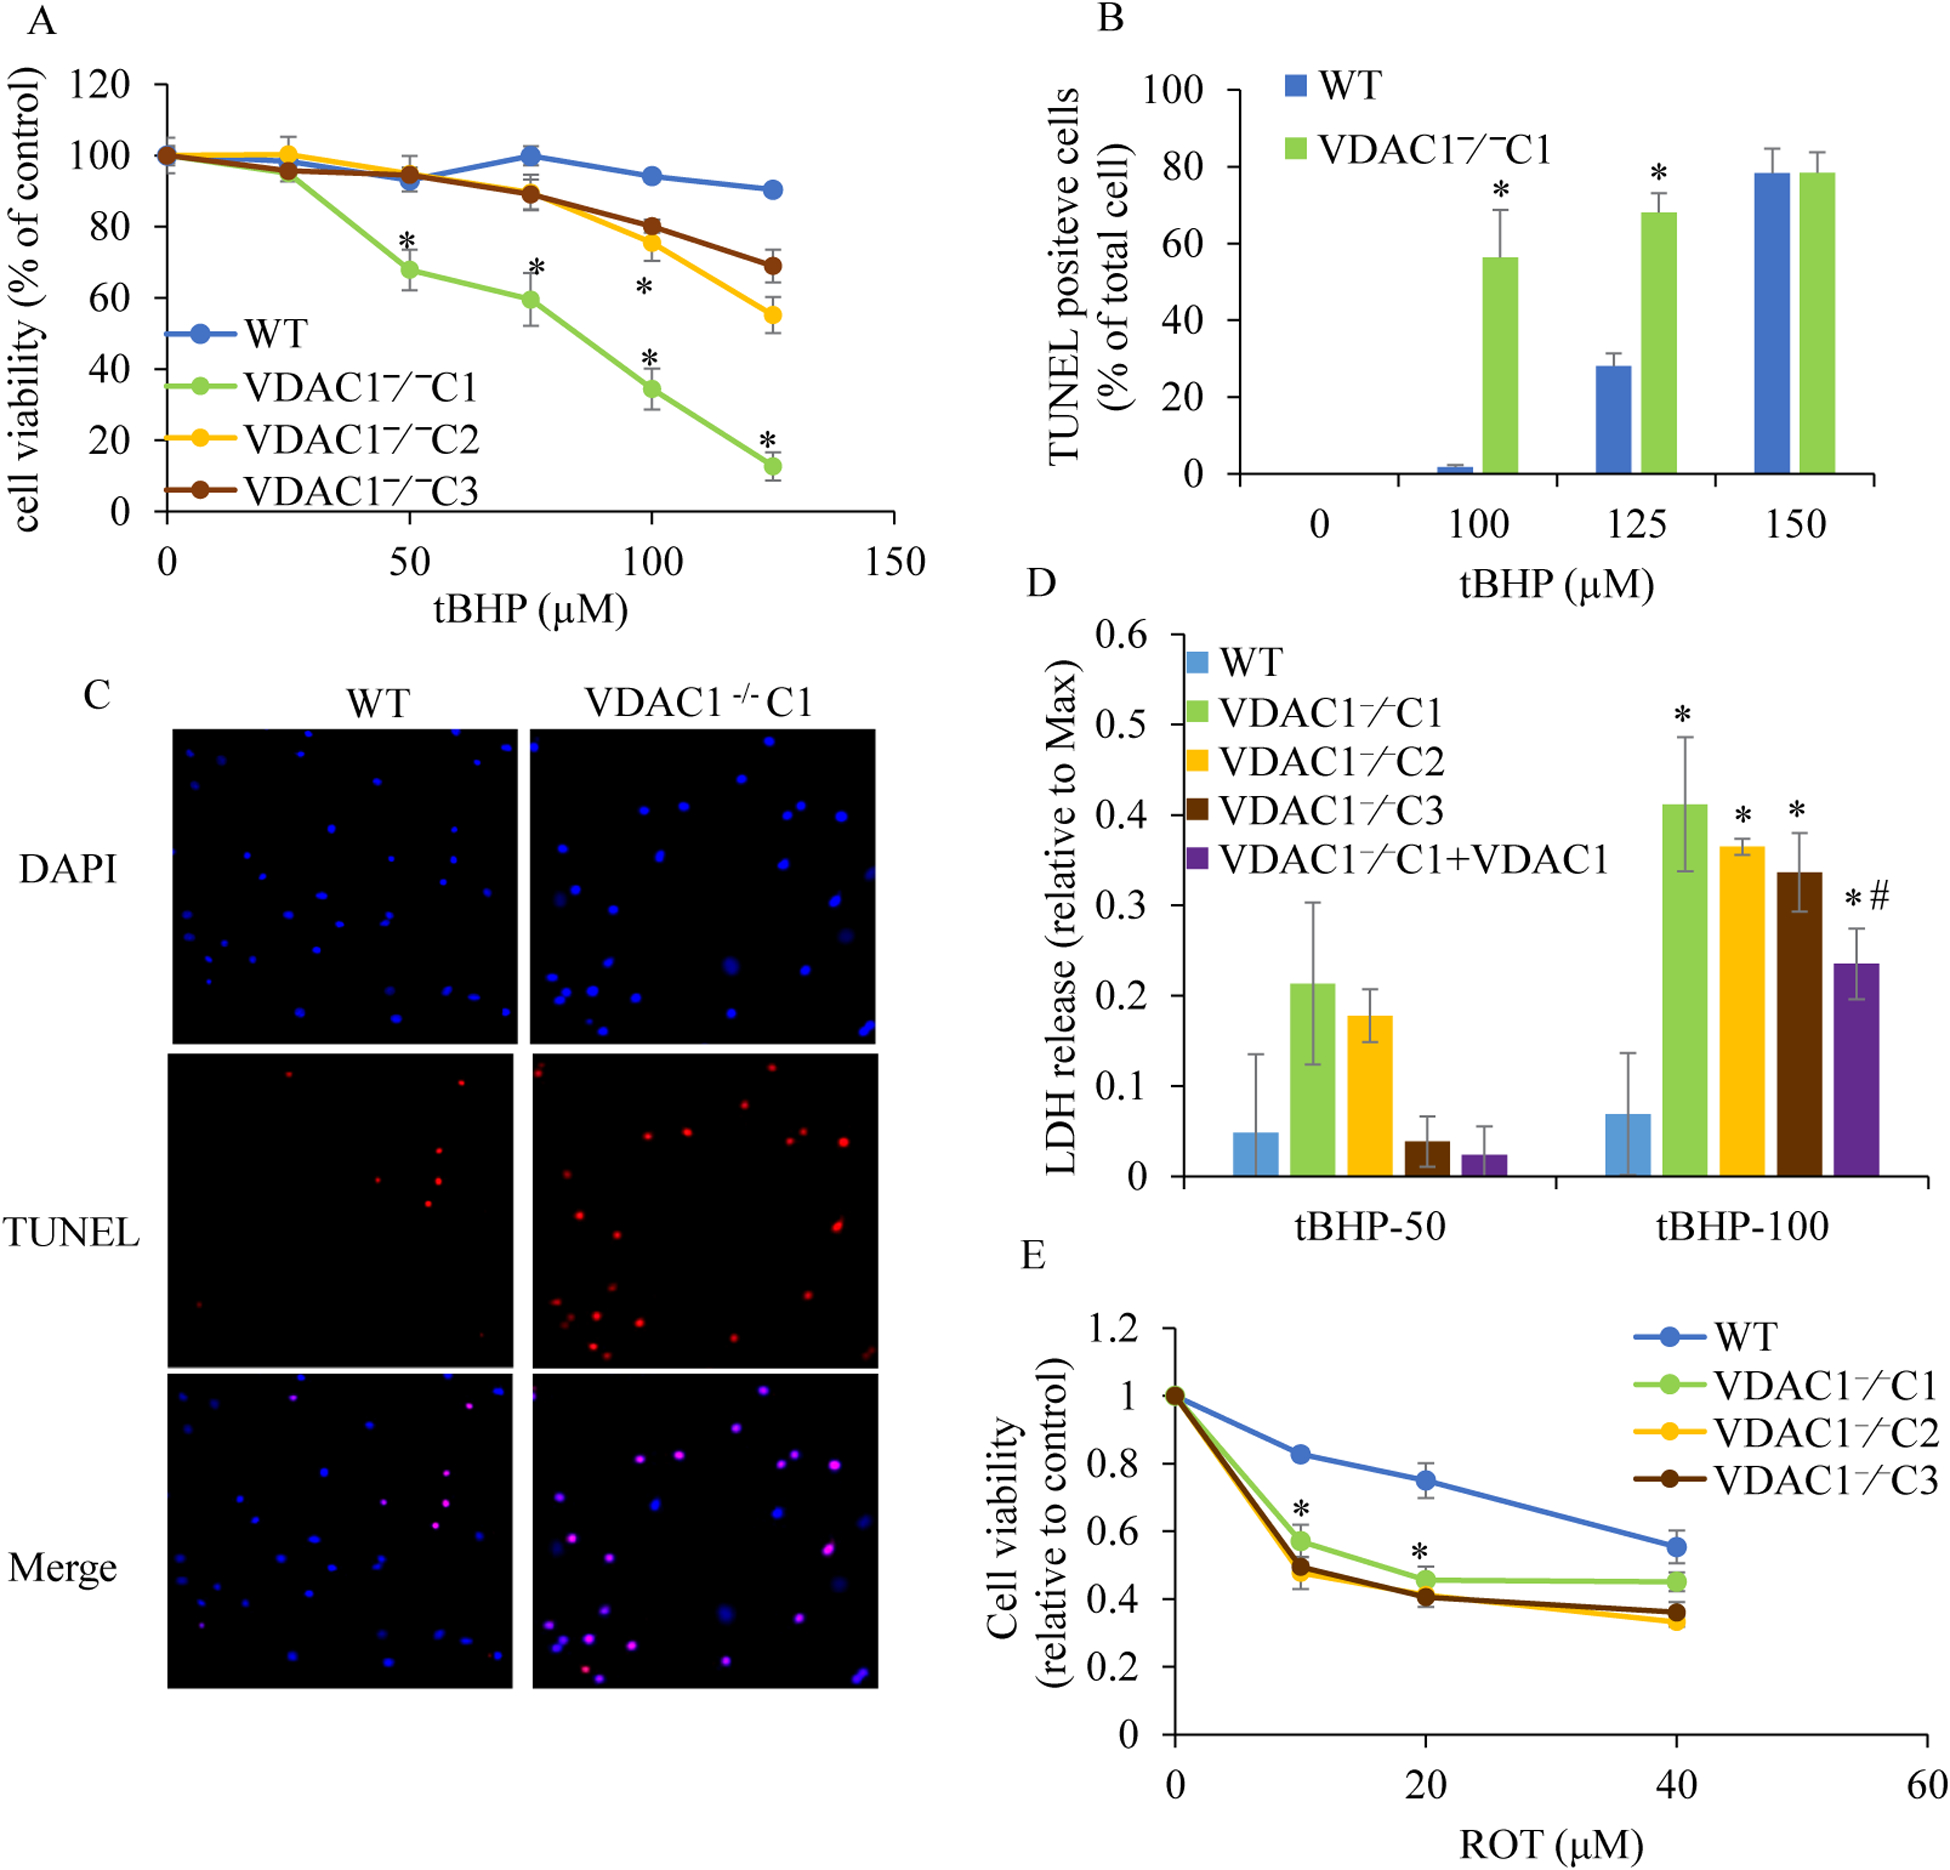
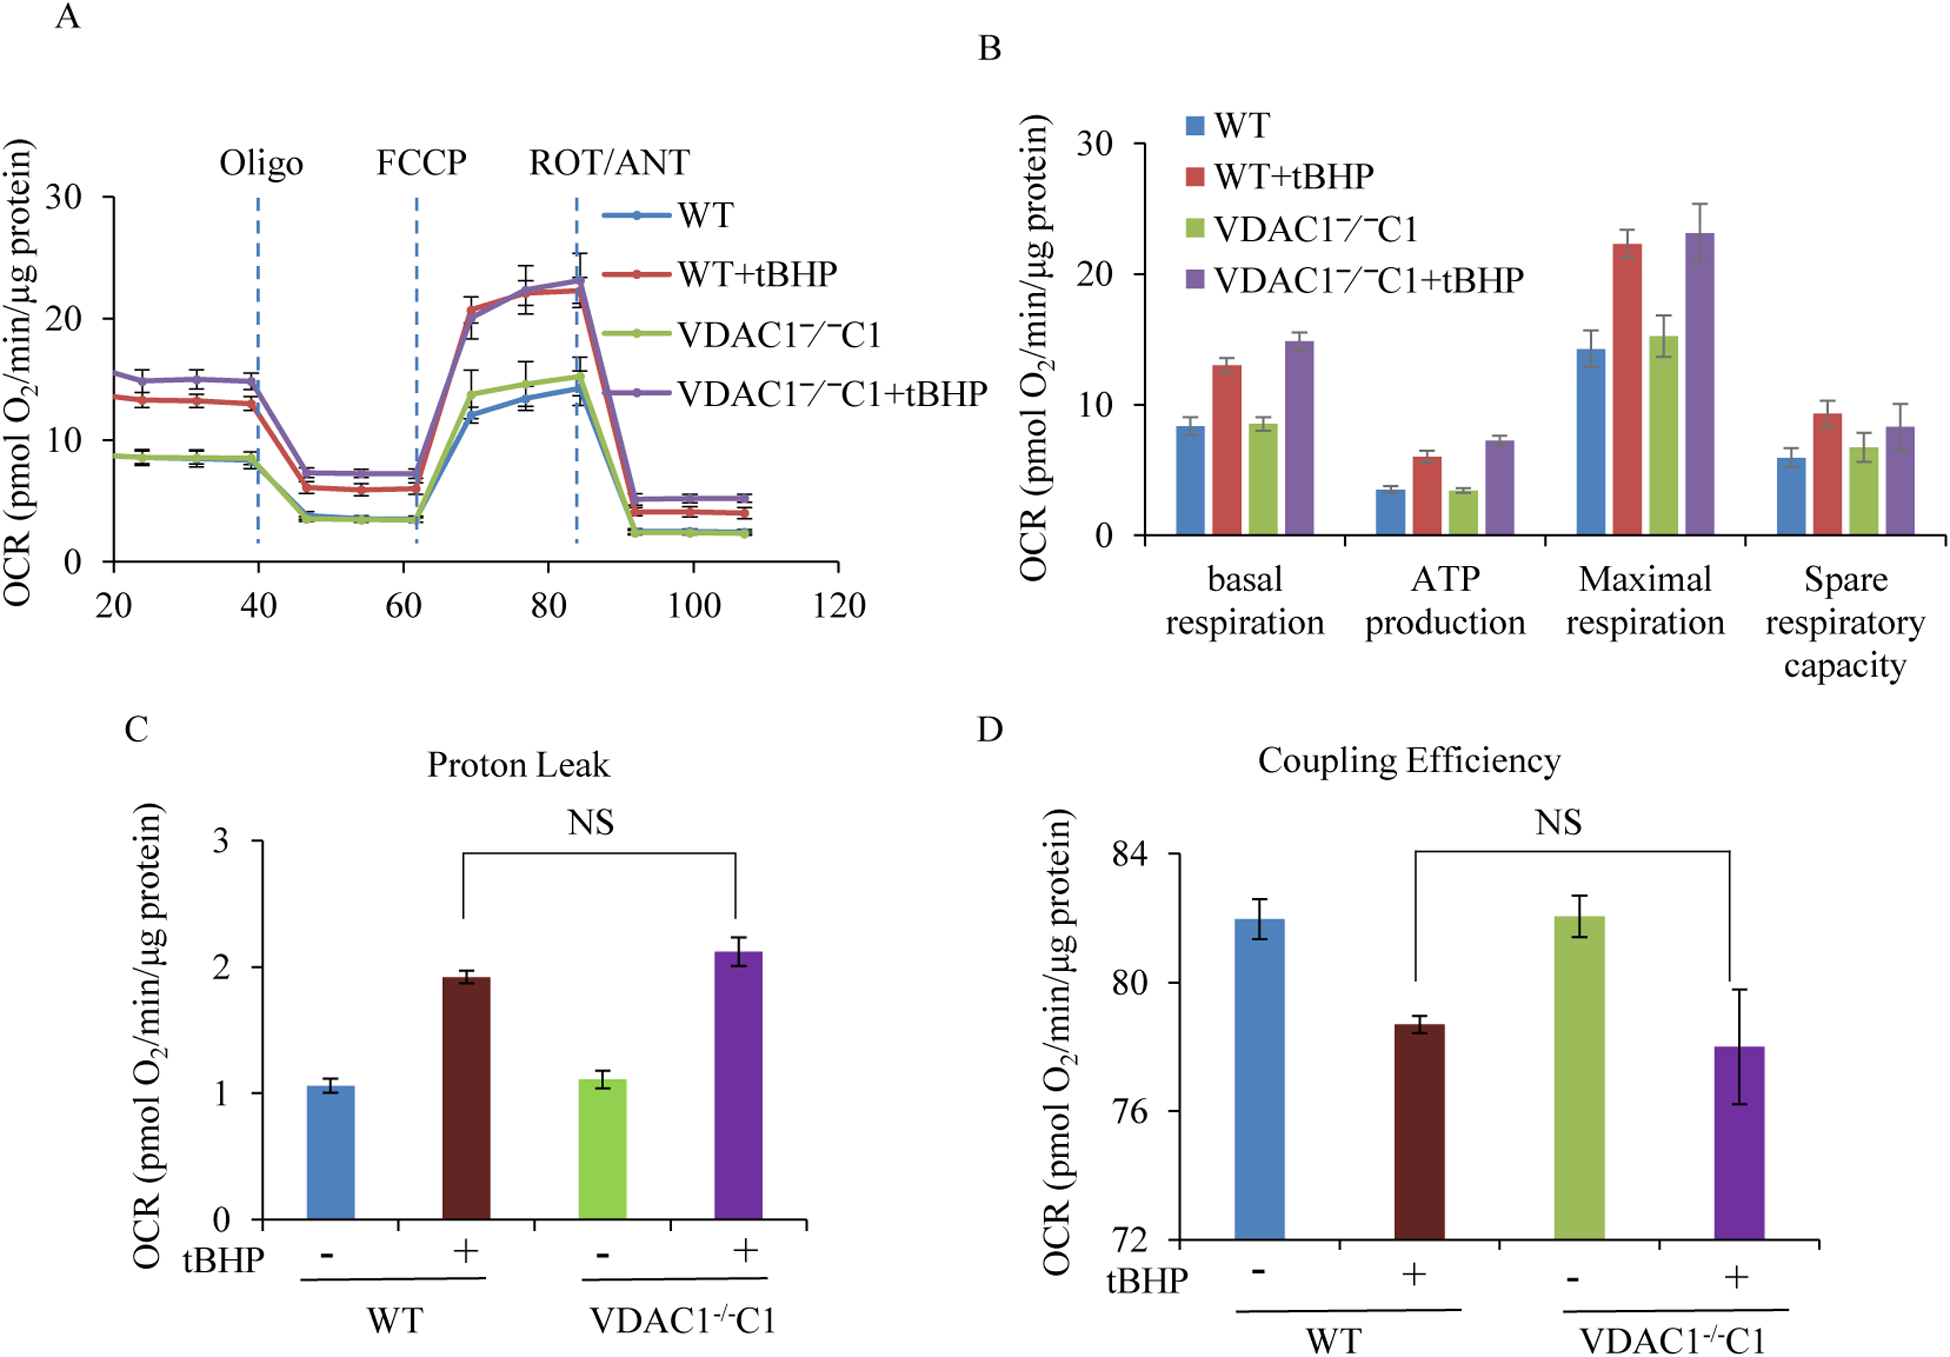
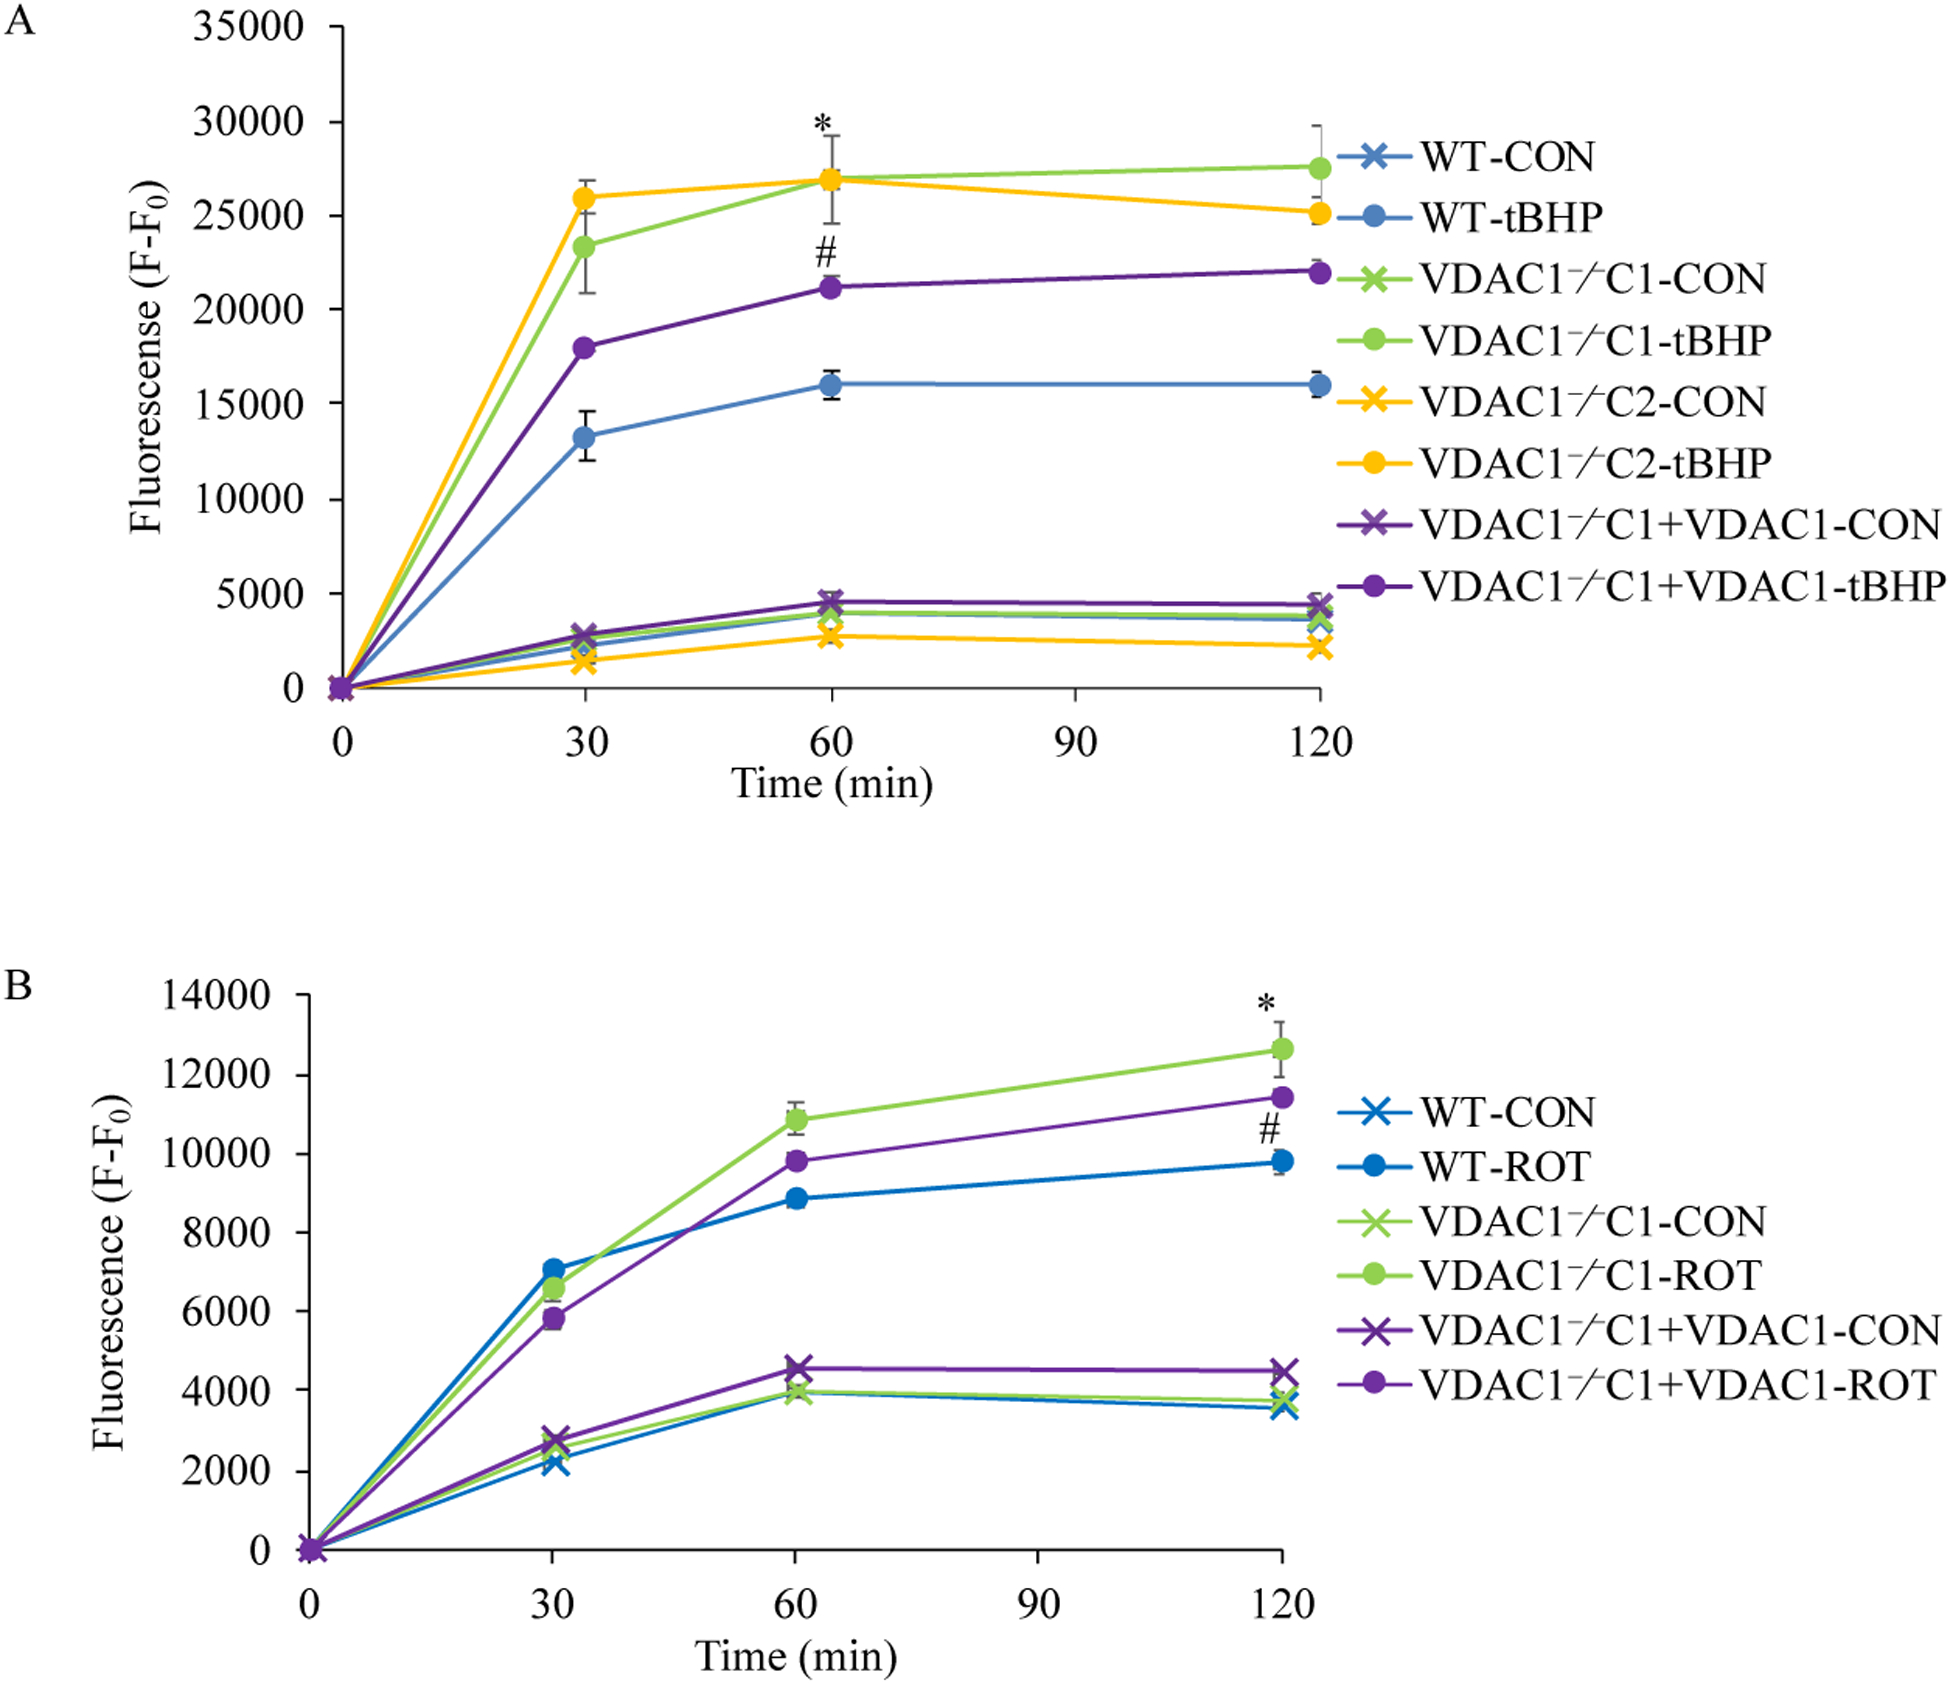
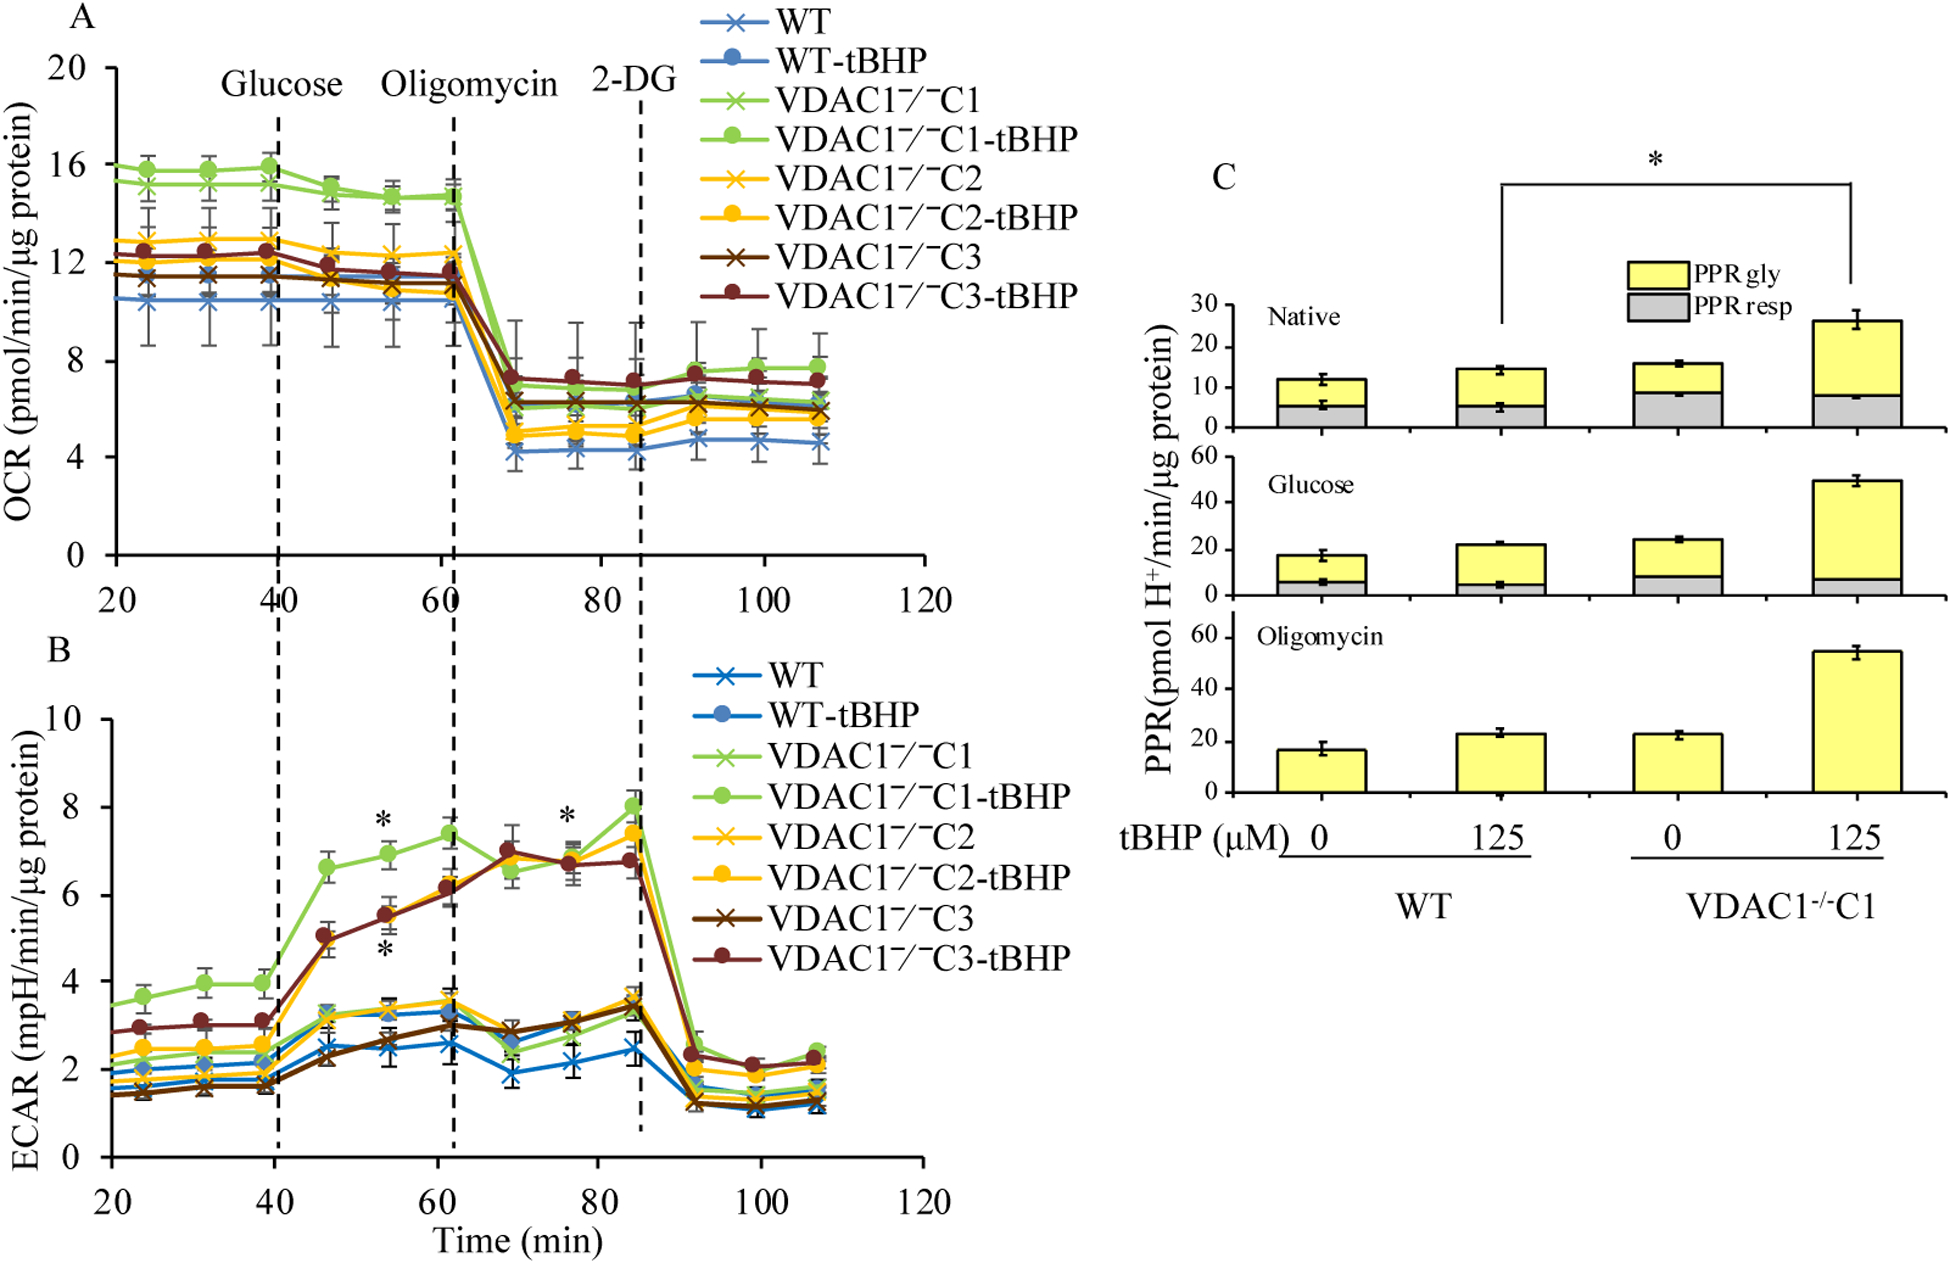
Methods: We knocked out VDAC1 in this rat cardiomyoblast cell line with CRISPR-Cas9 genome editing technique to produce VDAC1-/- H9c2 cells, and determined if VDAC1 is critical in promoting cell death via oxidative stress induced by tert-butylhydroperoxide (tBHP), an organic peroxide, or rotenone (ROT), an inhibitor of mitochondrial complex I by measuring cell viability with MTT assay, cell death with TUNEL stain and LDH release. The mitochondrial and glycolytic stress were examined by measuring O2 consumption rate (OCR) and extracellular acidification rate (ECAR) with a Seahorse XFp analyzer.
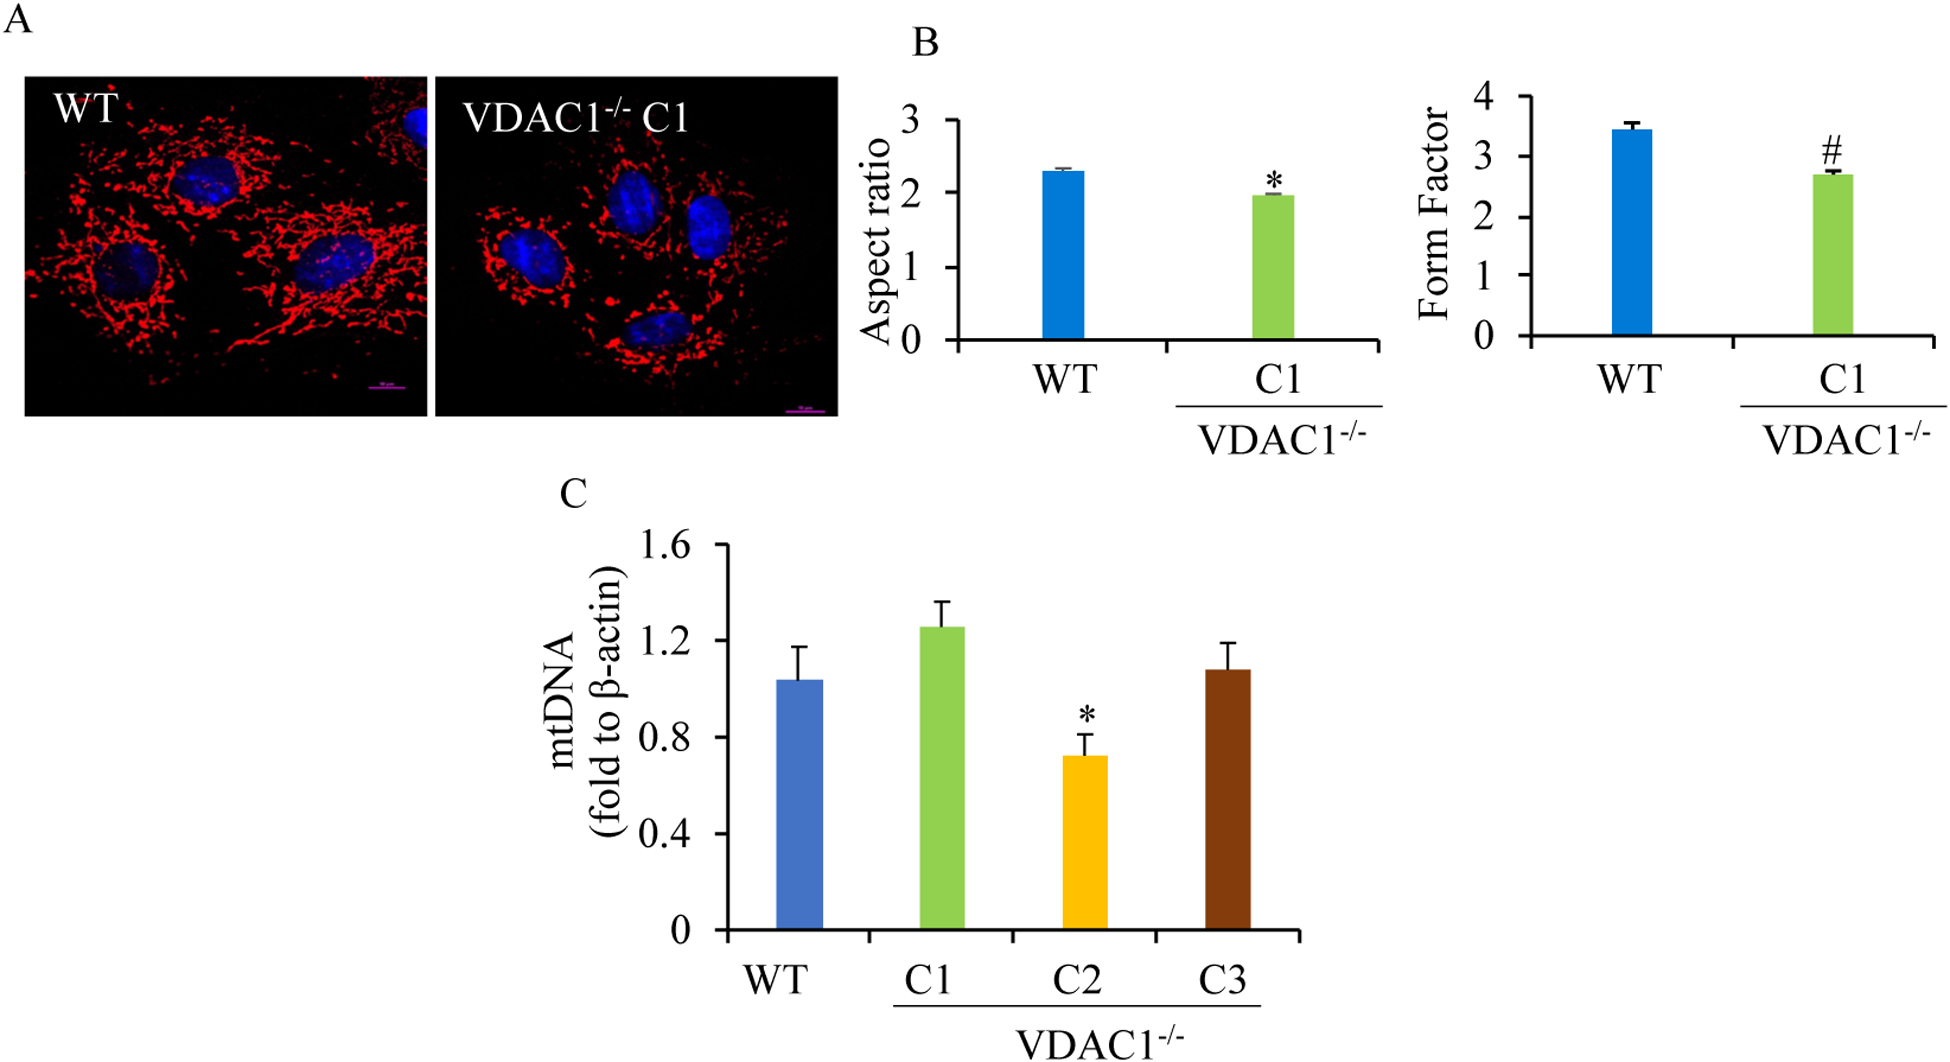
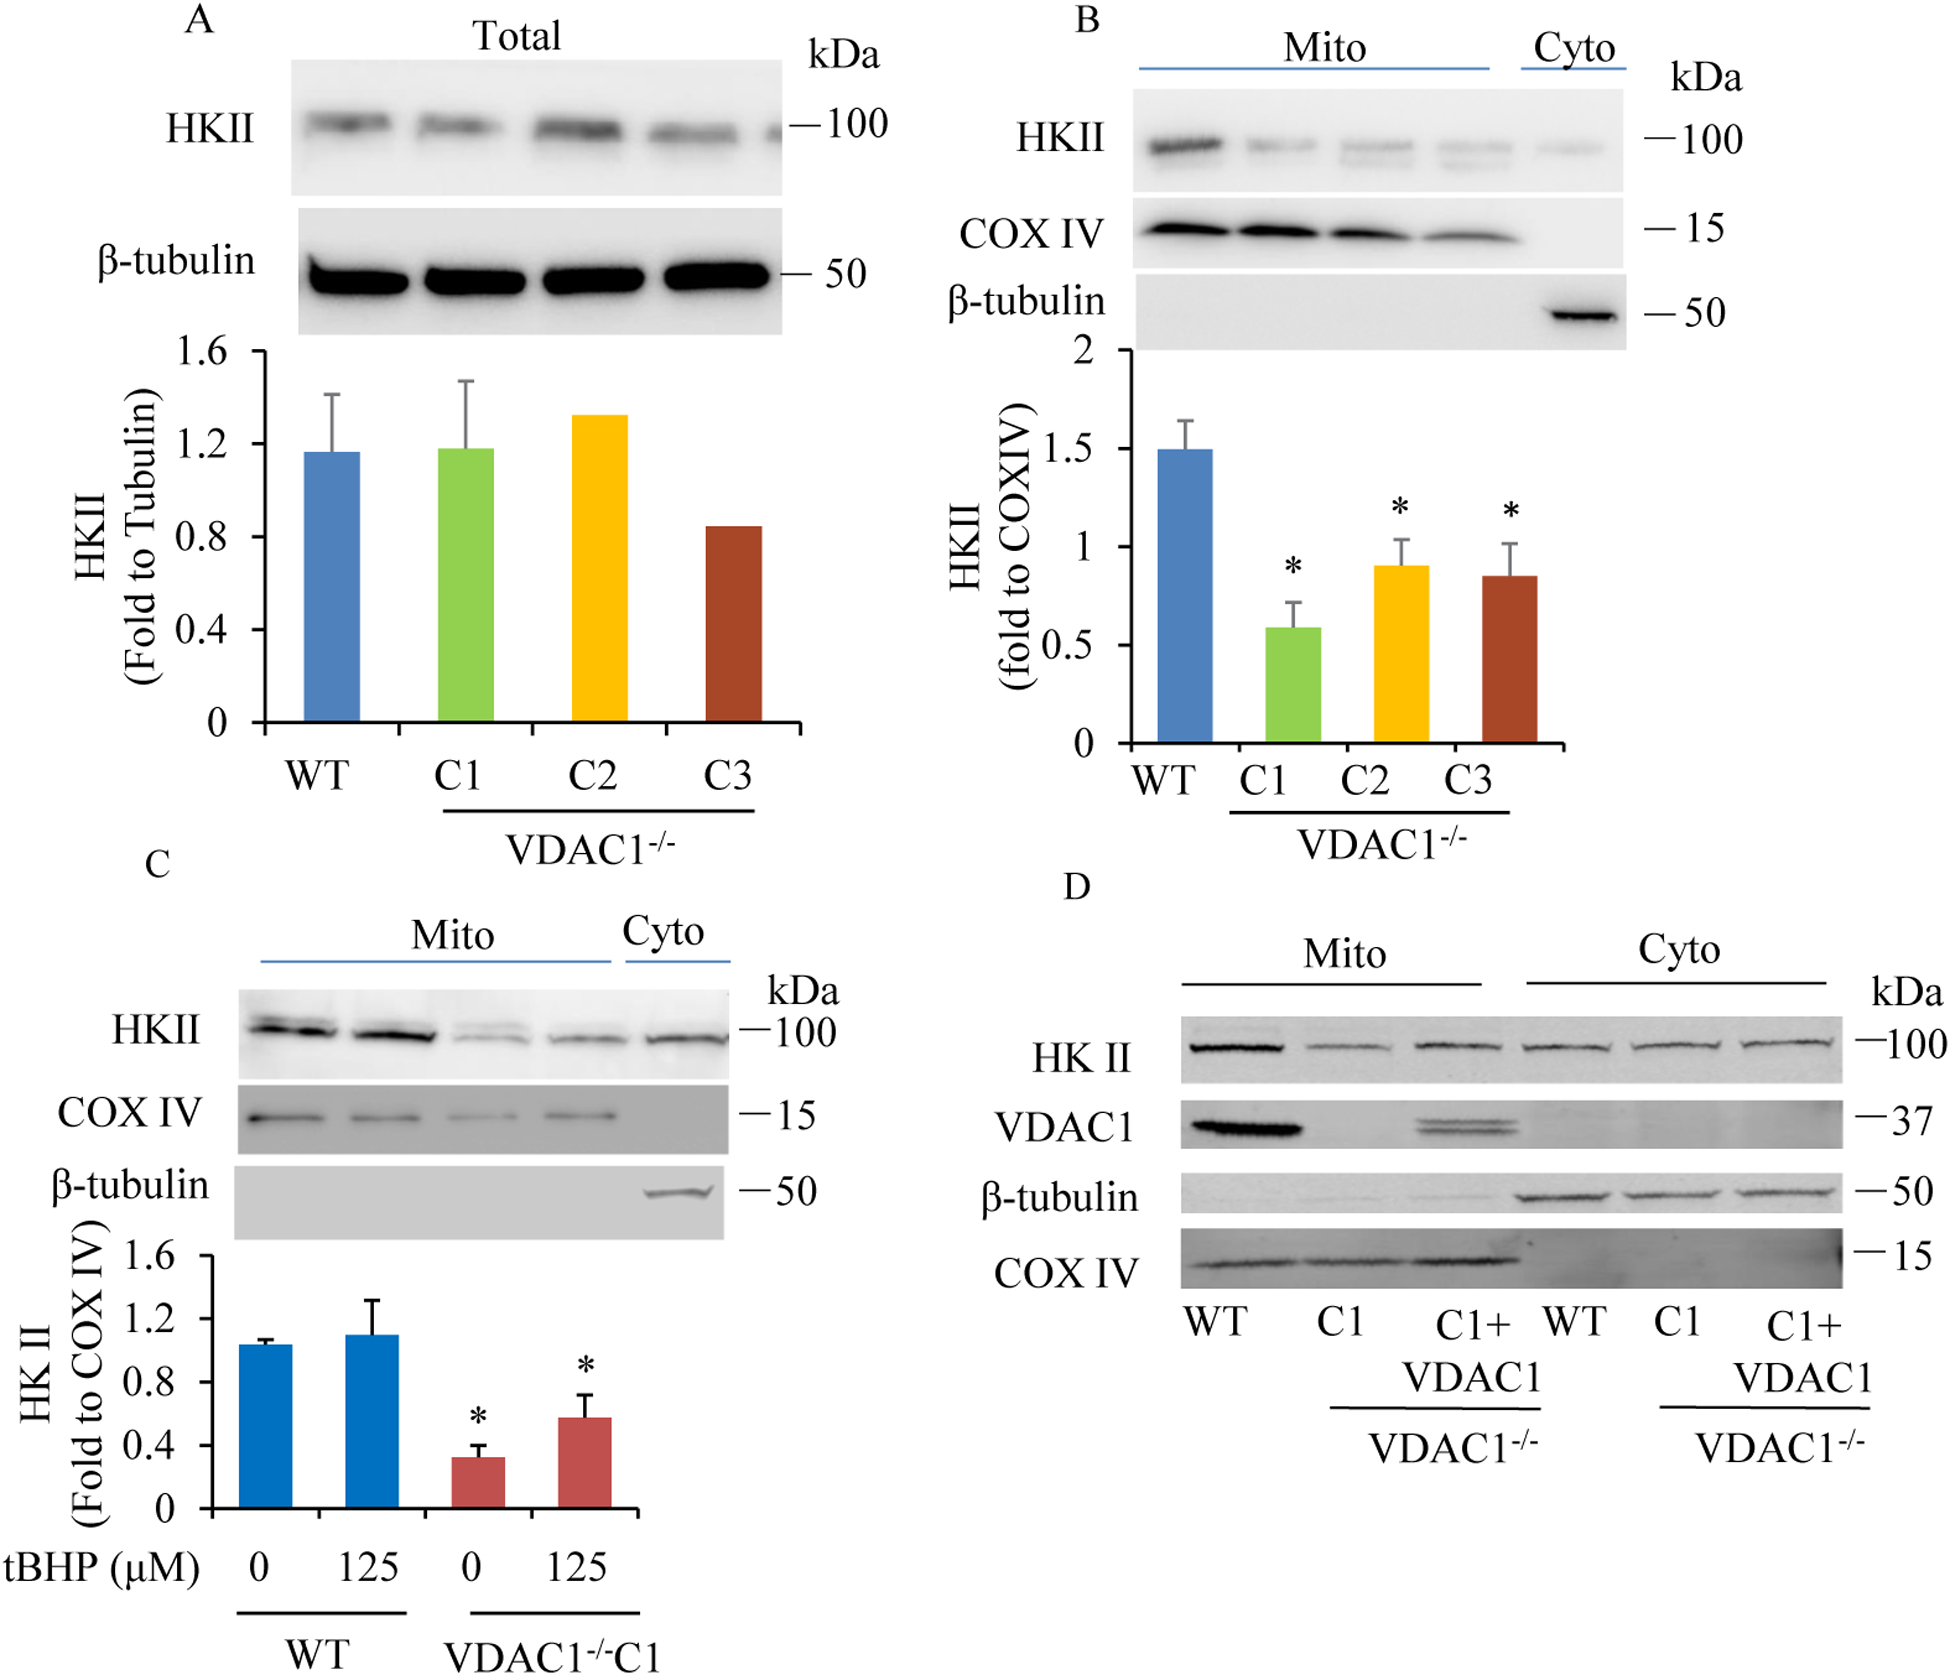
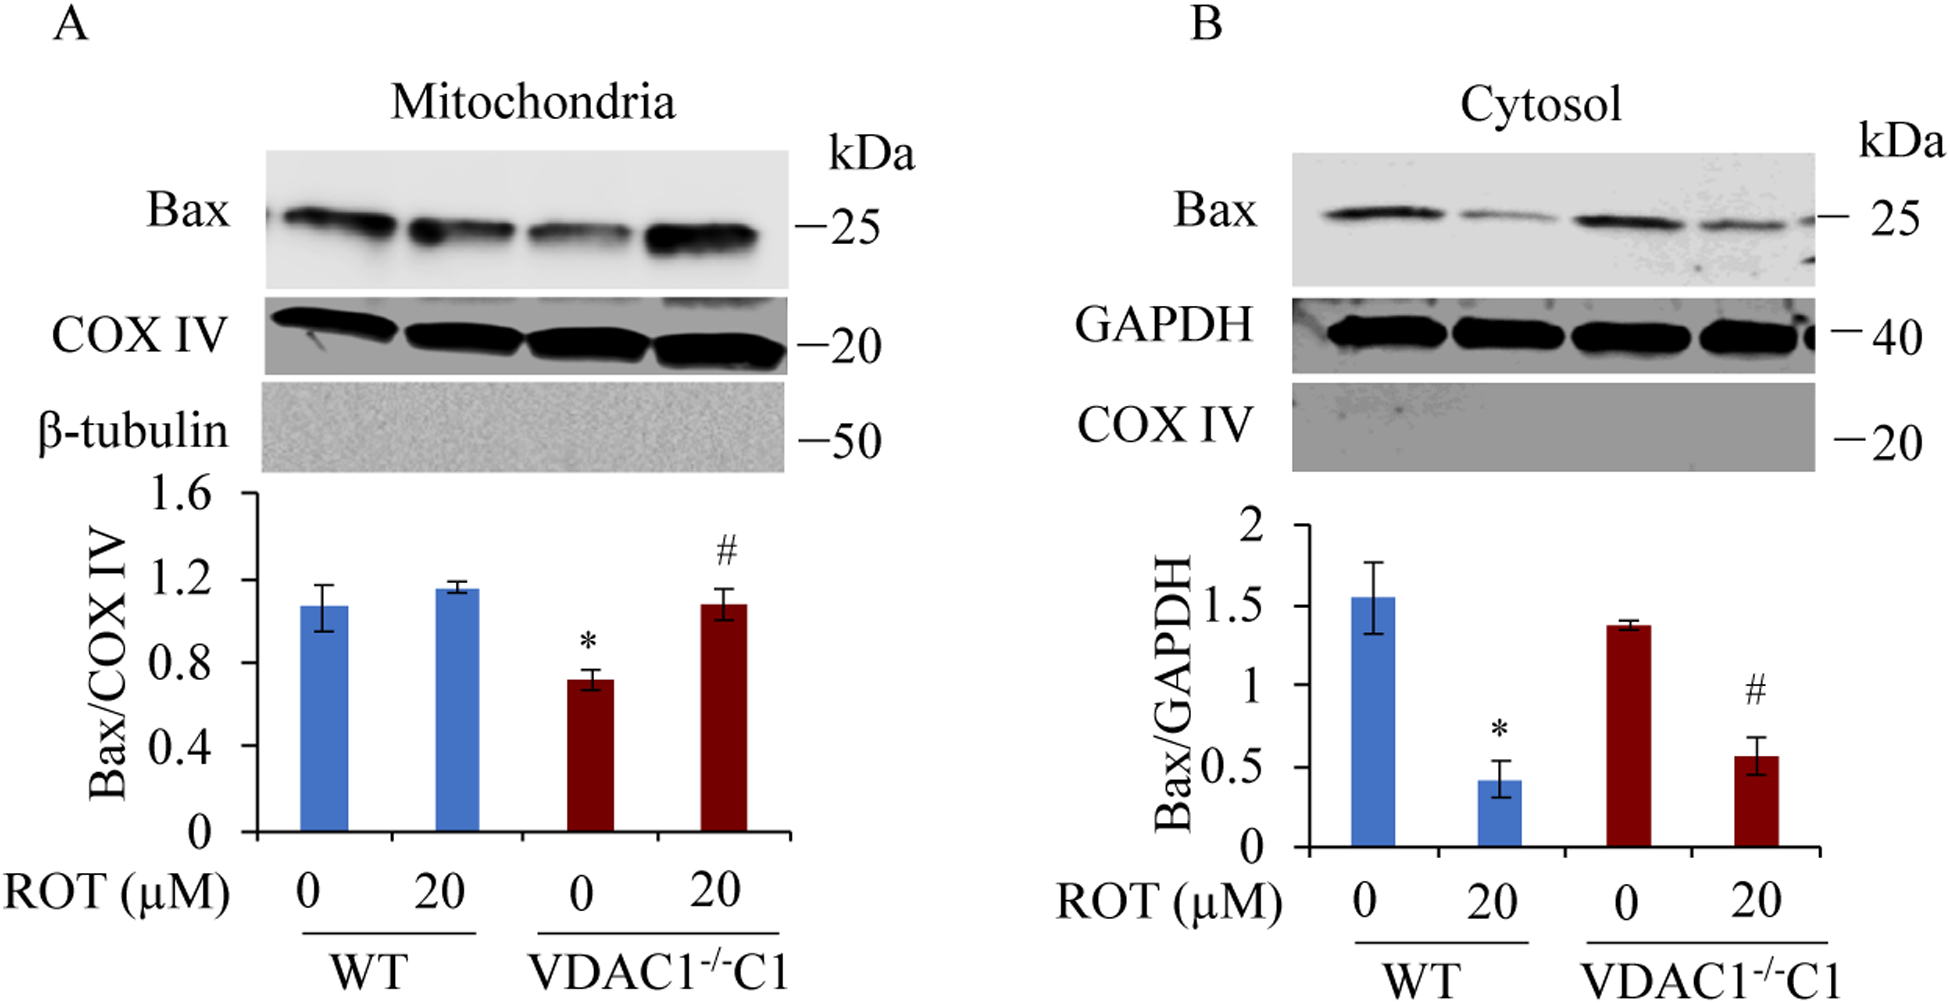
Results: We found that under control conditions, VDAC1-/- did not affect H9c2 cell proliferation or mitochondrial respiration. However, compared to the wildtype (WT) cells, exposure to either tBHP or ROT enhanced the production of ROS, ECAR, and the proton (H+) production rate (PPR) from glycolysis, as well as promoted apoptotic cell death in VDAC1-/- H9c2 cells. VDAC1-/- H9c2 cells also exhibited markedly reduced mitochondria-bound hexokinase II (HKII) and Bax. Restoration of VDAC1 in VDAC1-/- H9c2 cells reinstated mitochondria-bound HKII and concomitantly decreased tBHP and ROT-induced ROS production and cell death. Interestingly, mitochondrial respiration remained the same after tBHP treatment in VDAC1-/- and WT H9c2 cells.
Conclusion: Our results suggest that VDAC1-/- in H9c2 cells enhances oxidative stress-mediated cell apoptosis that is directly linked to the reduction of mitochondria-bound HKII and concomitantly associated with enhanced ROS production, ECAR, and PPR.
Keywords: VDAC1 knockout; Oxidative stress; Mitochondria-bound hexokinase II; Extracellular acidification; Cell death/apoptosis; Bax.
© Copyright by the Author(s). Published by Cell Physiol Biochem Press.
Conflict of interest statement
The authors have nothing to disclose concerning any conflict of interest.
Figures
Similar articles
-
The mitochondrial voltage-dependent anion channel 1 in tumor cells.Biochim Biophys Acta. 2015 Oct;1848(10 Pt B):2547-75. doi: 10.1016/j.bbamem.2014.10.040. Epub 2014 Nov 4. Biochim Biophys Acta. 2015. PMID: 25448878 Review.
-
Peroxynitrite nitrates adenine nucleotide translocase and voltage-dependent anion channel 1 and alters their interactions and association with hexokinase II in mitochondria.Mitochondrion. 2019 May;46:380-392. doi: 10.1016/j.mito.2018.10.002. Epub 2018 Nov 1. Mitochondrion. 2019. PMID: 30391711 Free PMC article.
-
The Voltage-dependent Anion Channel 1 Mediates Amyloid β Toxicity and Represents a Potential Target for Alzheimer Disease Therapy.J Biol Chem. 2015 Dec 25;290(52):30670-83. doi: 10.1074/jbc.M115.691493. Epub 2015 Nov 5. J Biol Chem. 2015. PMID: 26542804 Free PMC article.
-
Structural basis of complex formation between mitochondrial anion channel VDAC1 and Hexokinase-II.Commun Biol. 2021 Jun 3;4(1):667. doi: 10.1038/s42003-021-02205-y. Commun Biol. 2021. PMID: 34083717 Free PMC article.
-
VDAC1 functions in Ca2+ homeostasis and cell life and death in health and disease.Cell Calcium. 2018 Jan;69:81-100. doi: 10.1016/j.ceca.2017.06.007. Epub 2017 Jun 23. Cell Calcium. 2018. PMID: 28712506 Review.
Cited by
-
Hypothermia Prevents Cardiac Dysfunction during Acute Ischemia Reperfusion by Maintaining Mitochondrial Bioenergetics and by Promoting Hexokinase II Binding to Mitochondria.Oxid Med Cell Longev. 2022 Jul 13;2022:4476448. doi: 10.1155/2022/4476448. eCollection 2022. Oxid Med Cell Longev. 2022. PMID: 35873800 Free PMC article.
-
Mitochondria-specific peptide amphiphiles induce mitochondrial dysfunction and peripheral T-cell lymphomas (PTCL) damage.Ann Transl Med. 2022 May;10(10):570. doi: 10.21037/atm-22-2233. Ann Transl Med. 2022. PMID: 35722364 Free PMC article.
-
Dapagliflozin attenuates cholesterol overloading-induced injury in mice hepatocytes with type 2 diabetes mellitus (T2DM) via eliminating oxidative damages.Cell Cycle. 2022 Mar-Mar;21(6):641-654. doi: 10.1080/15384101.2022.2031429. Epub 2022 Jan 31. Cell Cycle. 2022. PMID: 35100086 Free PMC article.
-
Pharmacological Cardioprotection against Ischemia Reperfusion Injury-The Search for a Clinical Effective Therapy.Cells. 2023 May 20;12(10):1432. doi: 10.3390/cells12101432. Cells. 2023. PMID: 37408266 Free PMC article. Review.
-
Mitochondrial Kinase Signaling for Cardioprotection.Int J Mol Sci. 2024 Apr 19;25(8):4491. doi: 10.3390/ijms25084491. Int J Mol Sci. 2024. PMID: 38674076 Free PMC article. Review.
References
-
- Shoshan-Barmatz V, Ben-Hail D: VDAC, a multi-functional mitochondrial protein as a pharmacological target. Mitochondrion 2012;12:24–34. - PubMed
MeSH terms
Substances
Grants and funding
LinkOut - more resources
Full Text Sources
Research Materials
Miscellaneous