. 2020 Nov 16;69(5):919-926.
doi: 10.33549/physiolres.934460. Epub 2020 Sep 9.

Effect of methylprednisolone on experimental brain edema in magnetic resonance imaging

Affiliations

Effect of methylprednisolone on experimental brain edema in magnetic resonance imaging

P Kozler et al. Physiol Res. .

Abstract

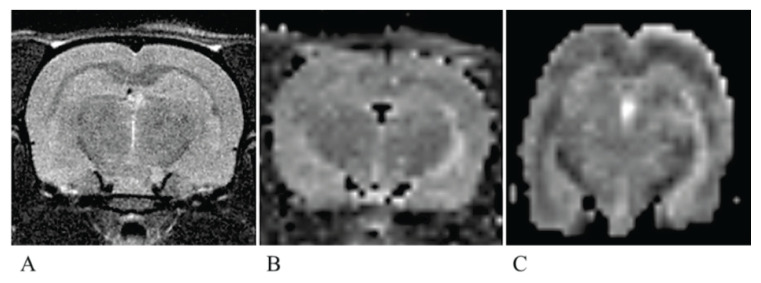
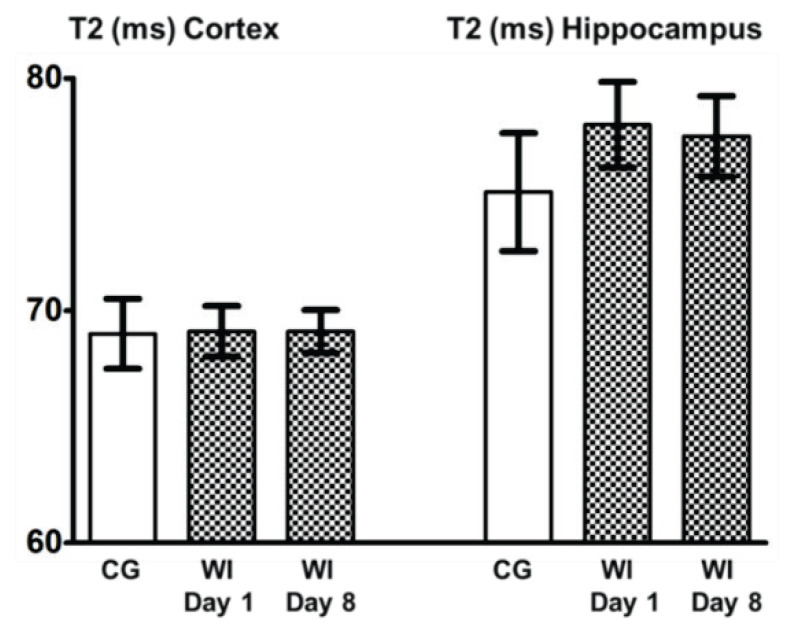
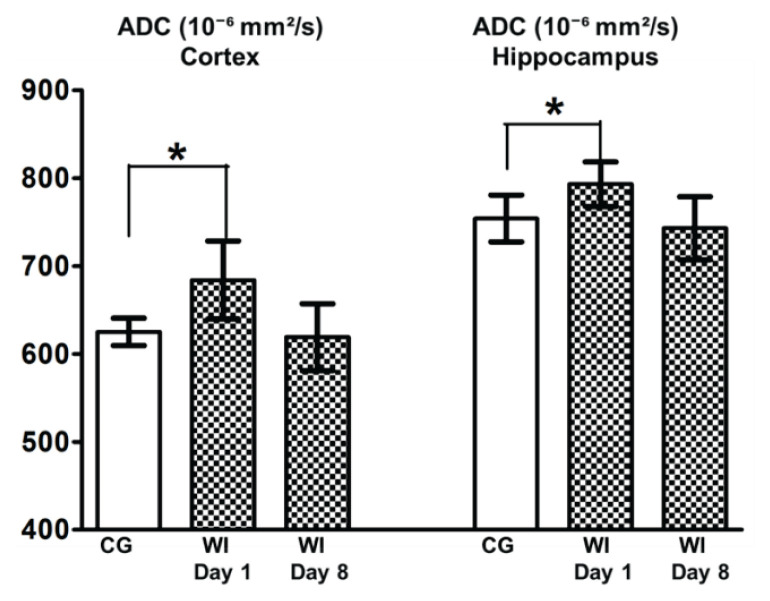
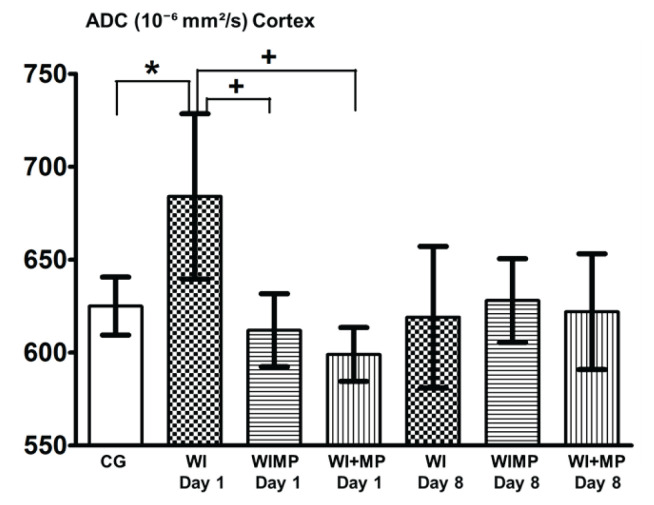
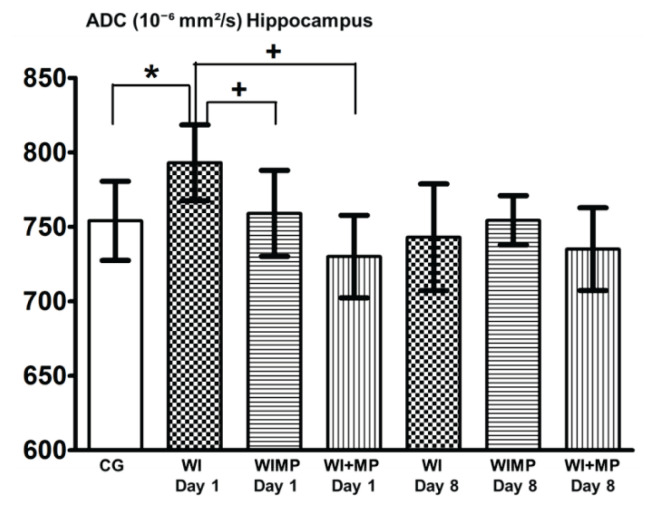
Magnetic resonance imaging has been used for evaluating of a brain edema in experimental animals to assess cytotoxic and vasogenic edema by the apparent diffusion coefficient (ADC) and T2 imaging. This paper brings information about the effectiveness of methylprednisolone (MP) on experimental brain edema. A total of 24 rats were divided into three groups of 8 animals each. Rats with cytotoxic/intracellular brain edema induced by water intoxication were assigned to the group WI. These rats also served as the additional control group CG when measured before the induction of edema. A third group (WIMP) was intraperitoneally administered with methylprednisolone 100 mg/kg during water intoxication treatment. The group WI+MP was injected with methylprednisolone 50 mg/kg into the carotid artery within two hours after the water intoxication treatment. We evaluated the results in four groups. Two control groups (CG, WI) and two experimental groups (WIMP, WI+MP). Rats were subjected to MR scanning 24 h after edema induction. We observed significantly increased ADC values in group WI in both evaluated areas - cortex and hippocampus, which proved the occurrence of experimental vasogenic edema, while ADC values in groups WIMP and WI+MP were not increased, indicating that the experimental edema was not developed and thus confirming the protective effect of MP.


Conflict of interest statement

Conflict of Interest

There is no conflict of interest.

Figures

Fig. 1
Fig. 1
A typical T2-weighted image, T2 map and ADC map. A typical T2-weighted image (A) of the rat brain showing the evaluated slice. (B) T2 map (interpolated), (C) ADC map (interpolated). Note geometrical distortions of the ADC map caused by magnetic field inhomogeneities in combination with EPI k-space acquisition.
Fig. 2
Fig. 2
T2 values after water intoxication. Columns with average value ± SEM, white columns: control group (intact animals, no WI), checkered columns: groups after edema induction by WI – WI Day 1, WI Day 8.
Fig. 3
Fig. 3
ADC values after water intoxication. Columns with average value ± SEM, white columns: control group (intact animals, no WI), checkered columns: groups after edema induction by WI – WI Day 1, WI Day 8, *=p<0.05.
Fig. 4
Fig. 4
ADC values in cortex. Legend: columns with average value ± SD, white columns: control group (intact animals, no WI), checkered columns: groups after edema induction by WI – WI Day 1, WI Day 8, horizontally striped columns: groups WIMP Day 1, Day 8 – edema induction by WI and MP administration intraperitoneally, vertically striped columns: groups WI+MP Day 1, Day 8 – edema induction by WI and MP administration into carotid artery. (*) denotes statistically significant difference (p<0.05) from CG group, (+) denotes statistically significant difference (p<0.05) from WI group at the same time interval.
Fig. 5
Fig. 5
ADC values in hippocampus. Columns with average value ± SD, white columns: control group (intact animals, no WI), checkered columns: groups after edema induction by WI – WI Day 1, WI Day 8, horizontally striped columns: groups WIMP Day 1, Day 8 – edema induction by WI and MP administration intraperitoneally, vertically striped columns: groups WI+MP Day 1, Day 8 – edema induction by WI and MP administration into carotid artery. (*) denotes statistically significant difference (p<0.05) from CG group, (+) denotes statistically significant difference (p<0.05) from WI group at the same time interval.

References

    1. AYATA C, ROPPER AH. Ischaemic brain oedema. J Clin Neurosci. 2002;9:113–124. doi: 10.1054/jocn.2001.1031. - DOI - PubMed
    1. BADAUT J, ASHWAL S, TONE B, REGLI L, TIAN HR, OBENAUS A. Temporal and regional evolution of aquaporin-4 expression and magnetic resonance imaging in a rat pup model of neonatal stroke. Pediatr Res. 2007;62:248–254. doi: 10.1203/pdr.0b013e3180db291b. - DOI - PubMed
    1. BATTEY TW, KARKI M, SINGHAL AB, WU O, SADAGHIANI S, CAMPBELL BC, DAVIS SM, DONNAN GA, SHETH KN, KIMBERLY WT. Brain edema predicts outcome after nonlacunar ischemic stroke. Stroke. 2014;45:3643–3648. doi: 10.1161/strokeaha.114.006884. - DOI - PMC - PubMed
    1. BULLOCK MR, LYETH BG, MUIZELAAR JP. Current status of neuroprotection trials for traumatic brain injury: lessons from animal models and clinical studies. Neurosurgery. 1999;45:207–220. doi: 10.1097/00006123-199908000-00001. - DOI - PubMed
    1. FADEN AI, SALZMAN S. Pharmacological strategies in CNS trauma. Trends Pharmacol Sci. 1992;13:29–35. doi: 10.1016/0165-6147(92)90013-v. - DOI - PubMed

Substances