

Cost of Dengue Illness in Indonesia across Hospital, Ambulatory, and not Medically Attended Settings
- PMID: 32901596
- PMCID: PMC7646801
- DOI: 10.4269/ajtmh.19-0855
Cost of Dengue Illness in Indonesia across Hospital, Ambulatory, and not Medically Attended Settings
Abstract
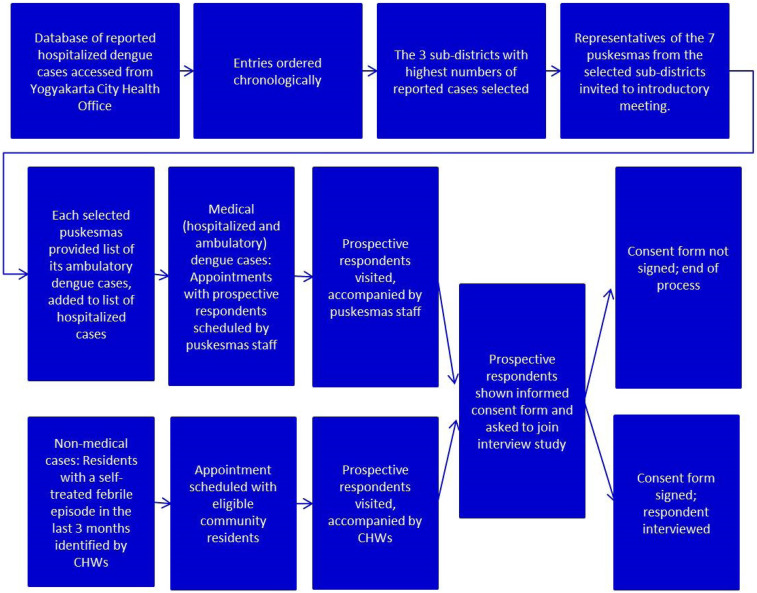
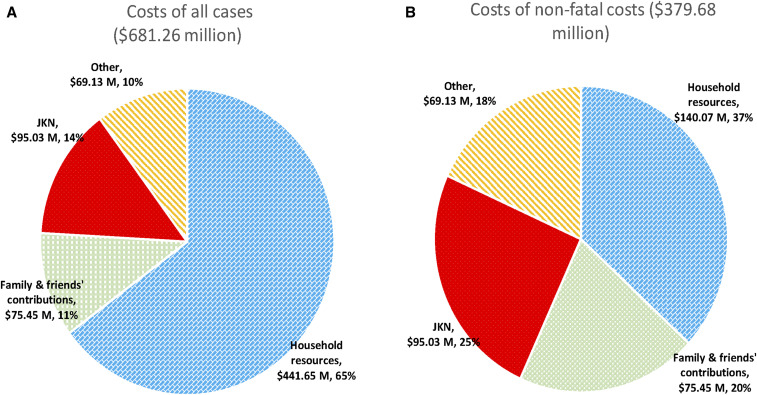
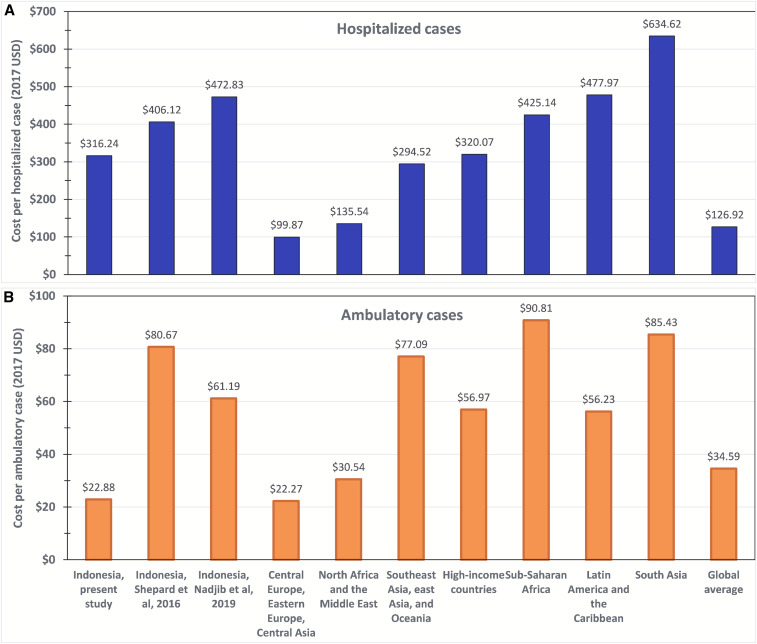
Informed decisions concerning emerging technologies against dengue require knowledge about the disease's economic cost and each stakeholder's potential benefits from better control. To generate such data for Indonesia, we reviewed recent literature, analyzed expenditure and utilization data from two hospitals and two primary care facilities in Yogyakarta city, and interviewed 67 dengue patients from hospital, ambulatory, and not medically attended settings. We derived the cost of a dengue episode by outcome, setting, and the breakdown by payer. We then calculated aggregate Yogyakarta and national costs and 95% uncertainty intervals (95% UIs). Dengue costs per nonfatal case in hospital, ambulatory, not medically attended, and overall average settings were US$316.24 (95% UI: $242.30-$390.18), US$22.45 (95% UI: $14.12-$30.77), US$7.48 (95% UI: $2.36-$12.60), and US$50.41 (95% UI: $35.75-$65.07), respectively. Costs of nonfatal episodes were borne by the patient's household (37%), social contributors (relatives and friends, 20%), national health insurance (25%), and other sources (government, charity, and private insurance, 18%). After including fatal cases, the average cost per episode became $90.41 (95% UI: $72.79-$112.35). Indonesia had an estimated 7.535 (95% UI: 1.319-16.513) million dengue episodes in 2017, giving national aggregate costs of $681.26 (95% UI: $232.28-$2,371.56) million. Unlike most previous research that examined only the formal medical sector, this study included the estimated 63% of national dengue episodes that were not medically attended. Also, this study used actual costs, rather than charges, which generally understate dengue's economic burden in public facilities. Overall, this study found that Indonesia's aggregate cost of dengue was 73% higher than previously estimated, strengthening the need for effective control.
Conflict of interest statement
Disclosure: The funders had no role in study design, data collection and analysis, decision to publish, or preparation of the manuscript. D. S. S. has received funding from Sanofi Pasteur and Takeda Vaccines for research on dengue, but it is not related to Indonesia or to this study.
Figures
References
-
- Shepard DS, Undurraga EA, Halasa YA, Stanaway JD, 2016. The global economic burden of dengue: a systematic analysis. Lancet Infect Dis 16: 935–941. - PubMed
-
- GBD , Disease and Injury Incidence , Prevalence Collaborators , 2018. Global, regional and national incidence, prevalence, and years lived with disability for 354 diseases and injuries in 195 countries and territories, 1990–2017: a systematic analysis for the Global Burden of Disease Study 2017. Lancet Glob Health 392: 1759–1858. - PMC - PubMed
-
- GBD 2017 DALYs , HALE Collaborators , 2018. Global, regional, and national disability-adjusted life-years (DALYs) for 359 diseases and injuries and healthy life expectancy (HALE) for 195 countries and territories, 1990–2017: a systematic analysis for the Global Burden of Disease Study 2017. Lancet Glob Health 392: 1859–1922. - PMC - PubMed
-
- Murray CJL, et al. 2012. Disability-adjusted life years (DALYs) for 291 diseases and injuries in 21 regions, 1990–2010: a systematic analysis for the Global Burden of Disease Study 2010. Lancet 380: 2197–2223. - PubMed
Publication types
MeSH terms
Grants and funding
LinkOut - more resources
Full Text Sources
Medical
