. 2020 Nov;34(11):14615-14630.
doi: 10.1096/fj.202001612RR. Epub 2020 Sep 9.

μ-Lat: A mouse model to evaluate human immunodeficiency virus eradication strategies

Affiliations

μ-Lat: A mouse model to evaluate human immunodeficiency virus eradication strategies

Hannah S Sperber et al. FASEB J. 2020 Nov.

Abstract

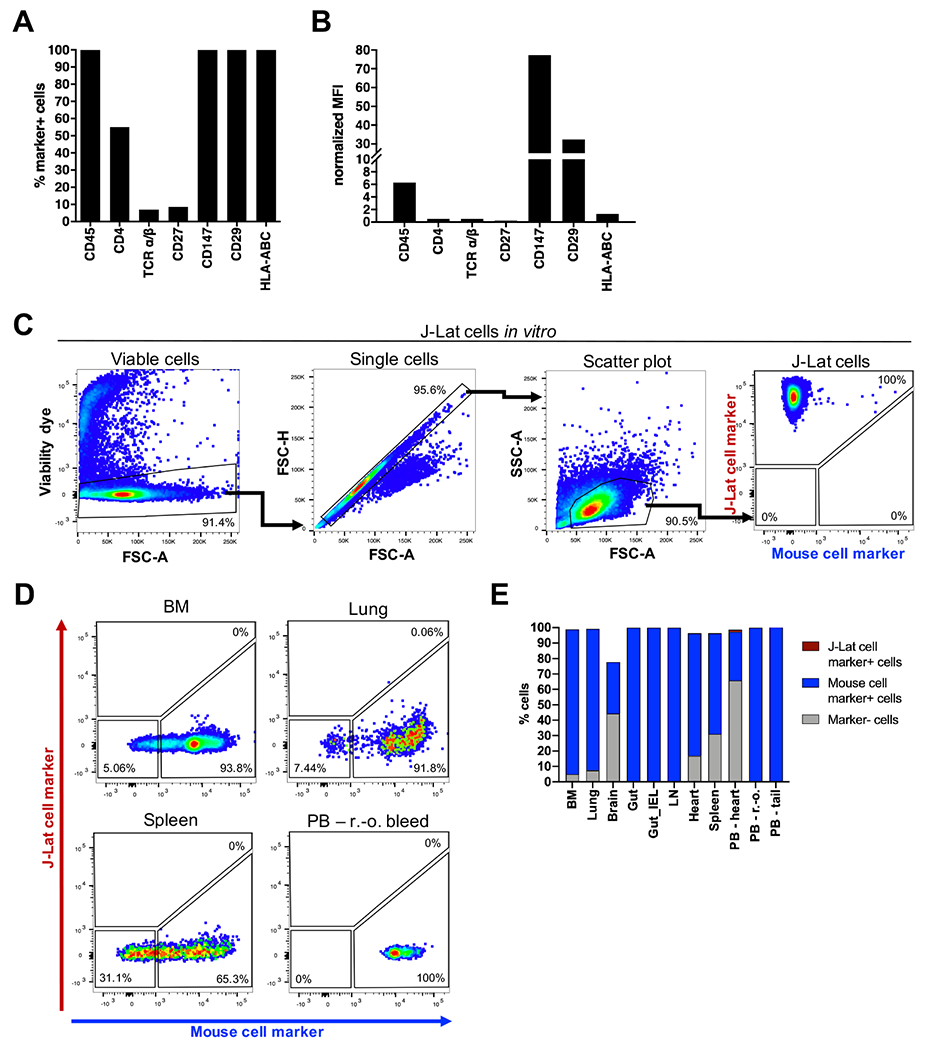
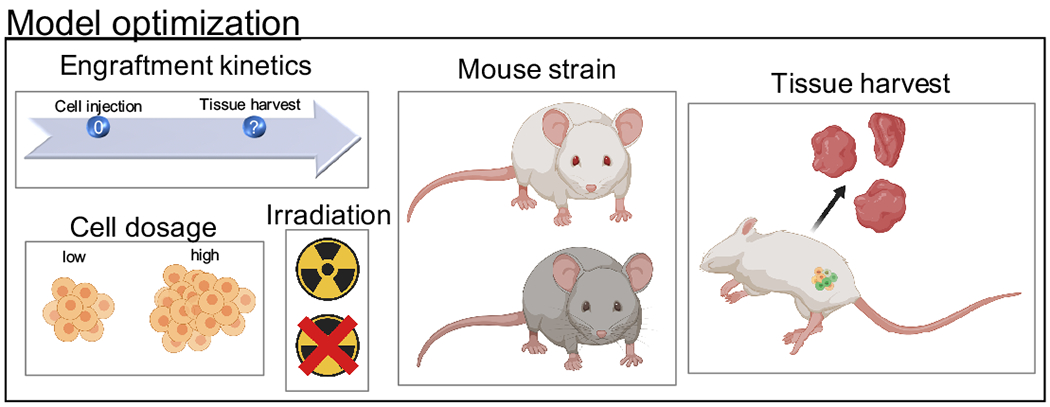
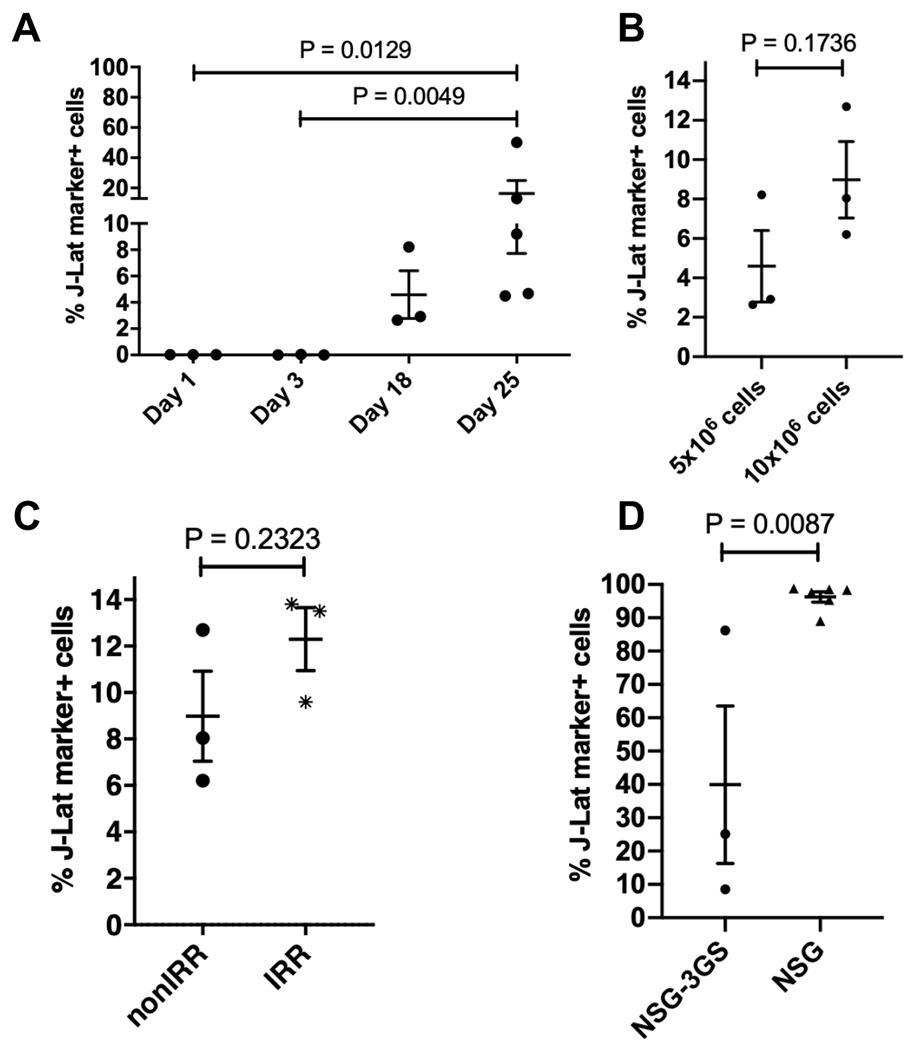
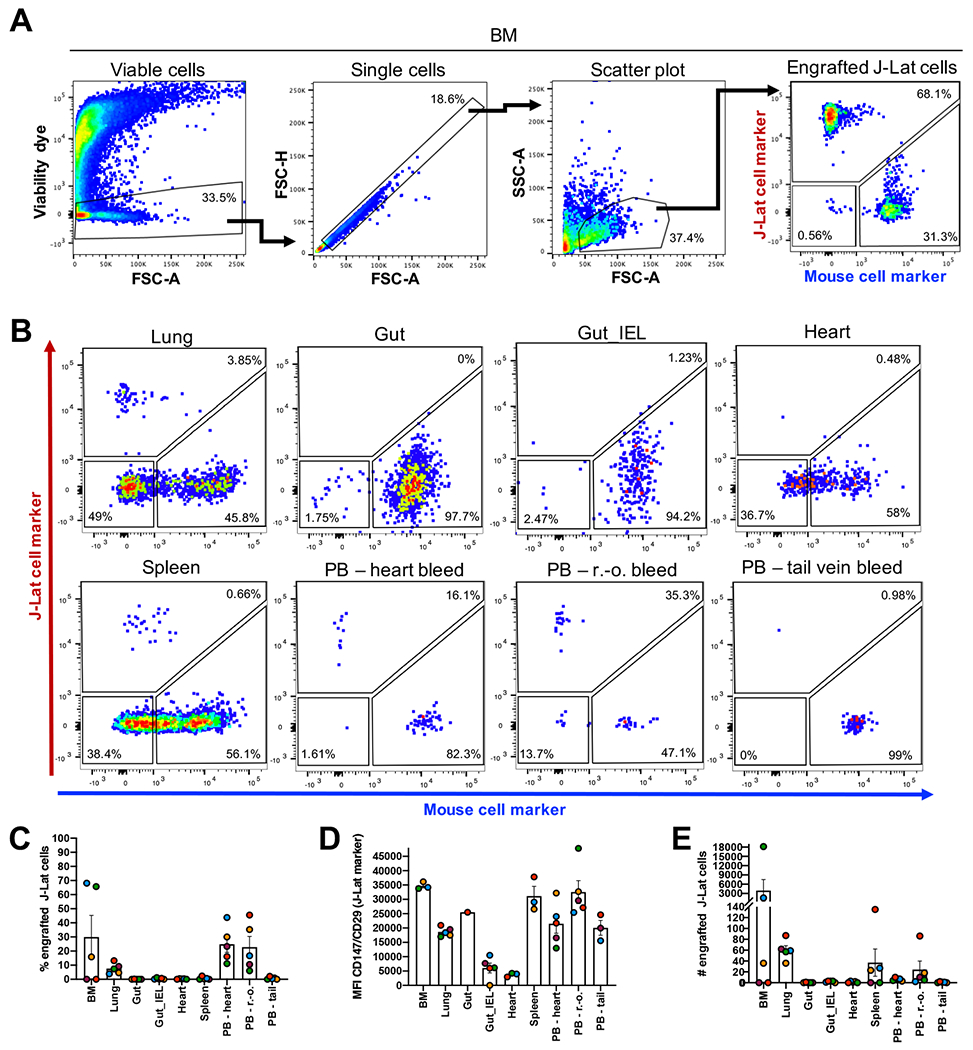
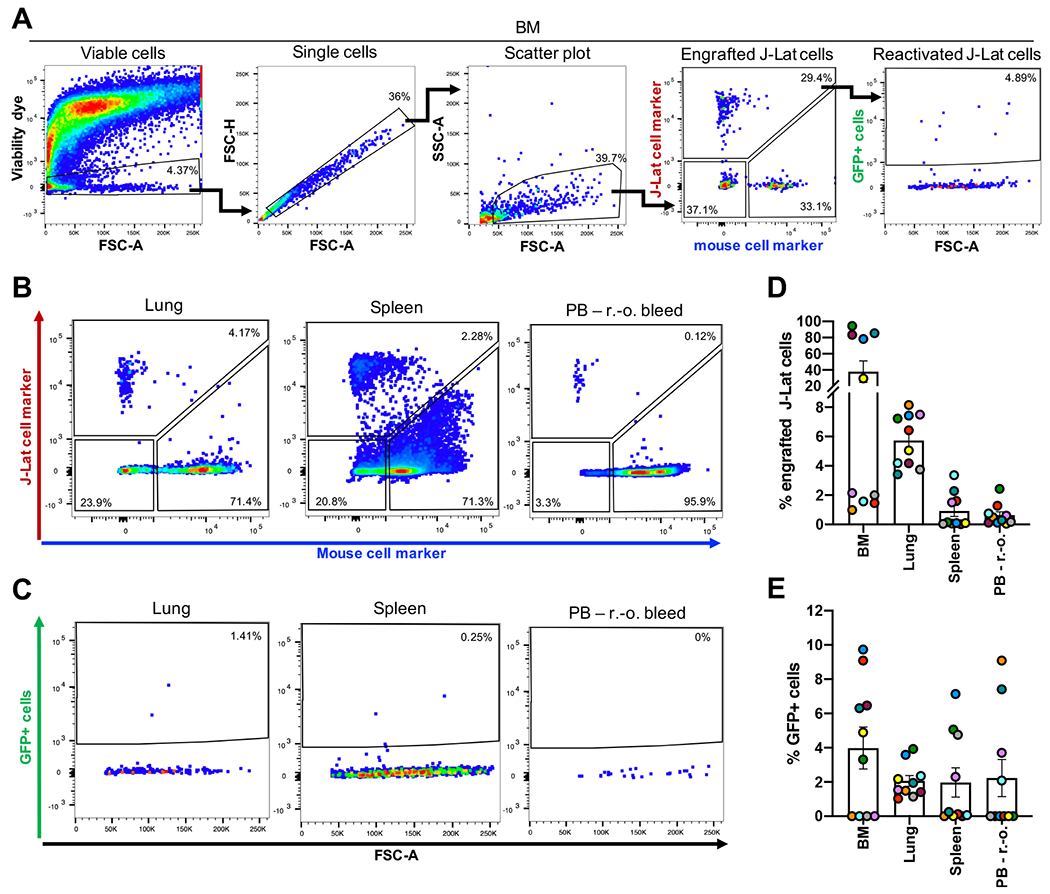
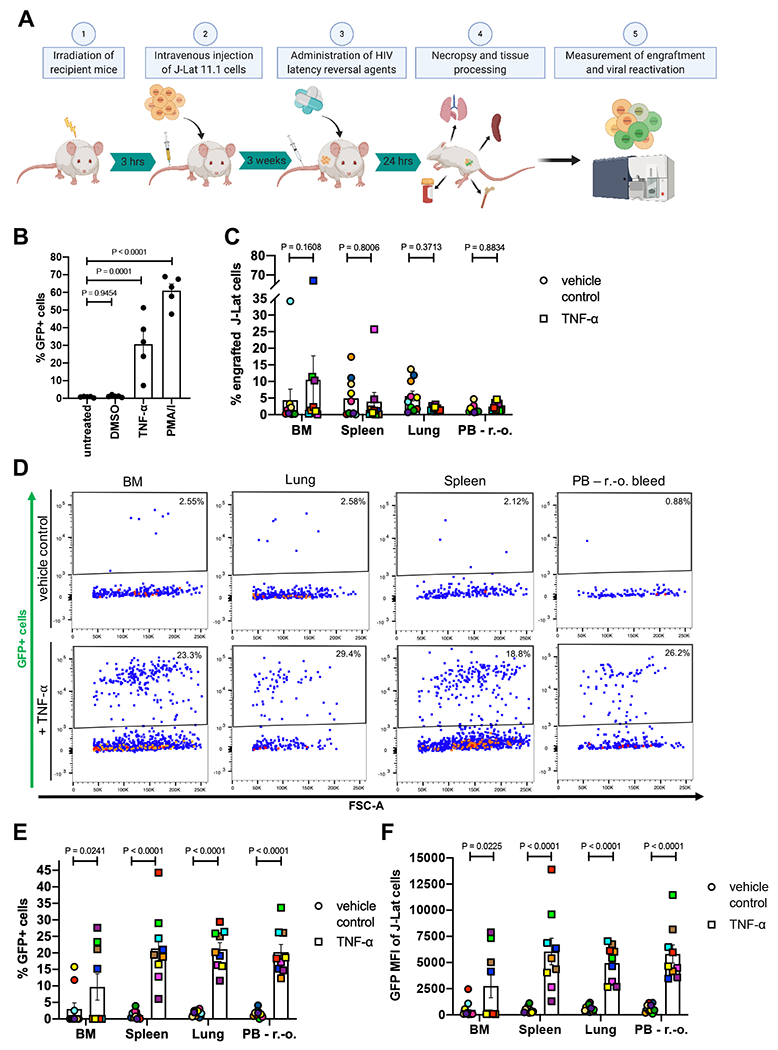
A critical barrier to the development of a human immunodeficiency virus (HIV) cure is the lack of a scalable animal model that enables robust evaluation of eradication approaches prior to testing in humans. We established a humanized mouse model of latent HIV infection by transplanting "J-Lat" cells, Jurkat cells harboring a latent HIV provirus encoding an enhanced green fluorescent protein (GFP) reporter, into irradiated adult NOD.Cg-Prkdcscid Il2rgtm1Wjl /SzJ (NSG) mice. J-Lat cells exhibited successful engraftment in several tissues including spleen, bone barrow, peripheral blood, and lung, in line with the diverse natural tissue tropism of HIV. Administration of tumor necrosis factor (TNF)-α, an established HIV latency reversal agent, significantly induced GFP expression in engrafted cells across tissues, reflecting viral reactivation. These data suggest that our murine latency ("μ-Lat") model enables efficient determination of how effectively viral eradication agents, including latency reversal agents, penetrate, and function in diverse anatomical sites harboring HIV in vivo.

Keywords: HIV; HIV latency; antiviral gene therapy; humanized mouse; latency reversal; shock and kill.


Conflict of interest statement

Conflict of interest statement

The authors have declared that no conflict of interest exists.

Figures

Figure 1:
Figure 1:. The cell surface proteins CD147 and CD29 are abundantly and specifically expressed in J-Lat 11.1 cells.
1 x 10⁶ J-Lat cells were stained with antibodies targeting select cell surface proteins to (A) measure the frequency of marker-positive cells and (B) mean fluorescence intensity (MFI) of proteins on the cell surface using flow cytometry. The MFI of marker signal positive cells was normalized to signal positive cells of respective isotype control stained samples. A representative experiment is summarized in the bar graphs. (C) Gating strategy to identify human J-Lat cells upon multicolor staining with CD147/CD29-APC (J-Lat cell marker) and CD45/TER-119/H-2Kd-Pacific Blue (mouse cell marker) in vitro. (D) Representative flow cytometry plots show multicolor staining of single cell suspensions prepared from different mouse tissues obtained from an untransplanted control animal. Mouse cells were stained, measured, and analyzed in the same way as in vitro J-Lat cells to evaluate specificity and background signal of human CD29 and CD147 antibodies. (E) Single cell suspensions were prepared from 8 mouse tissues and three different harvest methods for peripheral blood (PB) to determine the applicability of the multicolor staining for subsequent engraftment studies. BM = bone marrow, IEL = intraepithelial lymphocytes, LN = lymph node, PB = peripheral blood, r.-o. = retro-orbital.
Figure 2:
Figure 2:. Schematic representation of parameters that were examined and optimized to establish the μ-Lat model.
J-Lat cell engraftment kinetics, J-Lat cell dosage, irradiation of recipient mice, and testing of J-Lat cell engraftment in different mouse strains were investigated.
Figure 3:
Figure 3:. Optimal engraftment levels of J-Lat cells are achieved 3 weeks post injection in irradiated NSG mice using 10 x 106 J-Lat cells for transplantation.
The parameters described in Figure 2 were examined and optimized concomitantly by focusing on engraftment levels in the BM. (A) J-Lat cell engraftment kinetics: Nonirradiated NSG-3GS mice were transplanted with 5 x 10⁶ J-Lat cells and the BM harvested at indicated time points post cell injection. (B) J-Lat cell injection dosage: J-Lat cell engraftment levels in the BM of nonirradiated NSG-3GS were compared using different initial injection cell doses of 5 x 10⁶ J-Lat cells (BM harvested 18 days post cell injection) or 10 x 106 J-Lat cells (BM harvested 14 days post cell injection). (C) Irradiation of recipient mice: NSG-3GS recipient mice were nonirradiated (nonIRR) or irradiated (IRR) before transplantation of 10 x 106 J-Lat cells, and engraftment levels were determined two weeks post cell transplantation. (D) Mouse strain selection: 10 x 106 J-Lat cells were injected either into irradiated NSG-3GS or irradiated NSG mice and engraftment levels in the BM were measured 3 weeks post cell injection and 24h post TNF-α treatment. Each dot represents an individual animal for the respective condition. Each plot represents an independent experiment with n ≥ 3. P values in (A) were determined using the nonparametric Kruskal-Wallis test with the uncorrected Dunn’s test for multiple comparisons. P values in (B-D) were determined using an unpaired, two-tailed t-test. A standard P<0.05 significance threshold was used.
Figure 4:
Figure 4:. J-Lat cells engraft successfully in several tissues in transplanted NSG mice.
(A) Gating strategy to identify human J-Lat cells in harvested mouse tissues exemplified here with BM. (B) Representative flow cytometry plots are shown for engraftment levels across tissue sites observed at necropsy and engraftment levels in PB (n = 5) using three different harvest approaches: r.-o. bleeding, tail vein bleeding, and heart bleeding. Bar graphs summarize (C) frequency, (D) MFI, and (E) number of engrafted J-Lat cells in the respective tissue. Each data point represents an individual animal. Colors indicate tissues harvested from the same animal. Error bars show the standard error of the mean (SEM).
Figure 5:
Figure 5:. Engrafted J-Lat cells exhibit low basal levels of GFP expression 3 weeks post cell transplantation.
(A) Gating strategy to identify human J-Lat cells and GFP background signal of engrafted J-Lat cells in harvested mouse tissues illustrated here with a representative BM sample. Representative flow cytometry plots are shown for (B) engraftment levels and (C) GFP background signal across selected tissues observed at necropsy (n = 10). Bar graphs summarize (D) cell frequency and (E) GFP expression levels of engrafted J-lat cells. Each data point represents an individual animal. Colors indicate tissues harvested from the same animal. Error bars show SEM.
Figure 6:
Figure 6:. TNF-α treatment reactivates latent HIV in vivo in the μ-Lat model.
(A) Schematic representation of the procedure to test LRAs in vivo using the μ-Lat model: (1) Mice receiving cells of interest for transplantation are irradiated 3 hours prior to cell injection. (2) Each mouse receives 10 x 106 J-Lat cells via intravenous injection. (3) Three weeks post injection (21 days) mice are treated for 24h with LRAs of interest, followed by (4) necropsy, tissue harvest and processing, and preparation of single-cell suspensions. (5) Single-cell suspensions are stained for J-Lat and mouse cell markers to assess engraftment levels via flow cytometry. Reactivation of latent provirus following LRA treatment is assessed by measuring GFP expression via flow cytometry (the J-Lat provirus contains an LTR-driven GFP reporter). (B) J-Lat cells were treated in vitro for 24h with 0.5% DMSO (vehicle control), 20 ng/μl TNF-α, 20 nM PMA/1 μM Ionomycin (positive control) or left untreated (negative control) to assess viral reactivation based on GFP expression (n = 5). (C) J-Lat engraftment levels were measured 24h post tail vein injection of 20 μg TNF-α (n = 9) or vehicle control (PBS, n = 10) in BM, spleen, lung and PB of mice. (D) Representative flow cytometry plots demonstrating the effect of vehicle control (top panel) or TNF-α treatment (bottom panel) on viral reactivation (GFP expression) in engrafted J-Lat cells. The induction of GFP expression among engrafted J-Lat cells across tissues is summarized as (E) frequency of GFP+ cells and (F) GFP MFI. One-way ANOVA and uncorrected Fisher’s LSD for multiple comparisons was used to analyze (B) in vitro reactivation data, and a mixed effects model and uncorrected Fisher’s LSD for multiple comparisons was used to analyze (C) in vivo engraftment and (E-F) viral reactivation data. Colors indicate specific animals and tissues obtained from the same animal. Error bars show SEM.

Similar articles

Cited by

References

    1. Wong JK, Hezareh M, Günthard HF, Havlir DV, Ignacio CC, Spina CA, et al. Recovery of replication-competent HIV despite prolonged suppression of plasma viremia. Science (80- ) [Internet]. 1997. Nov 14 [cited 2019 Nov 15];278(5341):1291–5. Available from: http://www.ncbi.nlm.nih.gov/pubmed/9360926 - PubMed
    1. Piot P, Bartos M, Ghys PD, Walker N, Schwartländer B. The global impact of HIV/AIDS. Nature [Internet]. 2001. Apr 19 [cited 2019 Nov 15];410(6831):968–73. Available from: http://www.nature.com/articles/35073639 - PubMed
    1. Pitman MC, Lau JSY, McMahon JH, Lewin SR. Barriers and strategies to achieve a cure for HIV. Lancet HIV [Internet]. 2018. Jun [cited 2019 Nov 15];5(6):e317–28. Available from: https://linkinghub.elsevier.com/retrieve/pii/S0031938416312148 - PMC - PubMed
    1. Schwarzer Gramatica, Greene. Reduce and Control: A Combinatorial Strategy for Achieving Sustained HIV Remissions in the Absence of Antiretroviral Therapy. Viruses [Internet]. 2020. Feb 8;12(2):188. Available from: https://www.mdpi.com/1999-4915/12/2/188 - PMC - PubMed
    1. Policicchio BB, Pandrea I, Apetrei C. Animal Models for HIV Cure Research. Front Immunol [Internet]. 2016. Jan 28 [cited 2019 Nov 15];7(JAN):12. Available from: http://www.ncbi.nlm.nih.gov/pubmed/26858716 - PMC - PubMed

Publication types

MeSH terms

Substances