

miR-5188 augments glioma growth, migration and invasion through an SP1-modulated FOXO1-PI3K/AKT-c-JUN-positive feedback circuit
- PMID: 32902145
- PMCID: PMC7579714
- DOI: 10.1111/jcmm.15794
miR-5188 augments glioma growth, migration and invasion through an SP1-modulated FOXO1-PI3K/AKT-c-JUN-positive feedback circuit
Abstract
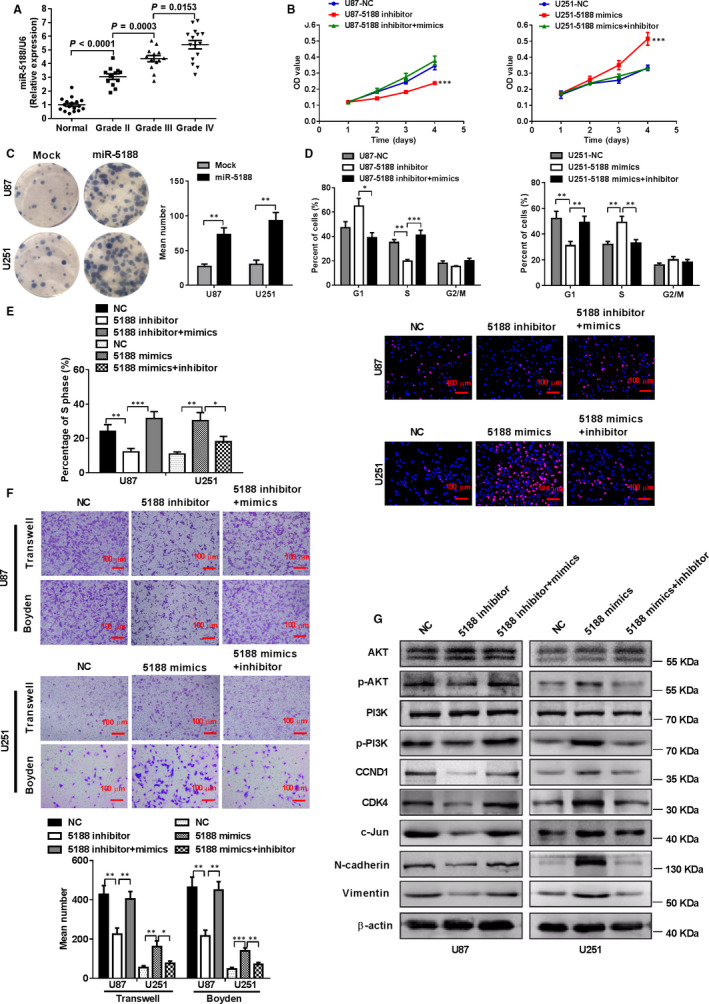
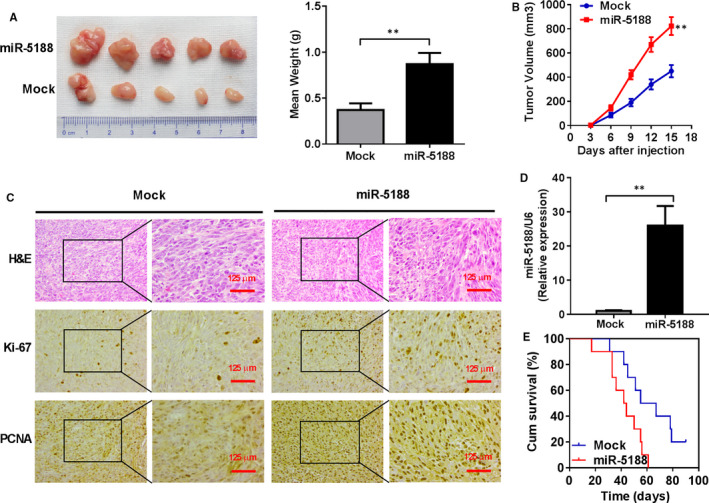
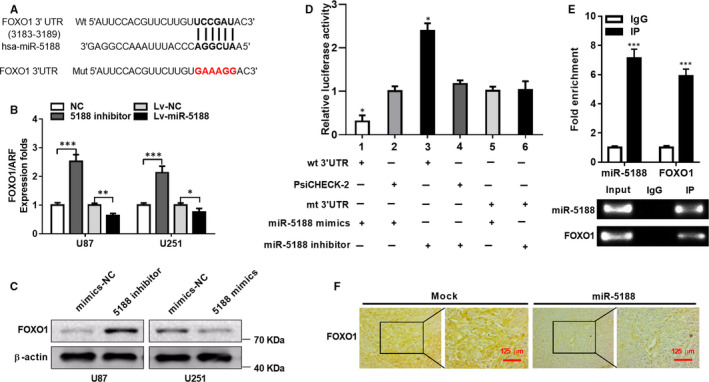
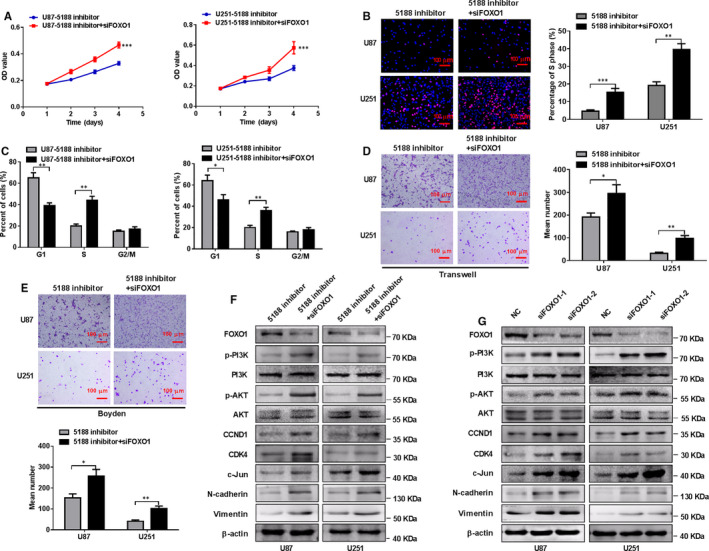
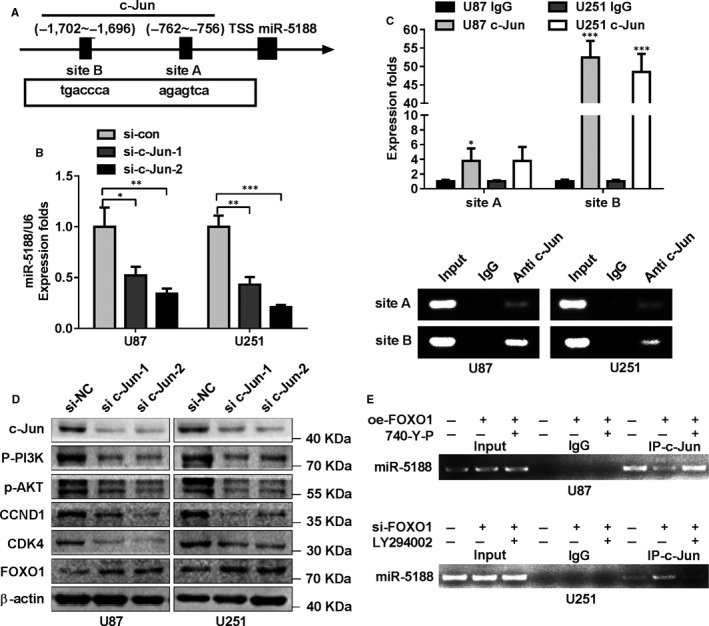
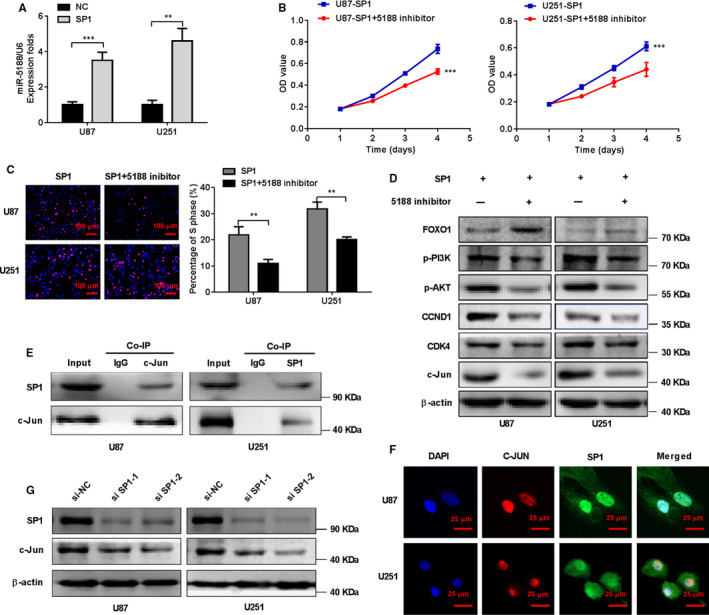
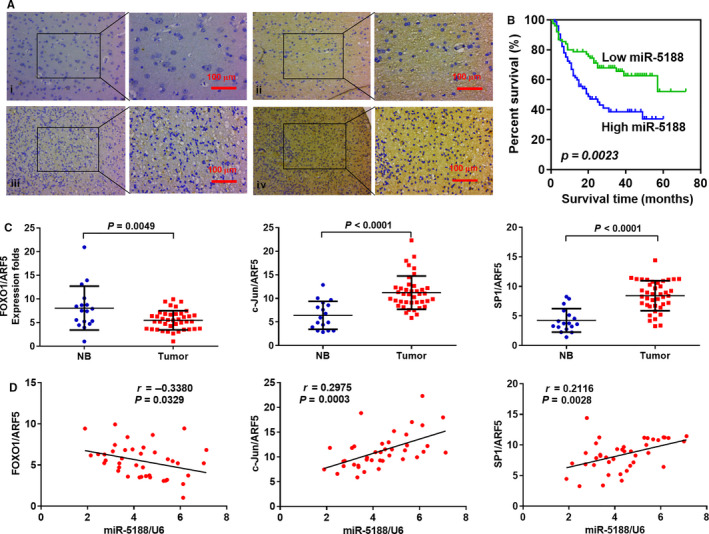
The biological effect and molecular mechanism of miR-5188 have not been thoroughly investigated. The study aims at elucidating the role of miR-5188 in glioma progression. Human glioma cell lines and tissues were used for functional and expression analysis. Cellular and molecular techniques were performed to explore the functions and mechanisms of miR-5188 in glioma. In our investigation, we demonstrated that miR-5188 promoted cell proliferation, the G1/S transition of the cell cycle, migration and invasion in glioma and reduced the lifespan of glioma-bearing mice. miR-5188 directly targeted FOXO1 and activated PI3K/AKT-c-JUN signalling, which enhanced miR-5188 expression. Moreover, the c-JUN transcription factor functionally bound to the miR-5188 promoter region, forming the positive feedback loop. The feedback loop promoted glioma progression through activating the PI3K/AKT signalling, and this loop is augmented by the interaction between SP1 and c-JUN. Moreover, it was also found that the miR-5188/FOXO1 axis is facilitated by SP1-activated PI3K/AKT/c-JUN signalling. In glioma samples, miR-5188 expression was found to be an unfavourable factor and was positively associated with the mRNA levels of SP1 and c-JUN, whereas negatively associated with the mRNA levels of FOXO1. Our investigation demonstrates that miR-5188 could function as a tumour promoter by directly targeting FOXO1 and participating in SP1-mediated promotion of cell growth and tumorigenesis in glioma.
Keywords: FOXO1; SP1; c-JUN; glioma; miR-5188.
© 2020 The Authors. Journal of Cellular and Molecular Medicine published by Foundation for Cellular and Molecular Medicine and John Wiley & Sons Ltd.
Conflict of interest statement
The authors confirm that there are no conflicts of interest.
Figures
Similar articles
-
miR-3188 regulates nasopharyngeal carcinoma proliferation and chemosensitivity through a FOXO1-modulated positive feedback loop with mTOR-p-PI3K/AKT-c-JUN.Nat Commun. 2016 Apr 20;7:11309. doi: 10.1038/ncomms11309. Nat Commun. 2016. PMID: 27095304 Free PMC article.
-
MicroRNA-629 promotes the tumorigenesis of non-small-cell lung cancer by targeting FOXO1 and activating PI3K/AKT pathway.Cancer Biomark. 2020;29(3):347-357. doi: 10.3233/CBM-201685. Cancer Biomark. 2020. PMID: 32716350
-
miR-489 inhibits proliferation, cell cycle progression and induces apoptosis of glioma cells via targeting SPIN1-mediated PI3K/AKT pathway.Biomed Pharmacother. 2017 Sep;93:435-443. doi: 10.1016/j.biopha.2017.06.058. Epub 2017 Jun 27. Biomed Pharmacother. 2017. PMID: 28666210
-
The outstanding role of miR-132-3p in carcinogenesis of solid tumors.Hum Cell. 2021 Jul;34(4):1051-1065. doi: 10.1007/s13577-021-00544-w. Epub 2021 May 17. Hum Cell. 2021. PMID: 33997944 Review.
-
[Transcription Factor Sp1 in the Expression of Genes Encoding Components of MAPK, JAK/STAT, and PI3K/Akt Signaling Pathways].Mol Biol (Mosk). 2022 Sep-Oct;56(5):832-847. doi: 10.31857/S0026898422050081. Mol Biol (Mosk). 2022. PMID: 36165020 Review. Russian.
Cited by
-
Forkhead box transcription factors (FOXOs and FOXM1) in glioma: from molecular mechanisms to therapeutics.Cancer Cell Int. 2023 Oct 11;23(1):238. doi: 10.1186/s12935-023-03090-7. Cancer Cell Int. 2023. PMID: 37821870 Free PMC article. Review.
-
Ubiquitin specific peptidase 33 promotes cell proliferation and reduces apoptosis through regulation of the SP1/PI3K/AKT pathway in retinoblastoma.Cell Cycle. 2021 Oct;20(19):2066-2076. doi: 10.1080/15384101.2021.1970305. Epub 2021 Sep 1. Cell Cycle. 2021. PMID: 34470581 Free PMC article.
-
The small molecule chemical compound cinobufotalin attenuates resistance to DDP by inducing ENKUR expression to suppress MYH9-mediated c-Myc deubiquitination in lung adenocarcinoma.Acta Pharmacol Sin. 2022 Oct;43(10):2687-2695. doi: 10.1038/s41401-022-00890-x. Epub 2022 Mar 16. Acta Pharmacol Sin. 2022. PMID: 35296779 Free PMC article.
-
Identification of Diagnostic Markers Correlated With HIV+ Immune Non-response Based on Bioinformatics Analysis.Front Mol Biosci. 2021 Dec 22;8:809085. doi: 10.3389/fmolb.2021.809085. eCollection 2021. Front Mol Biosci. 2021. PMID: 35004856 Free PMC article.
-
SP1 activates AKT3 to facilitate the development of diabetic nephropathy.J Endocrinol Invest. 2025 May;48(5):1269-1281. doi: 10.1007/s40618-025-02530-7. Epub 2025 Jan 9. J Endocrinol Invest. 2025. PMID: 39786707
References
Publication types
MeSH terms
Substances
LinkOut - more resources
Full Text Sources
Medical
Research Materials
Miscellaneous
