. 2020 Dec;9(1):2061-2075.
doi: 10.1080/22221751.2020.1821581.

mRNA and miRNA profiling of Zika virus-infected human umbilical cord mesenchymal stem cells identifies miR-142-5p as an antiviral factor

Affiliations

mRNA and miRNA profiling of Zika virus-infected human umbilical cord mesenchymal stem cells identifies miR-142-5p as an antiviral factor

Rak-Kyun Seong et al. Emerg Microbes Infect. 2020 Dec.

Abstract

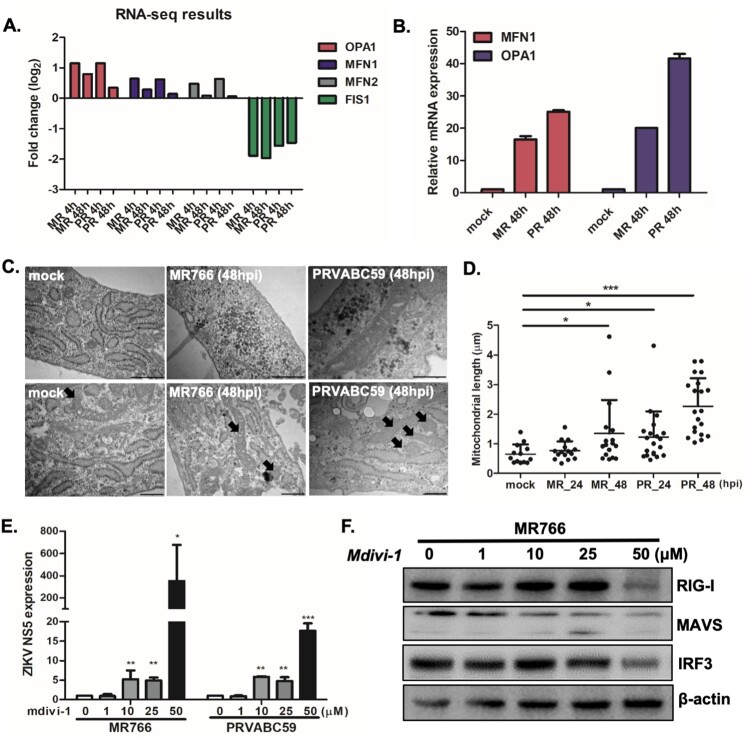
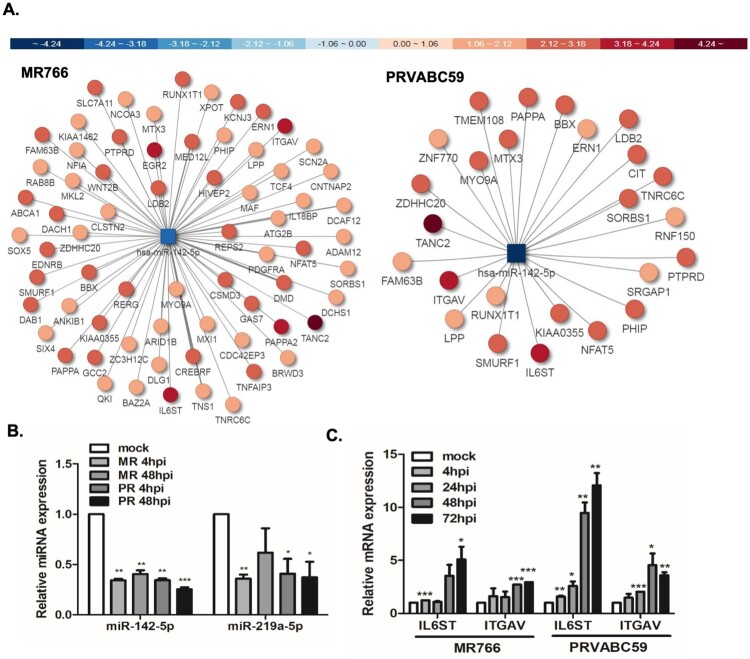
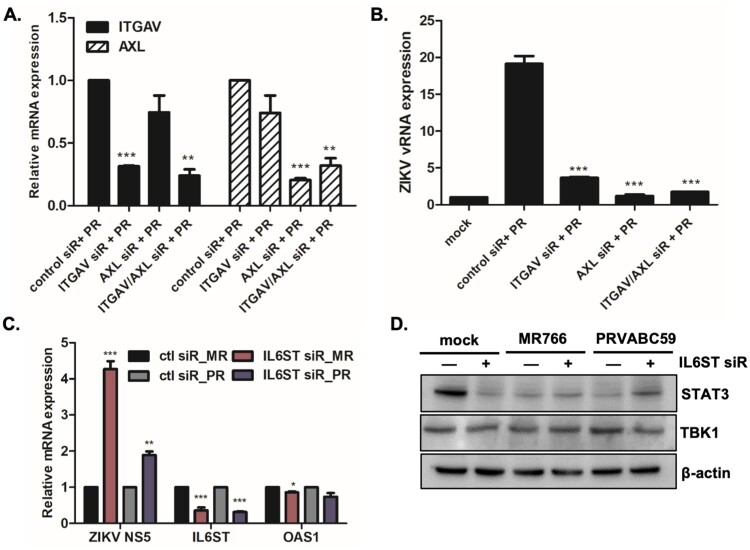
Zika virus (ZIKV) infection during pregnancy is associated with congenital brain abnormalities, a finding that highlights the urgent need to understand mother-to-fetus transmission mechanisms. Human umbilical cord mesenchymal stem cells (hUCMSCs) are susceptible to ZIKV infection but the underlying mechanisms of viral susceptibility remain largely unexplored. In this study, we have characterized and compared host mRNA and miRNA expression profiles in hUCMSCs after infection with two lineages of ZIKV, African (MR766) and Asian (PRVABC59). RNA sequencing analysis identified differentially expressed genes involved in anti-viral immunity and mitochondrial dynamics following ZIKV infection. In particular, ZIKV-infected hUCMSCs displayed mitochondrial elongation and the treatment of hUCMSCs with mitochondrial fission inhibitor led to a dose-dependent increase in ZIKV gene expression and decrease in anti-viral signalling pathways. Moreover, small RNA sequencing analysis identified several significantly up- or down-regulated microRNAs. Interestingly, miR-142-5p was significantly downregulated upon ZIKV infection, whereas cellular targets of miR-142-5p, IL6ST and ITGAV, were upregulated. Overexpression of miR-142-5p resulted in the suppression of ZIKV replication. Furthermore, blocking ITGAV expression resulted in a significant suppression of ZIKV binding to cells, suggesting a potential role of ITGAV in ZIKV entry. In conclusion, these results demonstrate both common and specific host responses to African and Asian ZIKV lineages and indicate miR-142-5p as a key regulator of ZIKV replication in the umbilical cords.

Keywords: RNA-seq; ZIKV; hUCMSCs; innate immunity; miRNA; small RNA-seq.


Conflict of interest statement

No potential conflict of interest was reported by the author(s).

Figures

Figure 1.
Figure 1.
Human umbilical cord derived mesenchymal stem cells (hUCMSCs) are highly permissive to ZIKV infection (A) Confocal images of hUCMSCs infected with PRVABC59 (Asian lineage) at 24 hpi. ZIKV envelope (E) protein (Red), DAPI (blue), and CD73 (green) are shown. Scale bar = 20 μm. (B) hUCMSCs and JAR choriocarcinoma cells were infected with ZIKV at a multiplicity of infection (MOI) of 1 and RNA was collected at different time points. qRT-PCR was performed to determine the ZIKV NS5 transcript levels. Data are representative of three independent experiments (mean ± SD). *p < 0.05; **p < 0.01; ***p < 0.001, versus mock-infected cells. (C) Cells were infected with ZIKV (MR766 or PRVABC59) at a MOI of 1 for 72 h. Cells were fixed with paraformaldehyde and permeabilized with 0.5% Triton X-100. ZIKV E protein was immunostained with anti-pan-flavivirus envelope monoclonal antibody. ZIKV E and cell nuclei are stained red and blue, respectively. The images are representative of three independent experiments. Scale bar = 20 μm. (D) Viral titers were measured by TCID50 assay. Supernatant were collected from hUCMSCs infected with ZIKV (MR766 or PRVABC59) at a MOI of 1 for various timepoints. TCID50 was calculated using the Spearman-Kärber method. Results represent means ± SD of two independent experiments.
Figure 2.
Figure 2.
Analysis of transcriptome profiles of hUCMSCs after infection with ZIKV. (A) A schematic showing experimental design. hUCMSCs were infected with mock, MR766 and PRVABV59 (MOI of 1) for 4 and 48 hpi and RNA was analysed by RNA-seq and small RNA-seq to identify mRNA and miRNAs dysregulated by ZIKV infection. (B) Heatmaps showing the statistical over-representation of the top 20 differentially expressed genes (DEGs) involved in immune function based on the lists of transcripts that were differentially expressed (compared to the mock-infected cells). (C) Venn diagrams show numbers of more than 2 fold up or down-regulated DEGs identified from the comparison among mock and virus-infected groups. The numbers in red (upregulated) or blue (downregulated) indicate the mRNA counts in the indicated area. (D) To validate RNA-seq results, qRT-PCR was performed to measure RIG-I, MDA5, TLR3, IP-10, IL-6, OAS and IFN-β mRNA levels following ZIKV infection in hUCMSCs. Data are representative of three independent experiments (mean ± SD). *p < 0.05; **p < 0.01; ***p < 0.001, versus mock-infected cells. (E) hUCMSCs were infected with MR766 or PRVABC59 at MOI of 1. The protein levels of pAKT/AKT, RIG-I, and β-actin were measured by Western blotting.
Figure 3.
Figure 3.
ZIKV infection results in alterations in mitochondrial morphology and function in hUCMSCs (A) Fold change levels of OPA1, MFN1, MFN2, and FIS1 gene expression are shown from RNA-seq data (B) MFN1 and OPA1 transcript levels were measured by qRT-PCR to validate RNA-seq results shown in (A). (C) Ultra-thin section transmission electron microscopy images of mock and ZIKV-infected resin-embedded hUCMSCs (Scale bar = 500 nm). The arrows indicate mitochondria with altered morphology. ZIKV-infected cells displayed elongated mitochondria. (D) Quantitative analysis of mitochondrial lengths in mock and ZIKV-infected hUCMSCs at 24 and 48 hpi. The average mitochondrial lengths for cells within each condition were calculated using ImageJ software. Statistical analysis was done on the average mitochondrial lengths of each cell as described. *p < 0.05; **p < 0.01; ***p < 0.001, versus mock-infected cells. (E) Mdivi-1, mitochondrial fission inhibitor, was added in ZIKV-infected cells at various concentrations. qRT-PCR was performed to determine ZIKV NS5 transcript levels. Data are representative of three independent experiments (mean ± SD). *p < 0.05; **p < 0.01; ***p  < 0.001, versus DMSO control. (F) Expression of RIG-I, MAVS and IRF3 was determined by Western blotting analysis in cell lysates of mock vs. ZIKV-infected cells.
Figure 4.
Figure 4.
Comprehensive analysis of small RNAs during ZIKV infection in hUCMSCs. Pie chart of mappable small RNAs obtained by small RNA next generation sequencing in ZIKV-infected hUCMSCs. Small RNA-seq reads are distributed across categories of annotated small RNAs pre-miRNAs, small non-coding RNAs (snoRNAs), long non-coding RNAs (lncRNAs), transfer RNAs (tRNAs), ribosomal RNAs (rRNAs) in mock-treated or ZIKV MR766- or PRVABC59-infected cells at 4 and 48 hpi.
Figure 5.
Figure 5.
miRNA-mRNA associated network analysis present targets of miR-142-5p. (A) miRNA–mRNA associated network for ZIKV-infected hUCMSCs are shown. miRNA (square) and their predicted target mRNAs (circles) are connected by lines. The colour of each miRNA and mRNA is annotated by Pi score. Hubs were devised on the basis of miRNAs that shared multiple common mRNA targets. Downregulated miR-142-5p regulates many putative target genes, which were found to be upregulated by ZIKV infection. (B) Expressions of miR-142-5p and miR-219a-5p in hUCMSCs were verified by qRT-PCR using specific primers for the mature form of miRNAs. Similar expression levels of miRNAs were observed in the small RNA-seq results. *p < 0.05; **p < 0.01; ***p < 0.001, versus mock-infected cells. (C) mRNA expression of IL6ST and ITGAV was measured in mock and ZIKV-infected hUCMSCs using qRT-PCR. *p < 0.05, **p < 0.01, and ***p < 0.001, compared with mock control.
Figure 6.
Figure 6.
IL6ST and ITGAV are targets of miR-142-5p and overexpression of miR-142-5p results in the reduction of ZIKV replication. (A, B) Schematic presentation of the predicted miR-142-5p binding sites within the ITGAV (A) and IL6ST (B) 3’UTR and a mutated type of ITGAV and IL6ST, as predicted by the Target Scan database. The mutated nucleotides are marked in bold. Luciferase reporter assay performed using HEK293 T cells transfected with plasmids into which the luciferase reporter gene was fused to fragment of wild type or mutant 3’UTRs of ITGAV and IL6ST. (C, D) Cells were transfected with miR-142-5p mimic or mimic negative control as indicated. 24 h later, cells were infected with ZIKV (MR766 or PRVABC59) at MOI of 1 for 24 h. (C) IL6ST, ITGAV, and ZIKV NS5 transcript levels were determined by qRT-PCR. (D) mRNA expression of ITGB1, IL-6, and TNF-α was measured by qRT-PCR. *p < 0.05, **p < 0.01, and ***p < 0.001, compared with control mimic. (E) Expression of ZIKV NS1 was examined by Western blot analysis. Quantitative densitometric analysis of Western blot analysis is presented, with normalized densitometric units plotted against treatment (shown as numbers). (F) Measurement by TCID50 assay of infectious ZIKV release into supernatant at 48 hpi is shown (MOI 1). Results represent means ± SD of two independent experiments.
Figure 7.
Figure 7.
The effect of miR-142-5p targets, ITGAV and IL6ST, on ZIKV infection. (A, B) A549 cells were transfected with control or ITGAV or AXL-specific siRNA followed by ZIKV infection (PRVABC59) at MOI of 1 for 24 h. The knockdown efficiency of ITGAV or AXL-specific siRNA treatment was measured by qRT-PCR. (B) Expression levels of ZIKV vRNA were measured by qRT-PCR. The results represent mean ± SD. *p < 0.05, **p < 0.01, and ***p < 0.001, compared with control siRNA-treated cells. (C) A549 cells were transfected with control or IL6ST-specific siRNA followed by ZIKV infection (MR766 or PRVABC59) at MOI of 1 for 24 h. Expression levels of ZIKV NS5, IL6ST and OAS1 were measured by qRT-PCR. Data are representative of three independent experiments (mean ± SD). *p < 0.05, **p < 0.01, and ***p < 0.001, compared with control siRNA-transfected cells. (D) Expression of STAT3, TBK1, and β-actin was determined by Western blotting analysis in cell lysates of mock vs ZIKV-infected cells.

Similar articles

Cited by

References

    1. Dick GW, Kitchen SF, Haddow AJ.. Zika virus. I. Isolations and serological specificity. Trans R Soc Trop Med Hyg. 1952 Sep;46(5):509–520. - PubMed
    1. Dyer O. Zika virus spreads across Americas as concerns mount over birth defects. Br Med J. 2015 Dec 23;351:h6983. - PubMed
    1. Fauci AS, Morens DM.. Zika virus in the Americas – yet another Arbovirus threat. N Engl J Med. 2016 Feb 18;374(7):601–604. - PubMed
    1. Mlakar J, Korva M, Tul N, et al. . Zika virus associated with microcephaly. N Engl J Med. 2016 Mar 10;374(10):951–958. - PubMed
    1. McCarthy M. Zika related microcephaly may appear after birth, study finds. Br Med J. 2016 Nov 23;355:i6333. - PubMed

MeSH terms