. 2020 Sep 23;18(36):7110-7126.
doi: 10.1039/d0ob01447h.

Connecting the conformational behavior of cyclic octadepsipeptides with their ionophoric property and membrane permeability

Affiliations

Connecting the conformational behavior of cyclic octadepsipeptides with their ionophoric property and membrane permeability

Thomas Stadelmann et al. Org Biomol Chem. .

Abstract

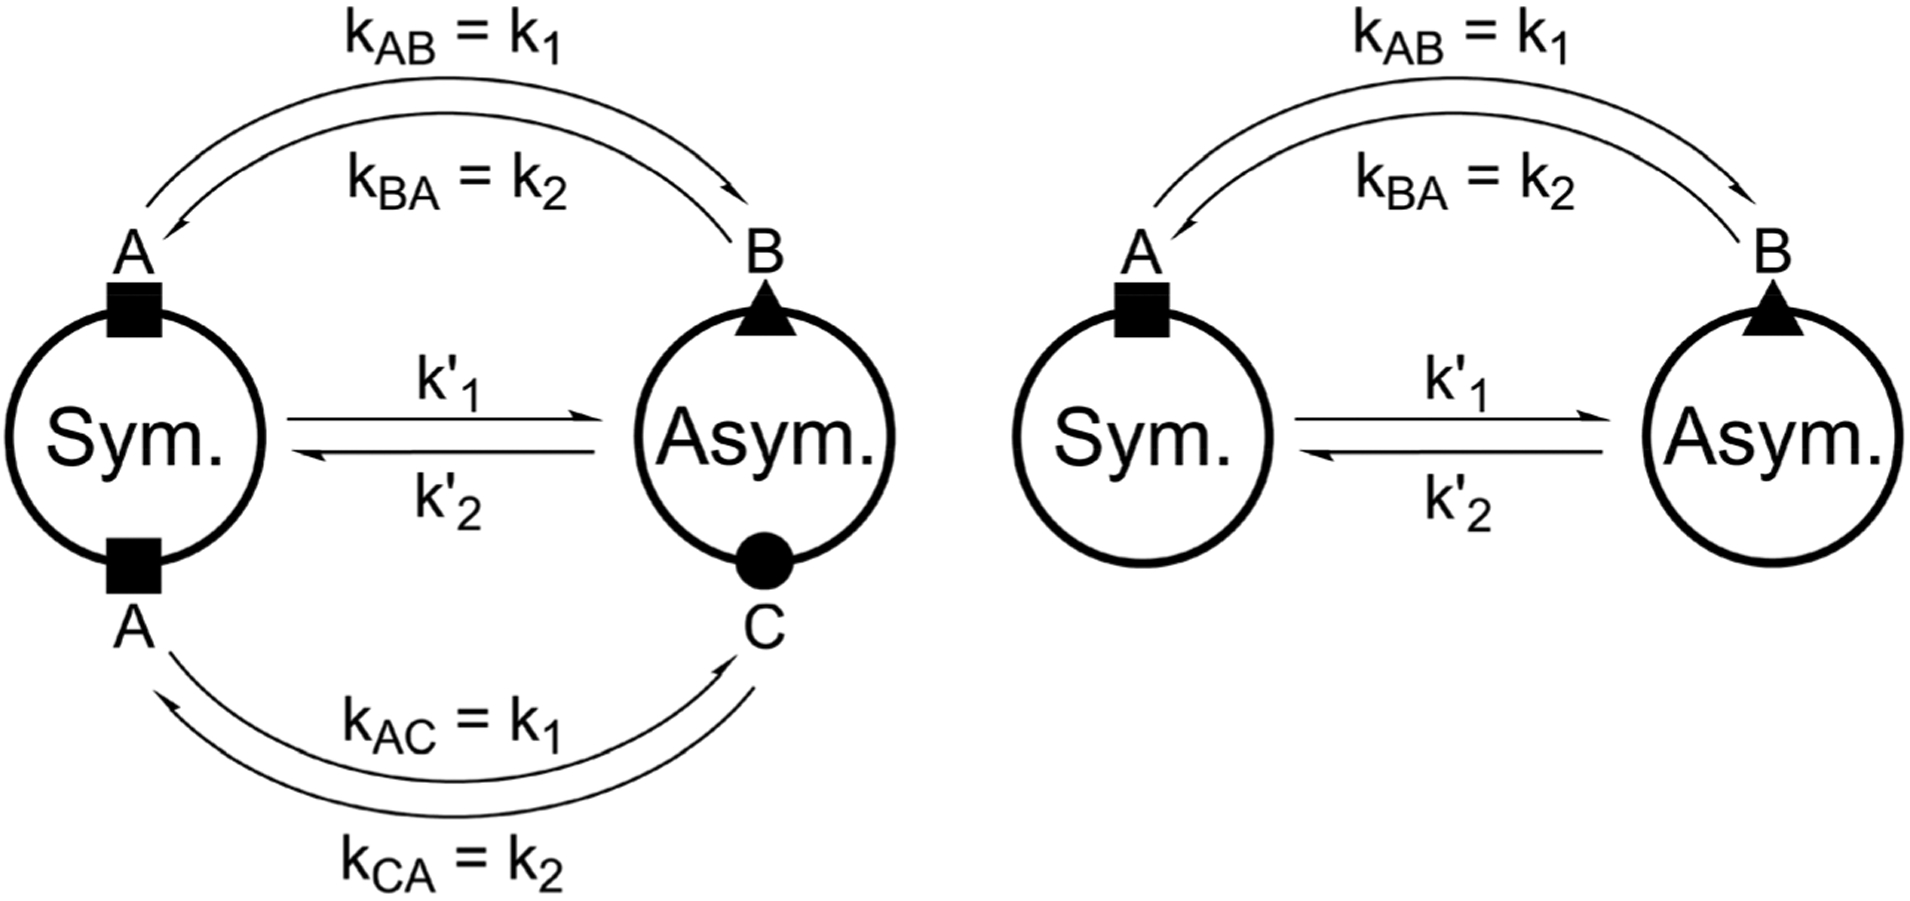
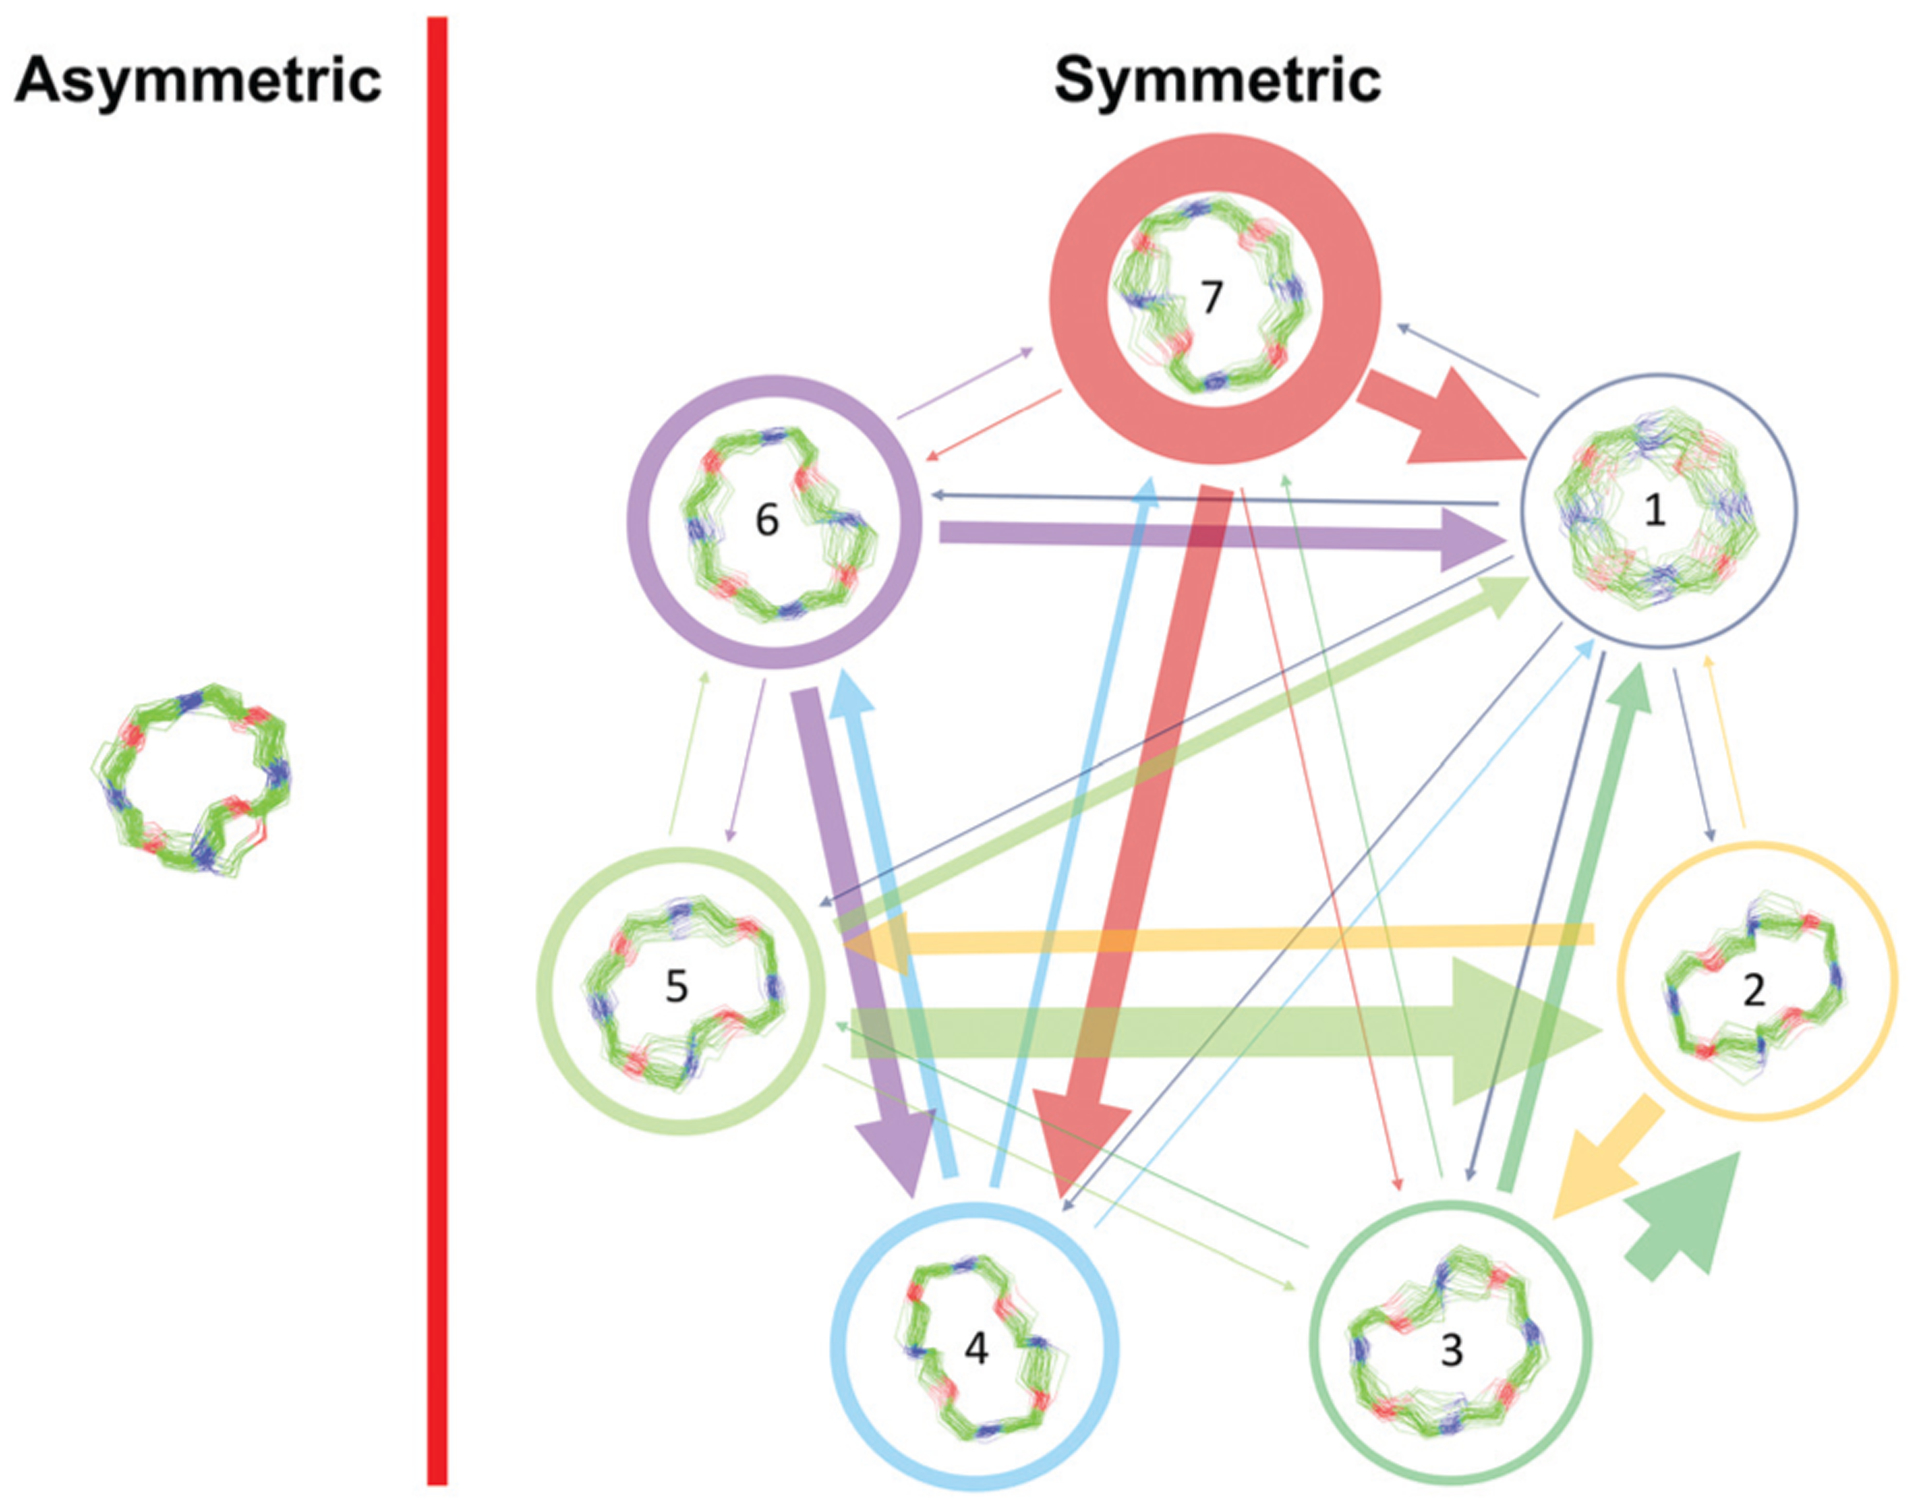
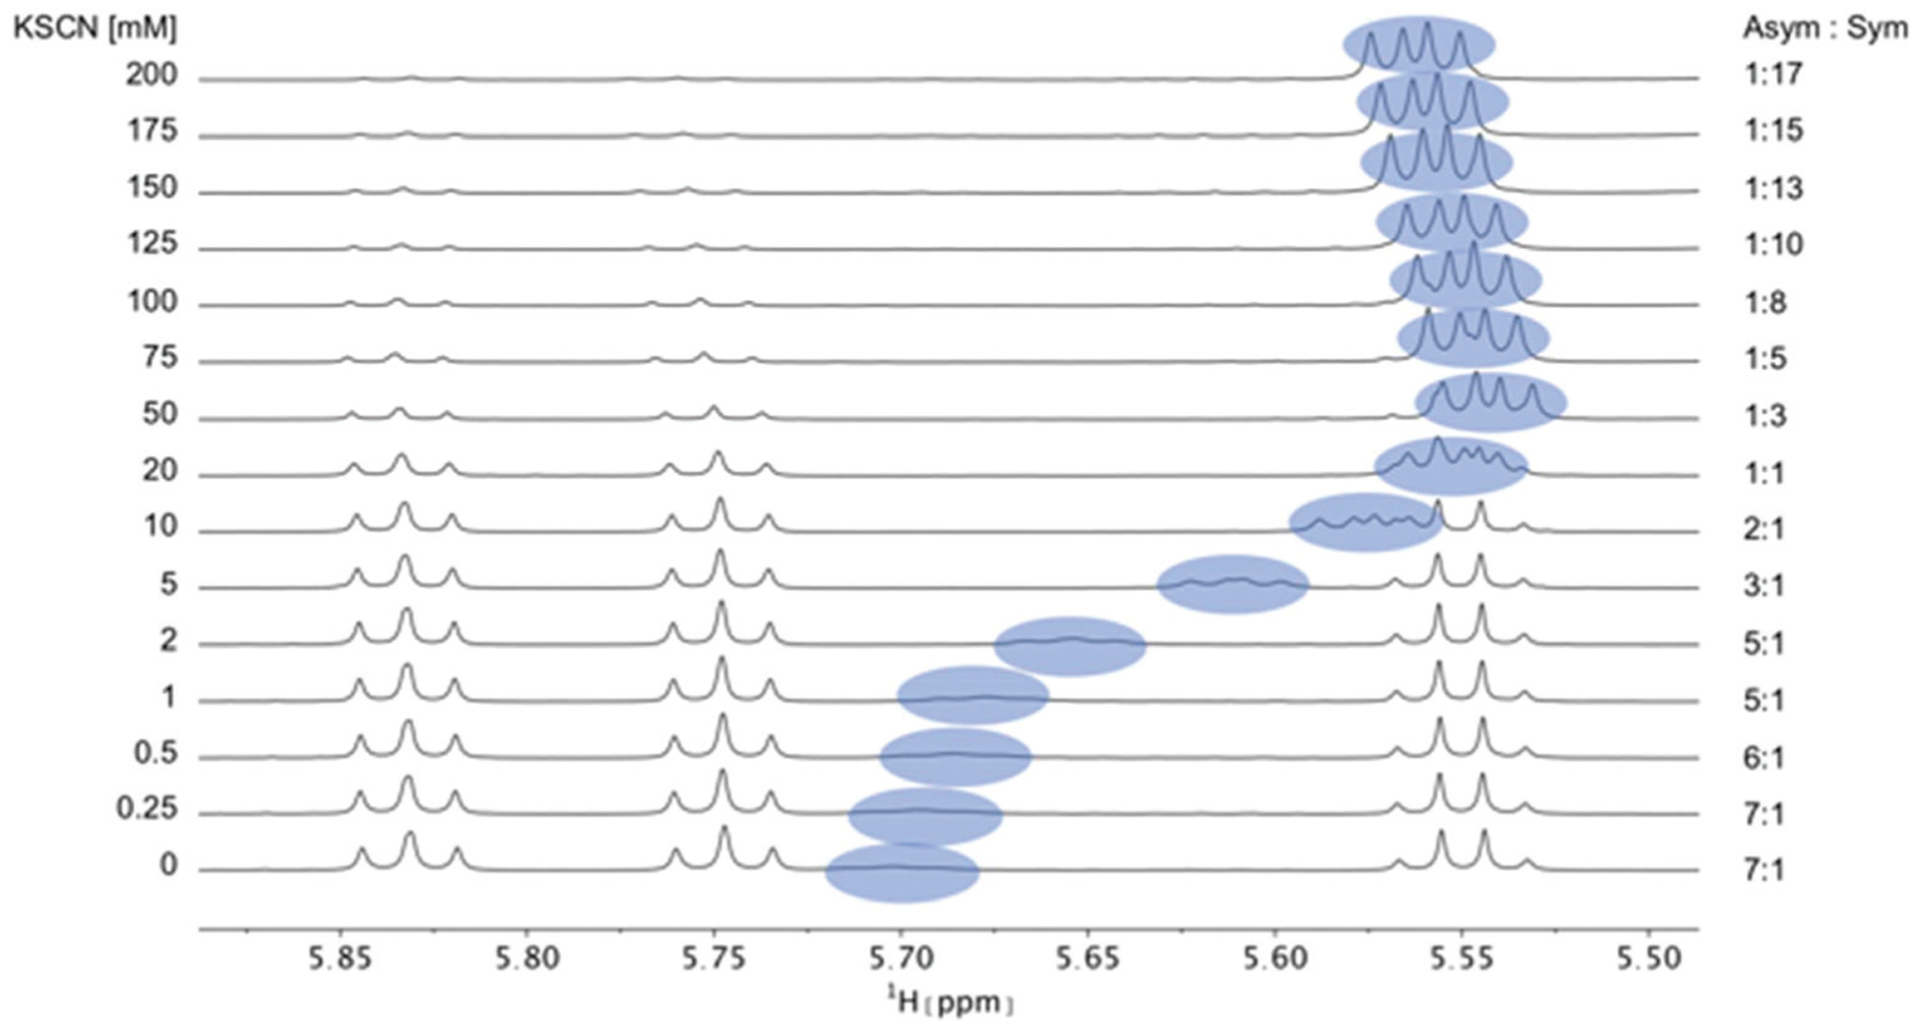
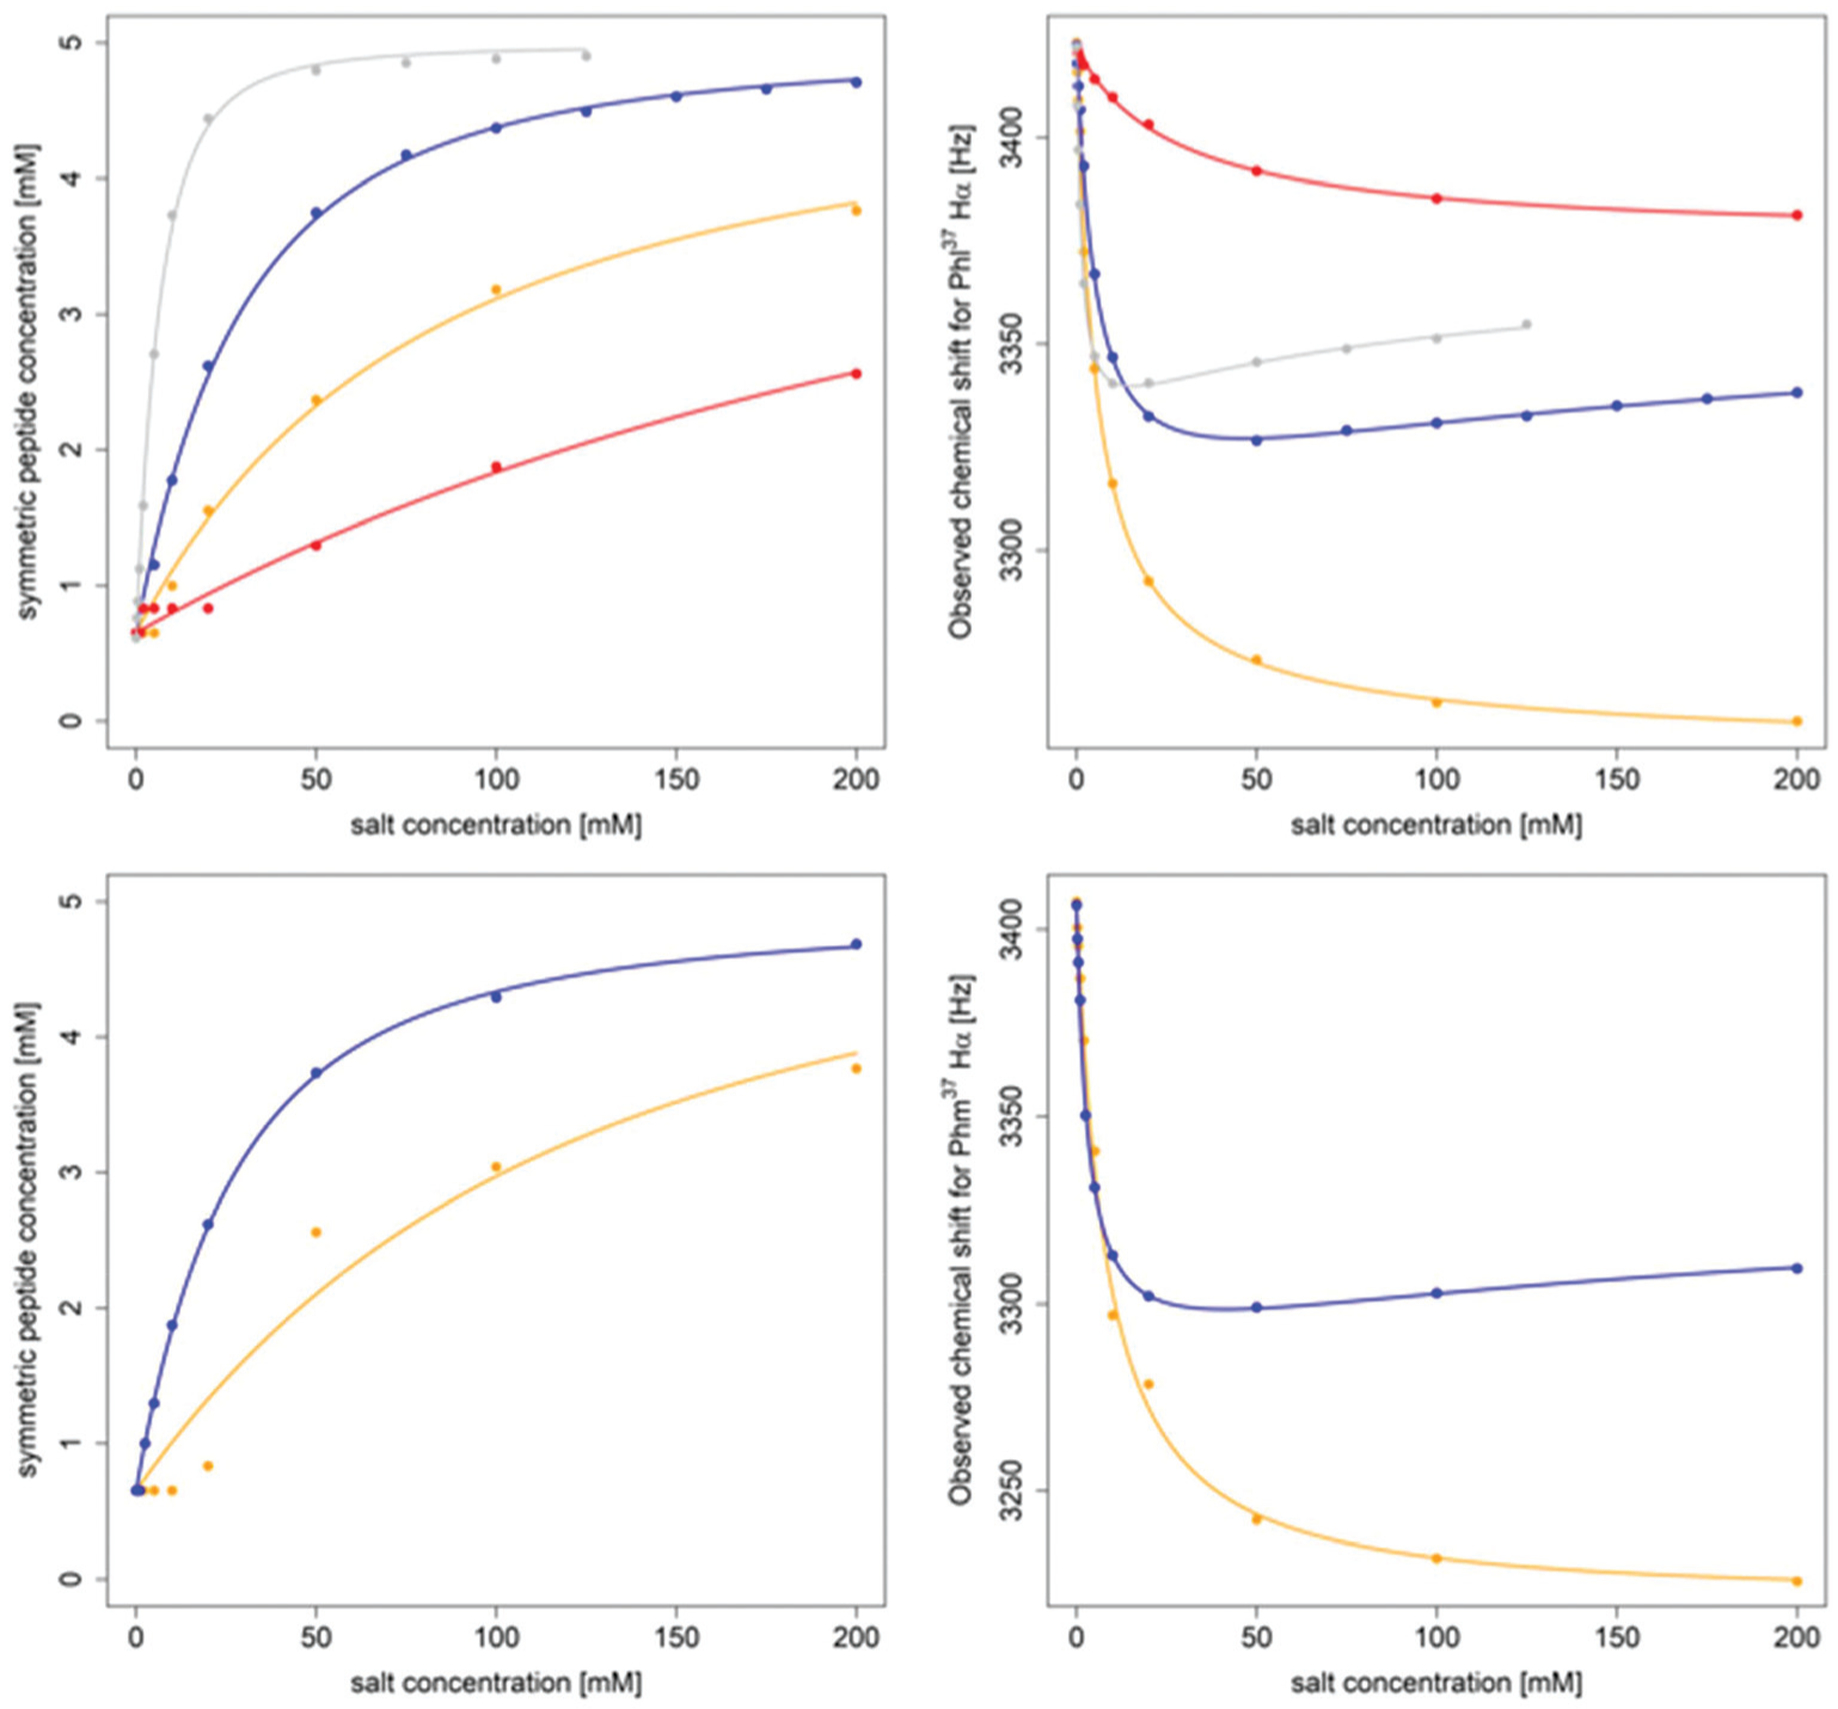
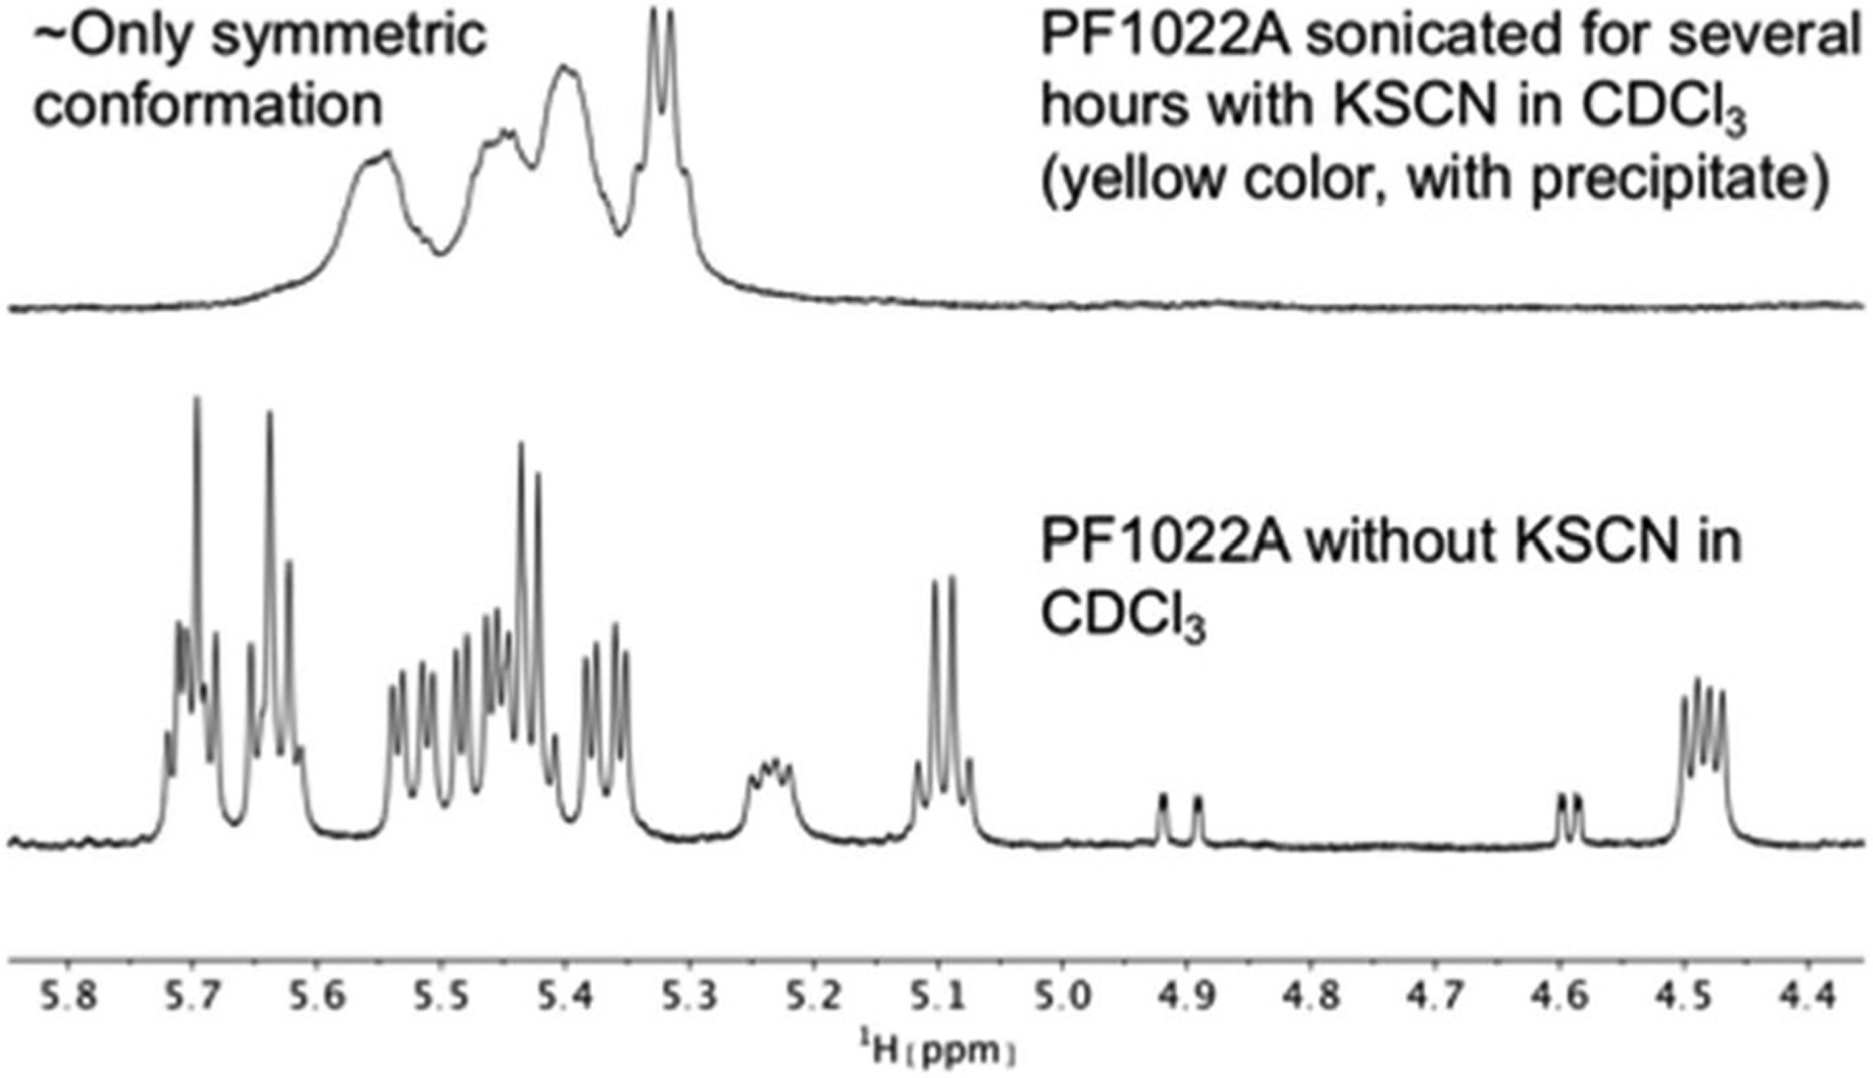
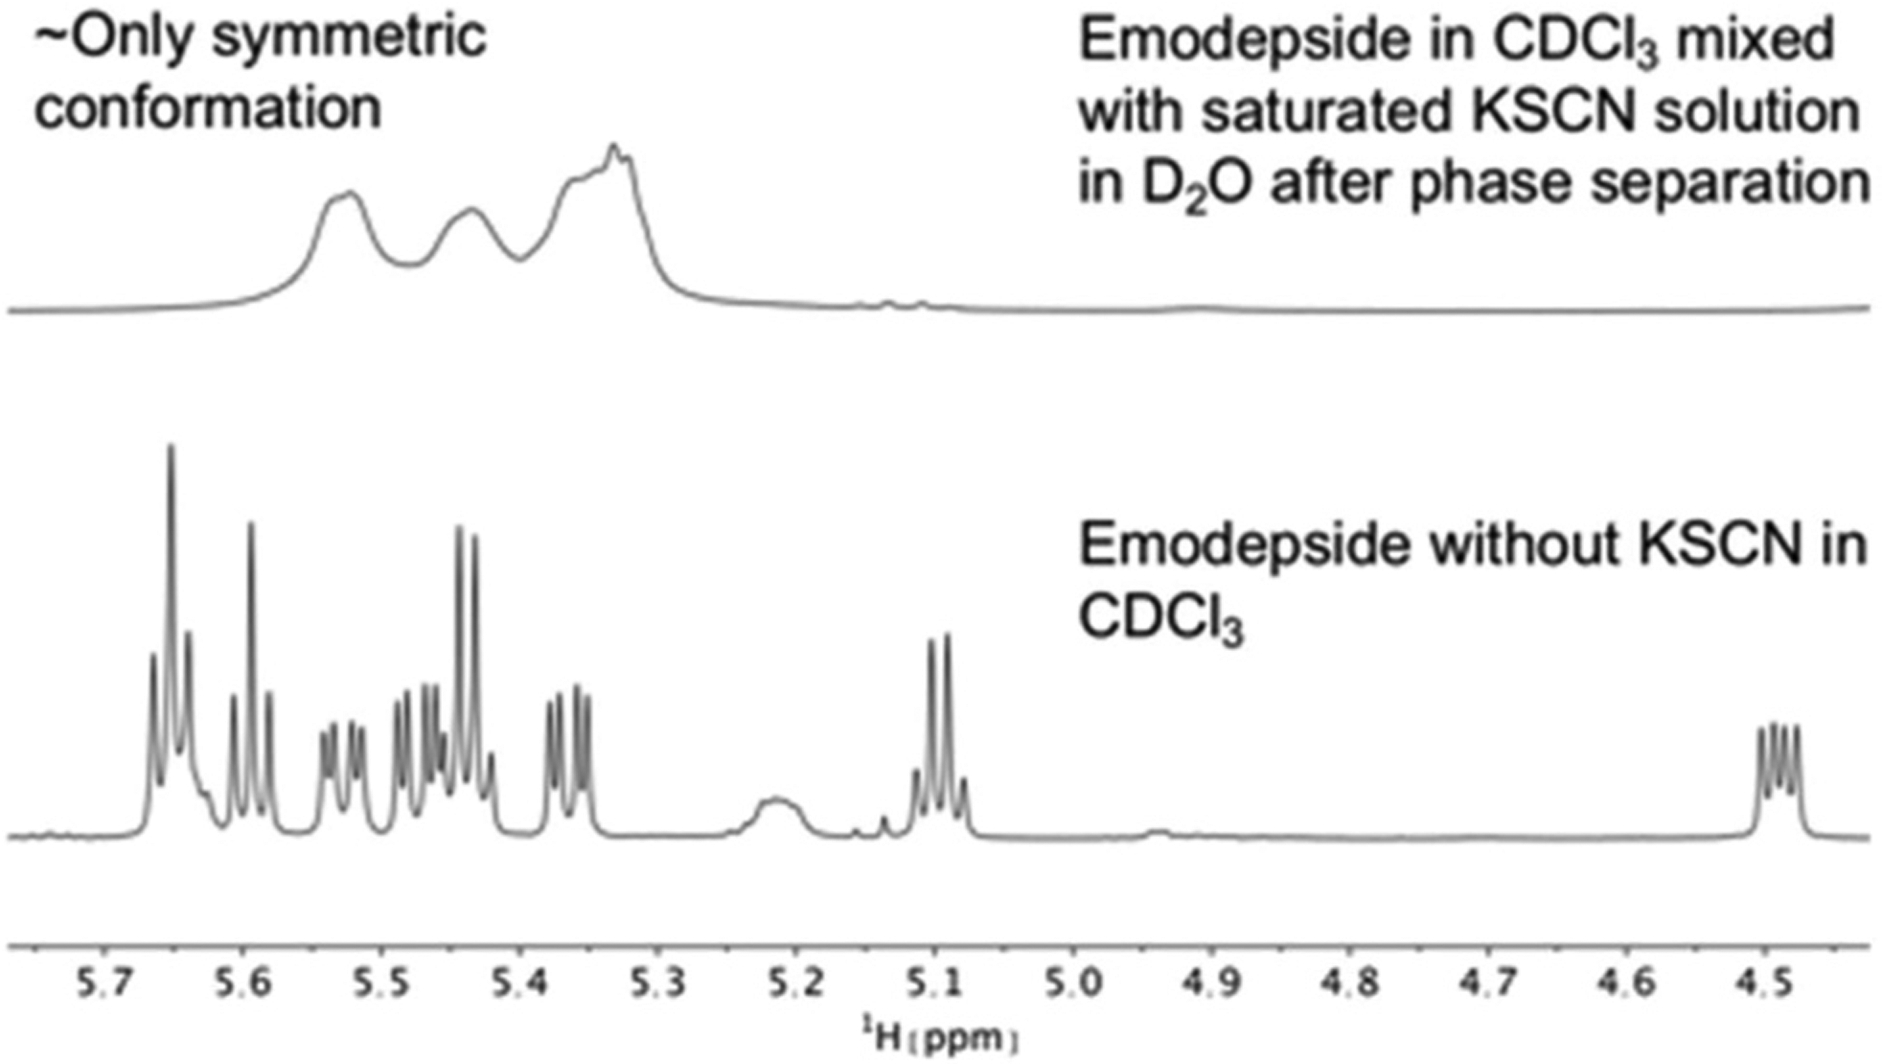
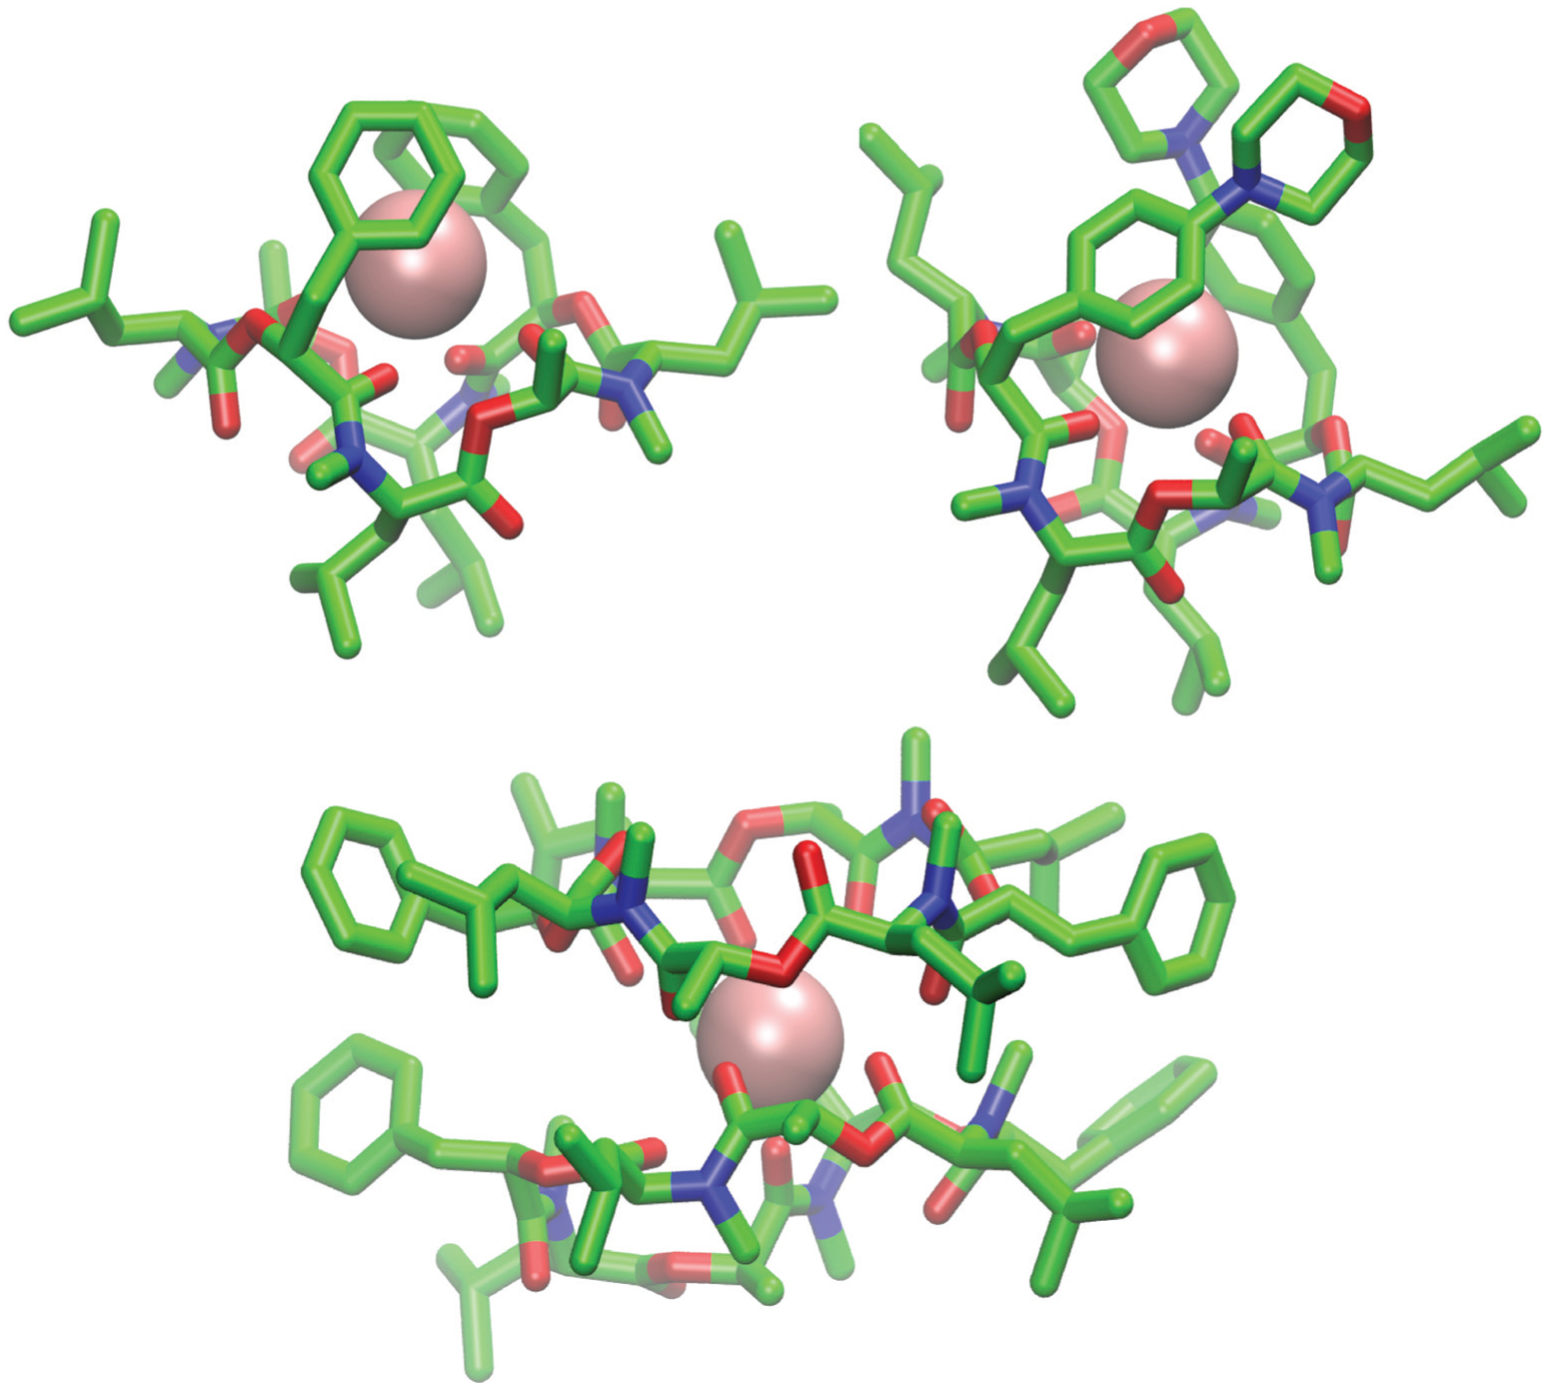
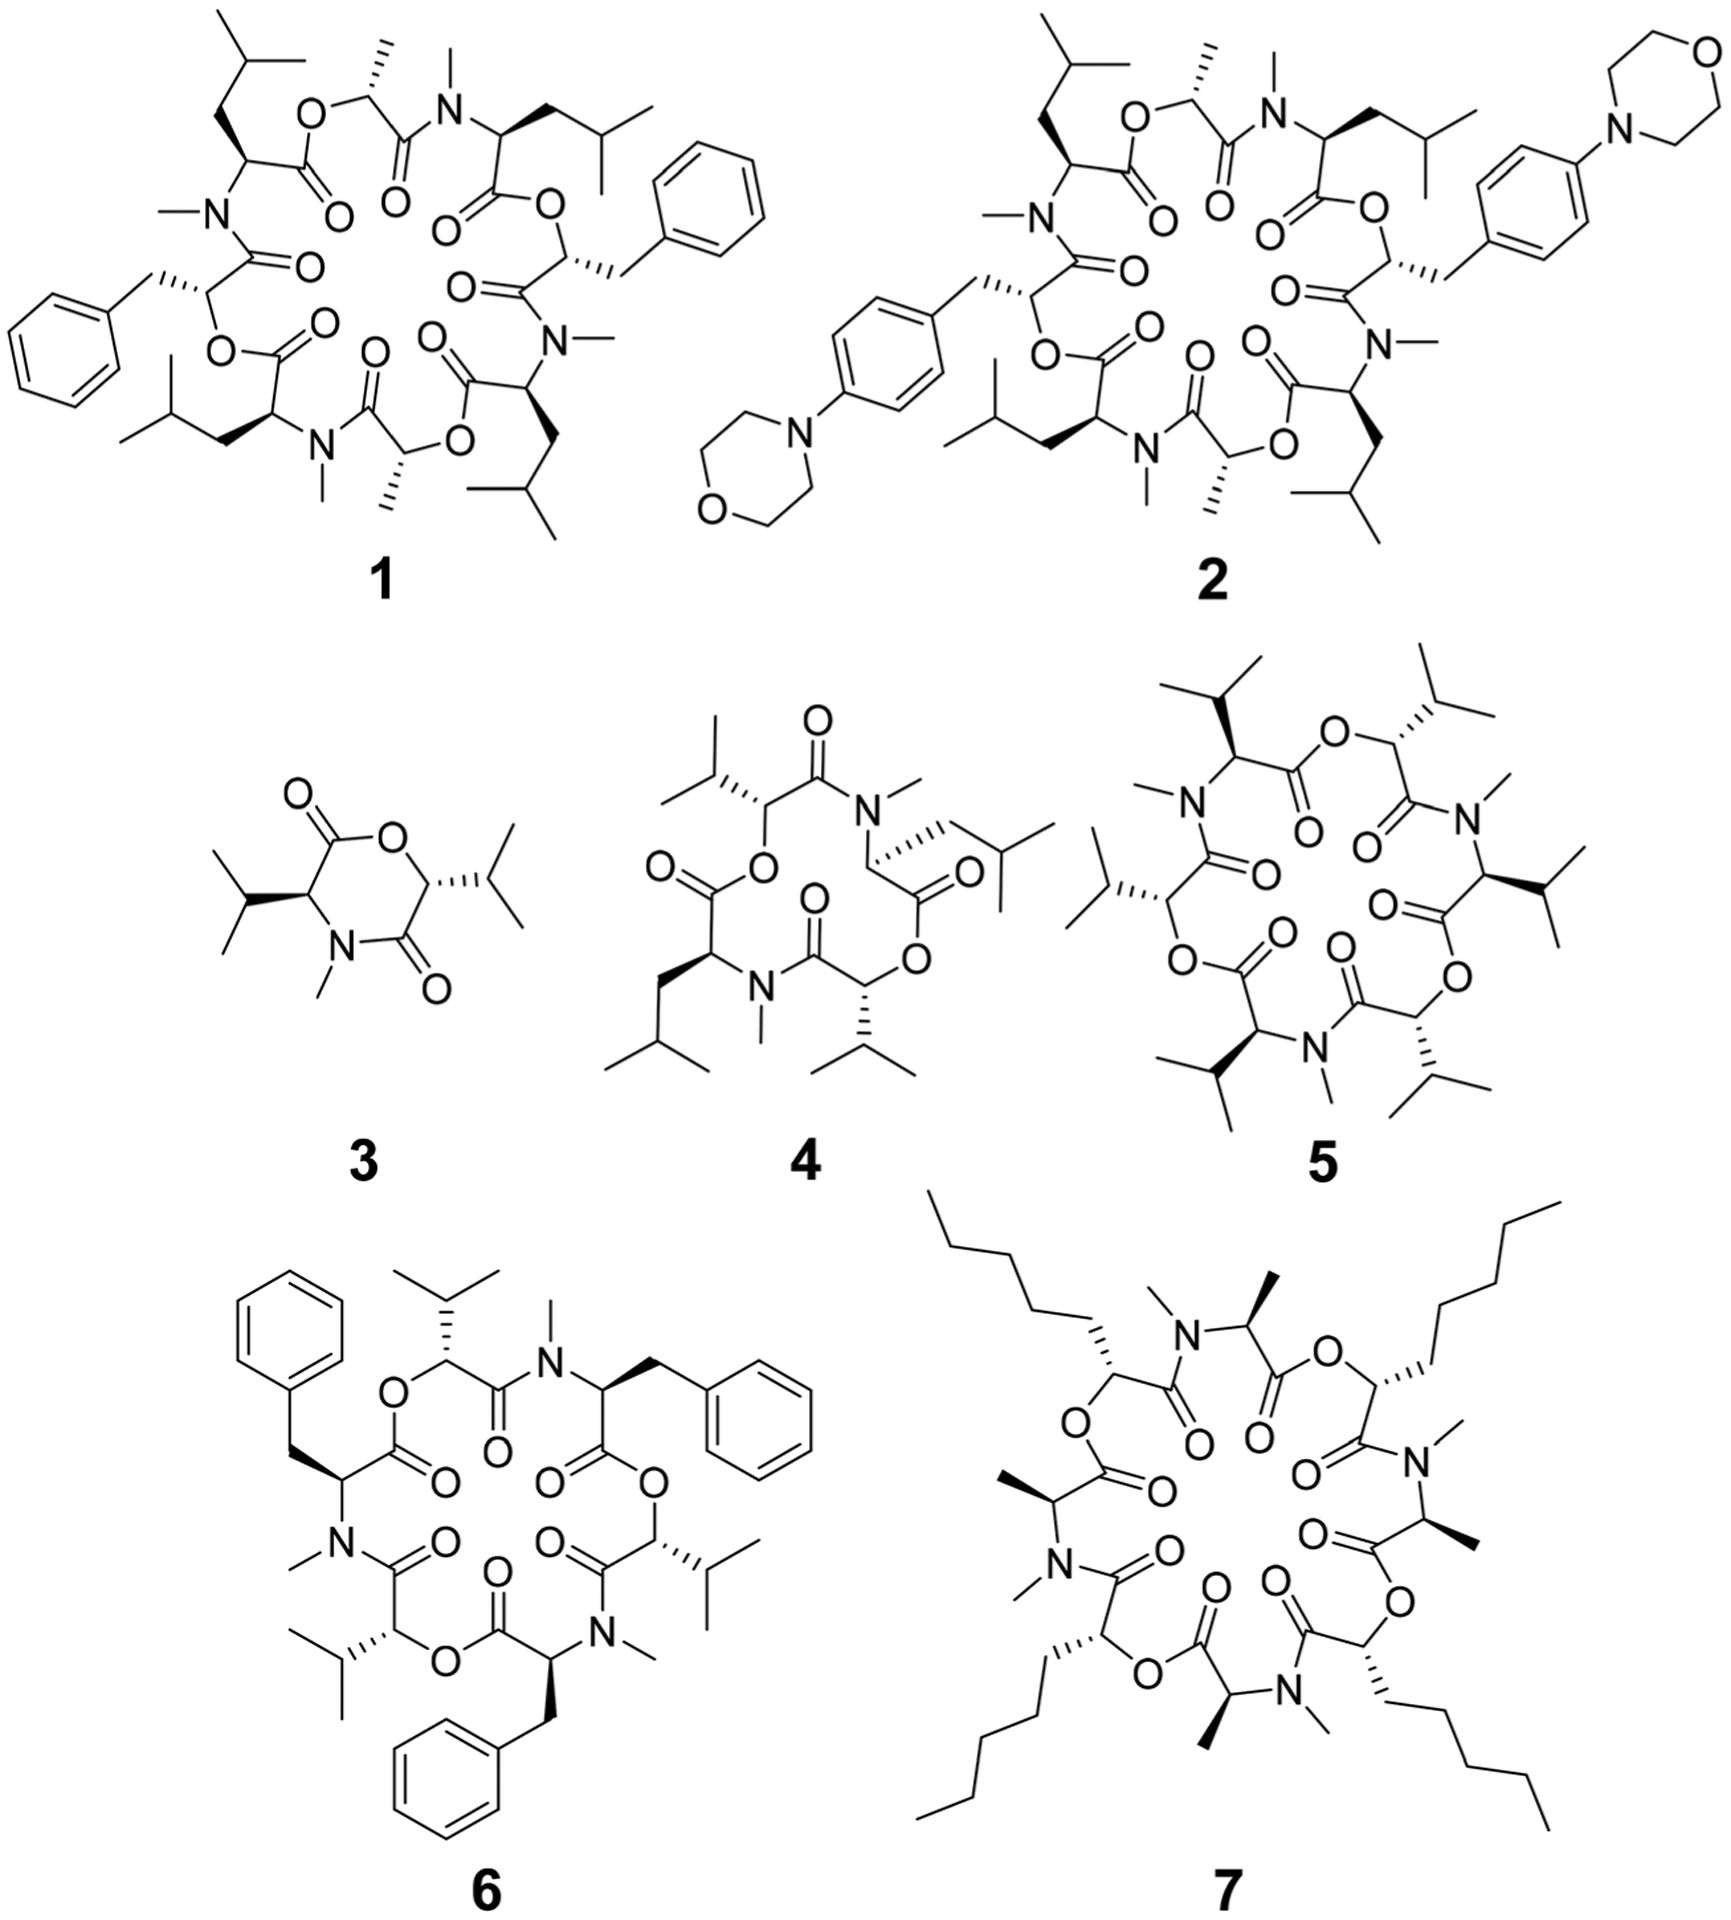
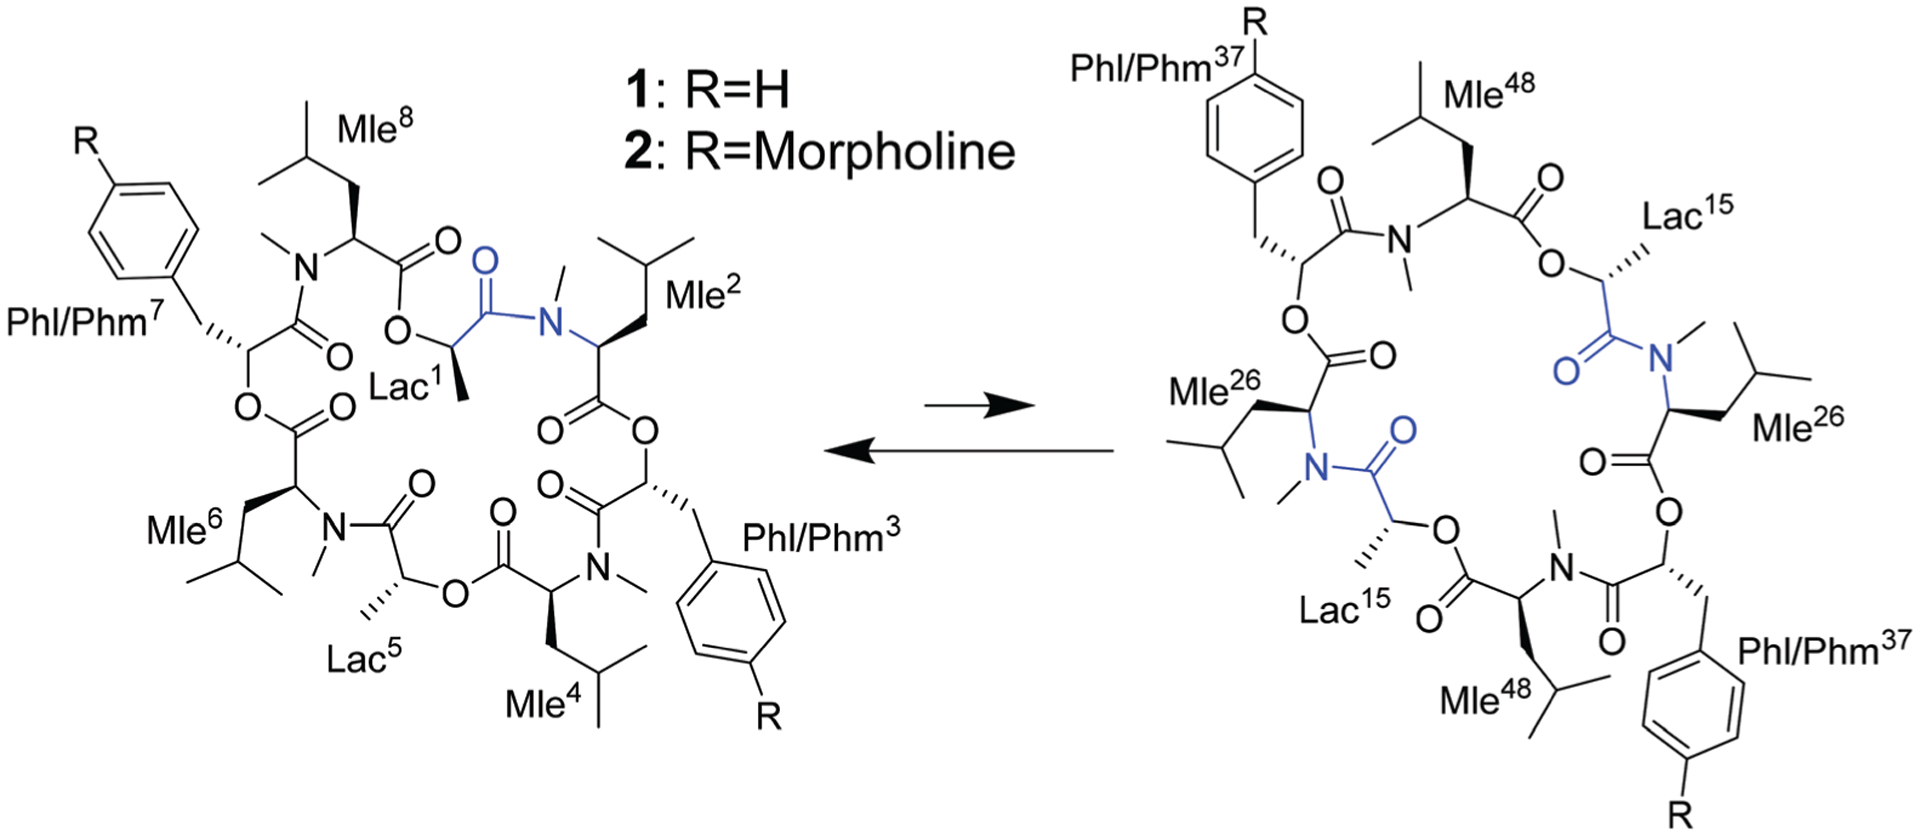
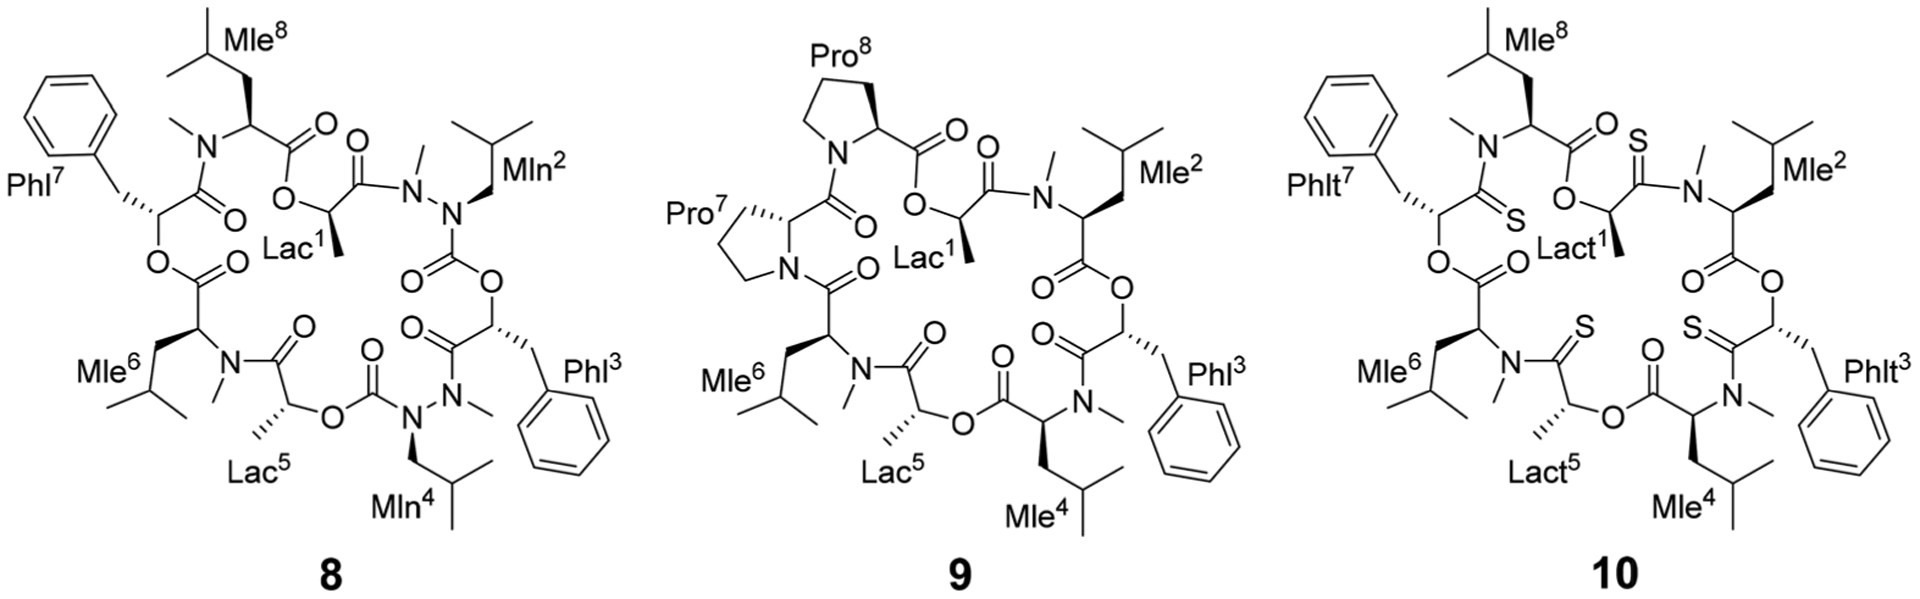
Cyclic octadepsipeptides such as PF1022A and its synthetic derivative emodepside exhibit anthelmintic activity with the latter sold as a commercial drug treatment against gastrointestinal nematodes for animal health use. The structure-permeability relationship of these cyclic depsipeptides that could ultimately provide insights into the compound bioavailability is not yet well understood. The fully N-methylated amide backbone and apolar sidechain residues do not allow for the formation of intramolecular hydrogen bonds, normally observed in the membrane-permeable conformations of cyclic peptides. Hence, any understanding gained on these depsipeptides would serve as a prototype for future design strategies. In previous nuclear magnetic resonance (NMR) studies, two macrocyclic core conformers of emodepside were detected, one with all backbone amides in trans-configuration (hereon referred as the symmetric conformer) and the other with one amide in cis-configuration (hereon referred as the asymmetric conformer). In addition, these depsipeptides were also reported to be ionophores with a preference of potassium over sodium. In this study, we relate the conformational behavior of PF1022A, emodepside, and closely related analogs with their ionophoric characteristic probed using NMR and molecular dynamics (MD) simulations and finally evaluated their passive membrane permeability using PAMPA. We find that the equilibrium between the two core conformers shifts more towards the symmetric conformer upon addition of monovalent cations with selectivity for potassium over sodium. Both the NMR experiments and the theoretical Markov state models based on extensive MD simulations indicate a more rigid backbone for the asymmetric conformation, whereas the symmetric conformation shows greater flexibility. The experimental results further advocate for the symmetric conformation binding the cation. The PAMPA results suggest that the investigated depsipeptides are retained in the membrane, which may be advantageous for the likely target, a membrane-bound potassium channel.


Conflict of interest statement

Conflicts of interest

There are no conflicts to declare.

Figures

Fig. 1
Fig. 1
Schematic drawing of the magnetization transfer pathways used for the analysis of the EXSY data for 1, 2 (left) and 8 (right). In the symmetric conformation of 1 and 2, one of the two chemically equivalent amide bonds can flip into a cis-configuration to reach the asymmetric conformation (amide bond between Lac15 and Mle26, see Scheme 1). In this process, magnetization is transferred via two different site-to-site pathways (A ↔ B and A ↔ C with kAB = kAC = k1 and kBA = kCA = k2), each leading to a separate set of EXSY cross-peaks. During a transition from the symmetric to the asymmetric conformation, each nucleus in a symmetric pair undergoes either pathway equally likely. In the reverse process from the asymmetric to the symmetric conformation a nucleus at site B will always follow A ↔ B whereas a nucleus at site C will always follow A ↔ C. As a consequence, the site-to-site exchange rates k1 and k2 for 1 and 2 differ from the mechanistic exchange rates: k1 = 2 × k1 and k2 = k2 where K = k1/k2. In 8, the C2 symmetry is broken by the two additional nitrogen atoms in the backbone and only a single magnetization transfer pathway has to be considered. Therefore for 8 k1 = k’1 and k2 = k’2.
Fig. 2
Fig. 2
13C T2 relaxation times measured for 20 mM PF1022A (1) in CDCl3 with a series of 13C-CPMG HSQC spectra with relaxation delays from 15.2 to 456 ms and with compensation of heating effects. Entries marked with * belong to partly overlapping peaks. The first two light grey bars belong to the asymmetric conformation (i.e. Lac1 Cα and Lac5 Cα) whereas the third bar (dark grey) belongs to the symmetric conformation (i.e. Lac15 Cα). Error bars indicate the 95% confidence interval of the fit.
Fig. 3
Fig. 3
Visualization of the MSMs of the asymmetric and symmetric subsets of PF1022A (1) in chloroform. For each conformational state, 50 randomly picked backbone structures are shown. The thickness of the circle surrounding the state indicates the corresponding population with state 1 as the least and state 7 as the most populated conformational state. Note that state 3 and 5 as well as state 6 and 7 are chemically the same due to the C2 symmetry of the symmetric conformation. The equilibrium populations are 7.4% and 11.9% for states 3 and 5, respectively, and 16.5% and 43.2% for states 6 and 7, respectively. A likely issue is that all simulations were started from the two available crystal structures. The arrows indicate the transition probabilities for state i going to state j within the chosen lag time (i.e. 10 ns). The arrow size corresponds to the magnitude of the probability. The subsets were analyzed separately because not enough transitions between symmetric and asymmetric conformers were observed.
Fig. 4
Fig. 4
Titration of 5 mM PF1022A (1) with a KSCN solution in CD3OH: Hα region of 1H NMR spectra. Chemical shift changes were observed for the symmetric conformation, best seen for the signal of the Hα proton in residue Phl37 (blue labels). In addition, a change in the ratio between the symmetric and asymmetric conformation is observed. Also the asymmetric conformation shows small changes in chemical shift at high salt concentrations. The titration plot for emodepside (2) can be found in the ESI.
Fig. 5
Fig. 5
Hα region of the 1H NMR spectra of a 5 mM solution of the bis-aza analog (8) without (bottom) and with 200 mM KSCN (top) in CD3OH. Chemical shift changes were observed for the asymmetric conformation. Compared to 1 and 2, the change in ratio between asymmetric and symmetric conformation is less pronounced and is close to 1 : 1 at a 40-fold excess of KSCN. Peaks of the symmetric conformation are marked in blue. The arrows indicate the movement of the asymmetric peaks upon addition of KSCN. On the right, the residual solvent peak is visible.
Fig. 6
Fig. 6
Titration of 5 mM PF1022A (1) (top) and 5 mM emodepside (2) (bottom) with different monovalent cations (CsSCN in grey, KSCN in blue, NaSCN in orange and NH4SCN in red) in CD3OH while the total volume was kept constant. The titration with CsSCN was only done up to 125 mM due to solubility issues. (Left): Change of the concentration of the symmetric conformation upon the addition of the corresponding salt. The data points were fitted with a damped logistic growth function (for details see ESI†). (Right): Change of the chemical shift of the Phl37/Phm37 Hα proton as a function of the salt concentration (for details of the fit, see ESI†). The plots were generated with R.
Fig. 7
Fig. 7
Comparison of 1H NMR spectra of the Hα region of PF1022A (1) in CDCl3 measured on a 500 MHz spectrometer. After the addition of KSCN and sonication, the symmetric conformation is present almost exclusively in solution. Note that the solution with the precipitate turned yellow.
Fig. 8
Fig. 8
Comparison of 1H NMR spectra of the Hα region of emodepside (2) in CDCl3 measured on a 600 MHz spectrometer. After mixing with a saturated KSCN solution in D2O, followed by sonication and phase separation, the symmetric conformation is present almost exclusively in solution.
Fig. 9
Fig. 9
(Top): Snapshot of the 1 : 1 complex from the MD simulation of a single molecule of 1 (left) and 2 (right) in chloroform in presence of a single potassium ion (pink). Both depsipeptides adopt a cavity-like conformation with the cation bound in the center. The same structure could be observed for 1 in methanol after longer simulation time. (Bottom): Snapshot of the 2 : 1 complex from the MD simulation of two molecules of 1 in chloroform in presence of a single potassium ion. Carbons are shown in green, nitrogen atoms in blue, oxygen atoms in red and potassium ions in pink The figures were generated with VMD.
Fig. 10
Fig. 10
Crystal structure of PF1022A (1) (CCDC number: 2004078†) crystallized in the asymmetric conformation. Carbon atoms are colored in grey, nitrogen atoms in light blue and oxygen in red. The ellipsoids represent 50% of probability level and hydrogen atoms are shown with a radius of 0.3 Å. One methanol molecule is co-crystalized and disordered. The figure was created with Mercury.
Fig. 11
Fig. 11
(Left): Crystal structure of a 2 : 3 complex of PF1022A (1) with KSCN (CCDC number: 2004087†). There are three potassium ions (purple) crystalized with two molecules of the peptide. Carbon atoms are depicted in grey, nitrogen atoms in light blue, oxygen atoms in red, sulphur atoms in yellow and hydrogen atoms in white. The ellipsoids represent 50% of probability level and hydrogen atoms are shown with a radius of 0.3 Å. One water molecule is co crystalized as well as some methanol. The figure was generated with Mercury. (Right): Simplified complex structure with only the non-hydrogen atoms present and without co-crystallized solvent molecules. Carbons are shown in green, nitrogen atoms in blue, oxygen atoms in red and potassium ions in pink. The figure was generated with VMD.
Fig. 12
Fig. 12
(Left): Chemical structure of the mono-iodine PF1022A analog 11. (Right): EASY-ROESY spectrum of the aromatic region of 5 mM of 11 with 125 mM CsSCN in CD3OH at room temperature with a mixing time of 700 ms. Only correlations within the aromatic rings were observed but no correlation between them.
Fig. 13
Fig. 13
Schematic EXSY spectrum with sites A (symmetric conformation), B and C (asymmetric conformation). A exchanges with B and C but B does not exchange with C.
Fig. 14
Fig. 14
Chapman-Kolmogorov test for the symmetric conformer of 1 in chloroform with 7 states and a lag time of 10 ns.
Scheme 1
Scheme 1
Chemical structures of cyclic depsipeptides PF1022A (1) consisting of four l-N-methyl leucines (Mle), two d-lactic acid moieties (d-Lac) and two d-phenyllactic acid moieties (d-Phl), its synthetic derivative emodepside (2) with two additional morpholine rings in para position of the phenyllactic acid residues (d-Phm), 3,6-di-(propan-2-yl)-4-methyl-morpholine-2,5-dione (3), cyclo-(N-methyl l-leucine d-hydroxyisovaleric acid)2 (4), enniatin B (5) consisting of three repetitions of l-N-methyl valine and d-hydroxyisovaleric acid, beauvericin (6) consisting of three repetitions of l-N-methyl phenylalanine and d-hydroxyisovaleric acid and verticilide (7) consisting of four repetitions of l-N-methyl alanine and d-2-hydroxyheptanoic acid.
Scheme 2
Scheme 2
Asymmetric (left) and symmetric (right) conformations of the two cyclic octadepsipeptides PF1022A (1) and emodepside (2) consisting of four l-N-methyl leucines (Mle), two d-lactic acid moieties (d-Lac) and two d-phenyllactic acid moieties (d-Phl) (with additional morpholine rings in para position in case of 2 (d-Phm)). In the C2 symmetric conformation, the chemically equivalent residues share a common designation derived from their position in the asymmetric conformation.
Scheme 3
Scheme 3
Chemical structures of the bis-aza PF1022A analog (8) in which two Cα carbons in N-methyl residues are replaced by nitrogens (Mln), of the di-proline PF1022A analog (9), in which residues 7 and 8 are replaced by a turn inducing d-Pro l-Pro moiety and of a tetra thioamide PF1022A analog (10) in which lactate and phenyllactic acid residues are replaced by their corresponding thio-analogs (Lact and Phlt).

Similar articles

Cited by

References

    1. Nielsen DS, Shepherd NE, Xu W, Lucke AJ, Stoermer MJ and Fairlie DP, Chem. Rev, 2017, 117, 8094–8128. - PubMed
    1. Wang X, Gong X, Li P, Lai D and Zhou L, Molecules, 2018, 23, 169. - PMC - PubMed
    1. Suarez-Jimenez GM, Burgos-Hernandez A and Ezquerra-Brauer JM, Mar. Drugs, 2012, 10, 963–986. - PMC - PubMed
    1. Andavan GSB and Lemmens-Gruber R, Mar. Drugs, 2010, 8, 810–834. - PMC - PubMed
    1. Sivanathan S and Scherkenbeck J, Molecules, 2014, 19, 12368–12420. - PMC - PubMed

MeSH terms