. 2020 Oct 5;152(10):e202012664.
doi: 10.1085/jgp.202012664.

Engineered high-affinity zinc binding site reveals gating configurations of a human proton channel

Affiliations

Engineered high-affinity zinc binding site reveals gating configurations of a human proton channel

Vladimir V Cherny et al. J Gen Physiol. .

Abstract

The voltage-gated proton channel (HV1) is a voltage sensor that also conducts protons. The singular ability of protons to penetrate proteins complicates distinguishing closed and open channels. When we replaced valine with histidine at position 116 in the external vestibule of hHV1, current was potently inhibited by externally applied Zn2+ in a construct lacking the two His that bind Zn2+ in WT channels. High-affinity binding with profound effects at 10 nM Zn2+ at pHo 7 suggests additional groups contribute. We hypothesized that Asp185, which faces position 116 in our closed-state model, contributes to Zn2+ chelation. Confirming this prediction, V116H/D185N abolished Zn2+ binding. Studied in a C-terminal truncated monomeric construct, V116H channels activated rapidly. Anomalously, Zn2+ slowed activation, producing a time constant independent of both voltage and Zn2+ concentration. We hypothesized that slow turn-on of H+ current in the presence of Zn2+ reflects the rate of Zn2+ unbinding from the channel, analogous to drug-receptor dissociation reactions. This behavior in turn suggests that the affinity for Zn2+ is greater in the closed state of hHV1. Supporting this hypothesis, pulse pairs revealed a rapid component of activation whose amplitude decreased after longer intervals at negative voltages as closed channels bound Zn2+. The lower affinity of Zn2+ in open channels is consistent with the idea that structural rearrangements within the transmembrane region bring Arg205 near position 116, electrostatically expelling Zn2+. This phenomenon provides direct evidence that Asp185 opposes position 116 in closed channels and that Arg205 moves between them when the channel opens.


Figures

Figure 1.
Figure 1.
Location of key amino acids in an hHV1 dimer model. Homology model of the closed hHV1 dimer (Li et al., 2015) is shown in side view (left) and top view (right), where top corresponds to the extracytoplasmic side. Transmembrane helices are shown as pipes; connecting loops are shown as ribbons. The S1, S2, S3, and S4 helices are indicated in red, yellow, green, and blue, respectively. The hydrophobic gasket residues V109 (on S1), F150 (on S2), and V177 and V178 (on S3) are indicated in brown ball-and-sticks. Note that for clarity the side view is truncated above the strongest coiled-coil interaction of the C termini of the protomers.
Figure 2.
Figure 2.
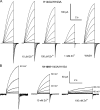
Zn2+ binds very weakly to hHV1 with His140 and His193 removed, but with extraordinarily high affinity when His is introduced at position 116 (V116H). (A) The H140A/H193A background for dimer studies lacks the two His critical for Zn2+ binding and is insensitive to Zn2+ up to 100 µM. Families of currents in 10-mV increments up to +40 mV are shown for the indicated concentrations of Zn2+, all at pHo 7, pHi 6.5. (B) Extreme Zn2+ sensitivity of V116H mutant in the H140A/H193A background. Families of currents at pHo 7, pHi 7 showing that 10 nM Zn2+ produces distinct inhibition. It is evident that in addition, τact is slowed and the gH-V relationship is shifted positively.
Figure 3.
Figure 3.
The kinetics of activation is not changed in the Zn2+-insensitive H140A/H193A mutant. Turn-on of current was fitted with a single exponential. Direct comparison at pHo 7 and pHi 6.5 is shown, along with pH 7//7 WT data (from Cherny et al., 2015) for reference. Mean ± SEM is plotted for numbers of cells from negative to positive voltages: WT 5, 10, 12, 11, 11, 9, 10, and 3; and H140A/H193A 4, 6, 9, 9, 9, 6, 6, and 4. Although the values at −20 mV are just “significantly” different at P = 0.026, this is obviously a statistical aberration.
Figure 4.
Figure 4.
Comparison of Zn2+ inhibition of proton current in V116H, D185N, and WT hHV1 and in the Zn2+-insensitive H140A/H193A background. Inhibition of H+ current by Zn2+ at +60 mV in the V116H/H140A/H193A mutant (●), WT hHV1 (▪), V116H/H140A/D185N/H193A (♦), and background construct H140A/H193A (▴). The mean ± SEM ratio of test pulse current in the presence of Zn2+ to its absence is plotted. Solid symbols and lines show measurements at pHo 7, open symbols and dashed lines at pHo 6. For concentrations <1 µM, Zn2+ was buffered with ADA. Numbers of cells, from low to high [Zn2+], for V116H are 6, 3, and 6 at pHo 7; 3, 3, and 8 at pHo 6; for WT 13, 10 and 7 at pHo 7; 4, 6, 5, 4, and 1 at pHo 6; for V116H/D185N 3, 4, and 4 at pHo 7; 4, 4, 4, and 3 at pHo 6; and for H140A/H193A 2, 5, 6, 4, and 1 at pHo 7; 3, 3, 3, 3, and 3 at pHo 6.
Figure 5.
Figure 5.
Map of key amino acids in closed and open hHV1 models. (A and B) Alpha carbons of S2 helices (yellow ribbon) of closed (A, left) and open (B, right) homology models of human HV1 (Li et al., 2015) were superimposed using the Matchmaker program in Chimera (resource for Biocomputing, Visualization, and Informatics, University of California, San Francisco, San Francisco, CA; supported by NIGMS P41-GM103311; Pettersen et al., 2004) and are shown at the same viewing angle. S1, S2, S3, and S4 helices are indicated as red, yellow, green, and blue ribbons, respectively. The hydrophobic gasket residues V109 (on S1), F150 (on S2), and V177 and V178 (on S3) are indicated in brown.
Figure 6.
Figure 6.
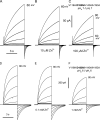
Addition of the D185N mutation eliminates the Zn2+ sensitivity of V116H in the H140A/H193A background. (A–C) A cell at pHo 7, pHi 7 is distinctly inhibited by 100 µM Zn2+. Families were generated by pulses from Vhold = −40 mV in 10-mV increments from −10 mV up to the voltage indicated. (D–F) A different cell at pHo 6, pHi 6 is inhibited only at 1 mM Zn2+. Families were generated by pulses from Vhold = −40 mV in 10-mV increments from 0 mV up to +80 mV.
Figure 7.
Figure 7.
The monomeric construct is insensitive to Zn2+. Zn2+ exerted minimal effects on the background construct used in this study, in which the two His that bind Zn2+ in WT channels were replaced with Ala, and the C terminus was truncated at position T222 (so that the final amino acid was K221).
Figure 8.
Figure 8.
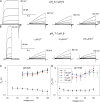
Activation kinetics in the absence of Zn2+ in V116H/H140A/H193A constructs used here. Values for τact (mean ± SEM) are plotted for dimeric (blue) and monomeric (red) V116H mutants at pHo 7 (solid symbols and lines) and pHo 6 (open symbols and dashed lines), all with pHi 6. For comparison, τact from WT hHV1 is plotted (green) at pHo 7, pHi 7 (from Cherny et al., 2015), as well as the single mutant V116H at pH pHo 7 and pHi 7 (purple hexagons). It should be noted that τact with pHi 7 is substantially slower than with pHi 6. Numbers of cells starting at the most negative voltage are WT 3, 3, 6, 9, 11, 12, 12, 12, 12, 8, and 6; pHo 7 dimer 3, 4, 4, 4, 4, 4, and 3; pHo 6 dimer 4, 4, 4, 4, and 4; pHo 7 monomer 5, 8, 9, 10, 10, 10, 10, 7, and 3; and pHo 6 monomer 3, 3, 14, 15, 15, 15, 13, 4, and 3.
Figure 9.
Figure 9.
In the V116H monomer, the turn-on of current in the presence of Zn2+ is practically independent of both voltage and Zn2+ concentration. (A and B) Families of currents are shown at pHo 6 (A) and pHo 7 (B), both with pHi 6, in the indicated concentrations of Zn2+ with pulses applied in 10-mV increments up to the voltage shown. (C and D) The τact values (mean ± SEM) from these cells are shown in the absence (●) or presence of Zn2+ in concentrations indicated in the inset to D. Every τact value at every voltage is significantly (P < 0.05) higher in Zn2+ than in control in C and D except two values at +60 mV in D. Numbers of cells at pHo 6 are control 3–10, 100 nM Zn2+ 2–7, 1 µM Zn2+ 2–8, 10 µM Zn2+ 3–6, and 100 µM Zn2+ 3–5; numbers of cells at pHo 7 are control 3–7, 100 nM Zn2+ 2 or 3, 1 µM Zn2+ 2–4, and 10 µM Zn2+ 3. The control values are a subset of those plotted in Fig. 8; here, we include only cells in which we also had τact data in Zn2+.
(Scheme 1)
(Scheme 1)
Figure 10.
Figure 10.
Families of currents in the V116H monomer at pH 6//6. (A and B) Pulses are in 10-mV increments from Vhold = −40 mV to +90 mV. Note that there is a distinct rapidly rising phase in A at 100 nM Zn2+ but not in B at 10 µM Zn2+. (C) In the same cell, currents at +90 mV are superimposed in the presence of the indicated Zn2+. The fast component is only detectable at low [Zn2+].
Figure 11.
Figure 11.
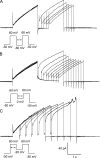
Pulse pair experiments in the V116H monomer (V116H/H140A/H193A/T222stop) reveal two components of “activation.” (A and B) Panels differ only in the interpulse voltages of −60 mV or 0 mV, respectively. (C) The first pulse duration was varied. All measurements were from a cell at pHo 7, pHi 6 with 1 µM Zn2+.

Comment in

Similar articles

Cited by

References

    1. Alberts I.L., Nadassy K., and Wodak S.J.. 1998. Analysis of zinc binding sites in protein crystal structures. Protein Sci. 7:1700–1716. 10.1002/pro.5560070805 - DOI - PMC - PubMed
    1. Almers W. 1978. Gating currents and charge movements in excitable membranes. Rev. Physiol. Biochem. Pharmacol. 82:96–190. 10.1007/BFb0030498 - DOI - PubMed
    1. Auld D.S. 2001. Zinc coordination sphere in biochemical zinc sites. Biometals. 14:271–313. 10.1023/A:1012976615056 - DOI - PubMed
    1. Banh R., Cherny V.V., Morgan D., Musset B., Thomas S., Kulleperuma K., Smith S.M.E., Pomès R., and DeCoursey T.E.. 2019. Hydrophobic gasket mutation produces gating pore currents in closed human voltage-gated proton channels. Proc. Natl. Acad. Sci. USA. 116:18951–18961. 10.1073/pnas.1905462116 - DOI - PMC - PubMed
    1. Barish M.E., and Baud C.. 1984. A voltage-gated hydrogen ion current in the oocyte membrane of the axolotl, Ambystoma. J. Physiol. 352:243–263. 10.1113/jphysiol.1984.sp015289 - DOI - PMC - PubMed

Publication types