. 2021 Feb 4;137(5):624-636.
doi: 10.1182/blood.2020007748.

Targeting a cytokine checkpoint enhances the fitness of armored cord blood CAR-NK cells

Affiliations

Targeting a cytokine checkpoint enhances the fitness of armored cord blood CAR-NK cells

May Daher et al. Blood. .

Erratum in

Abstract

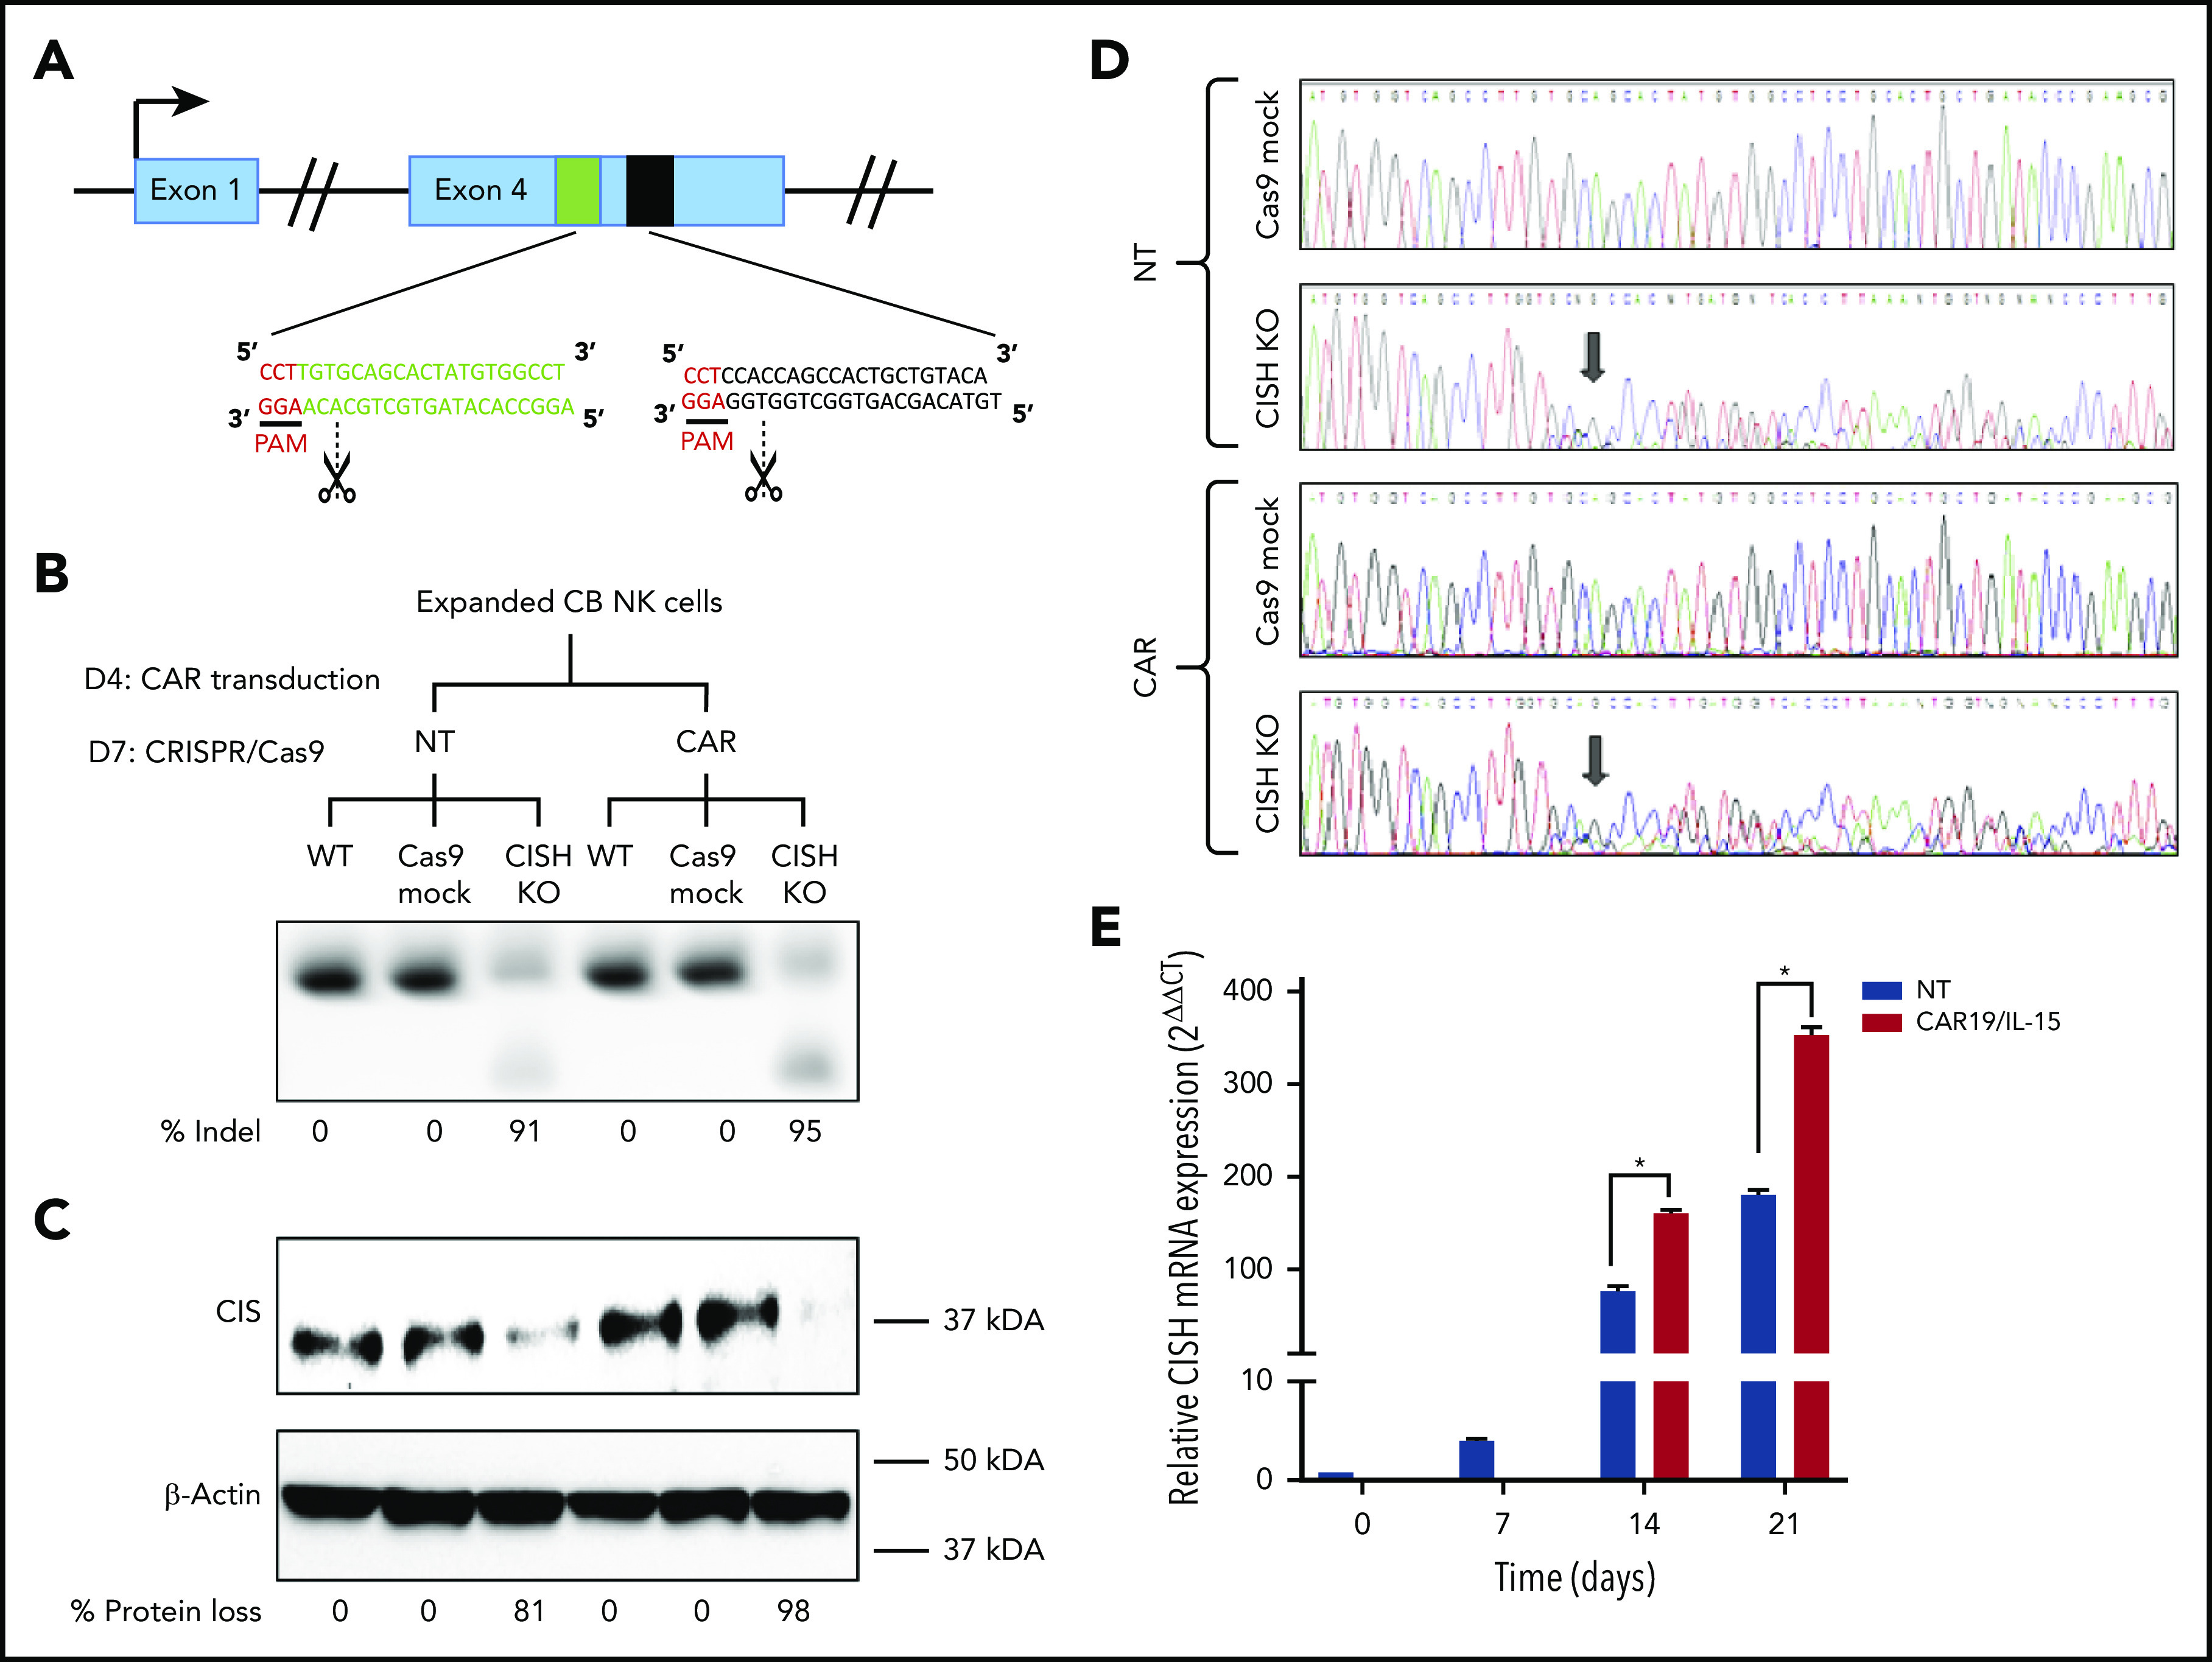
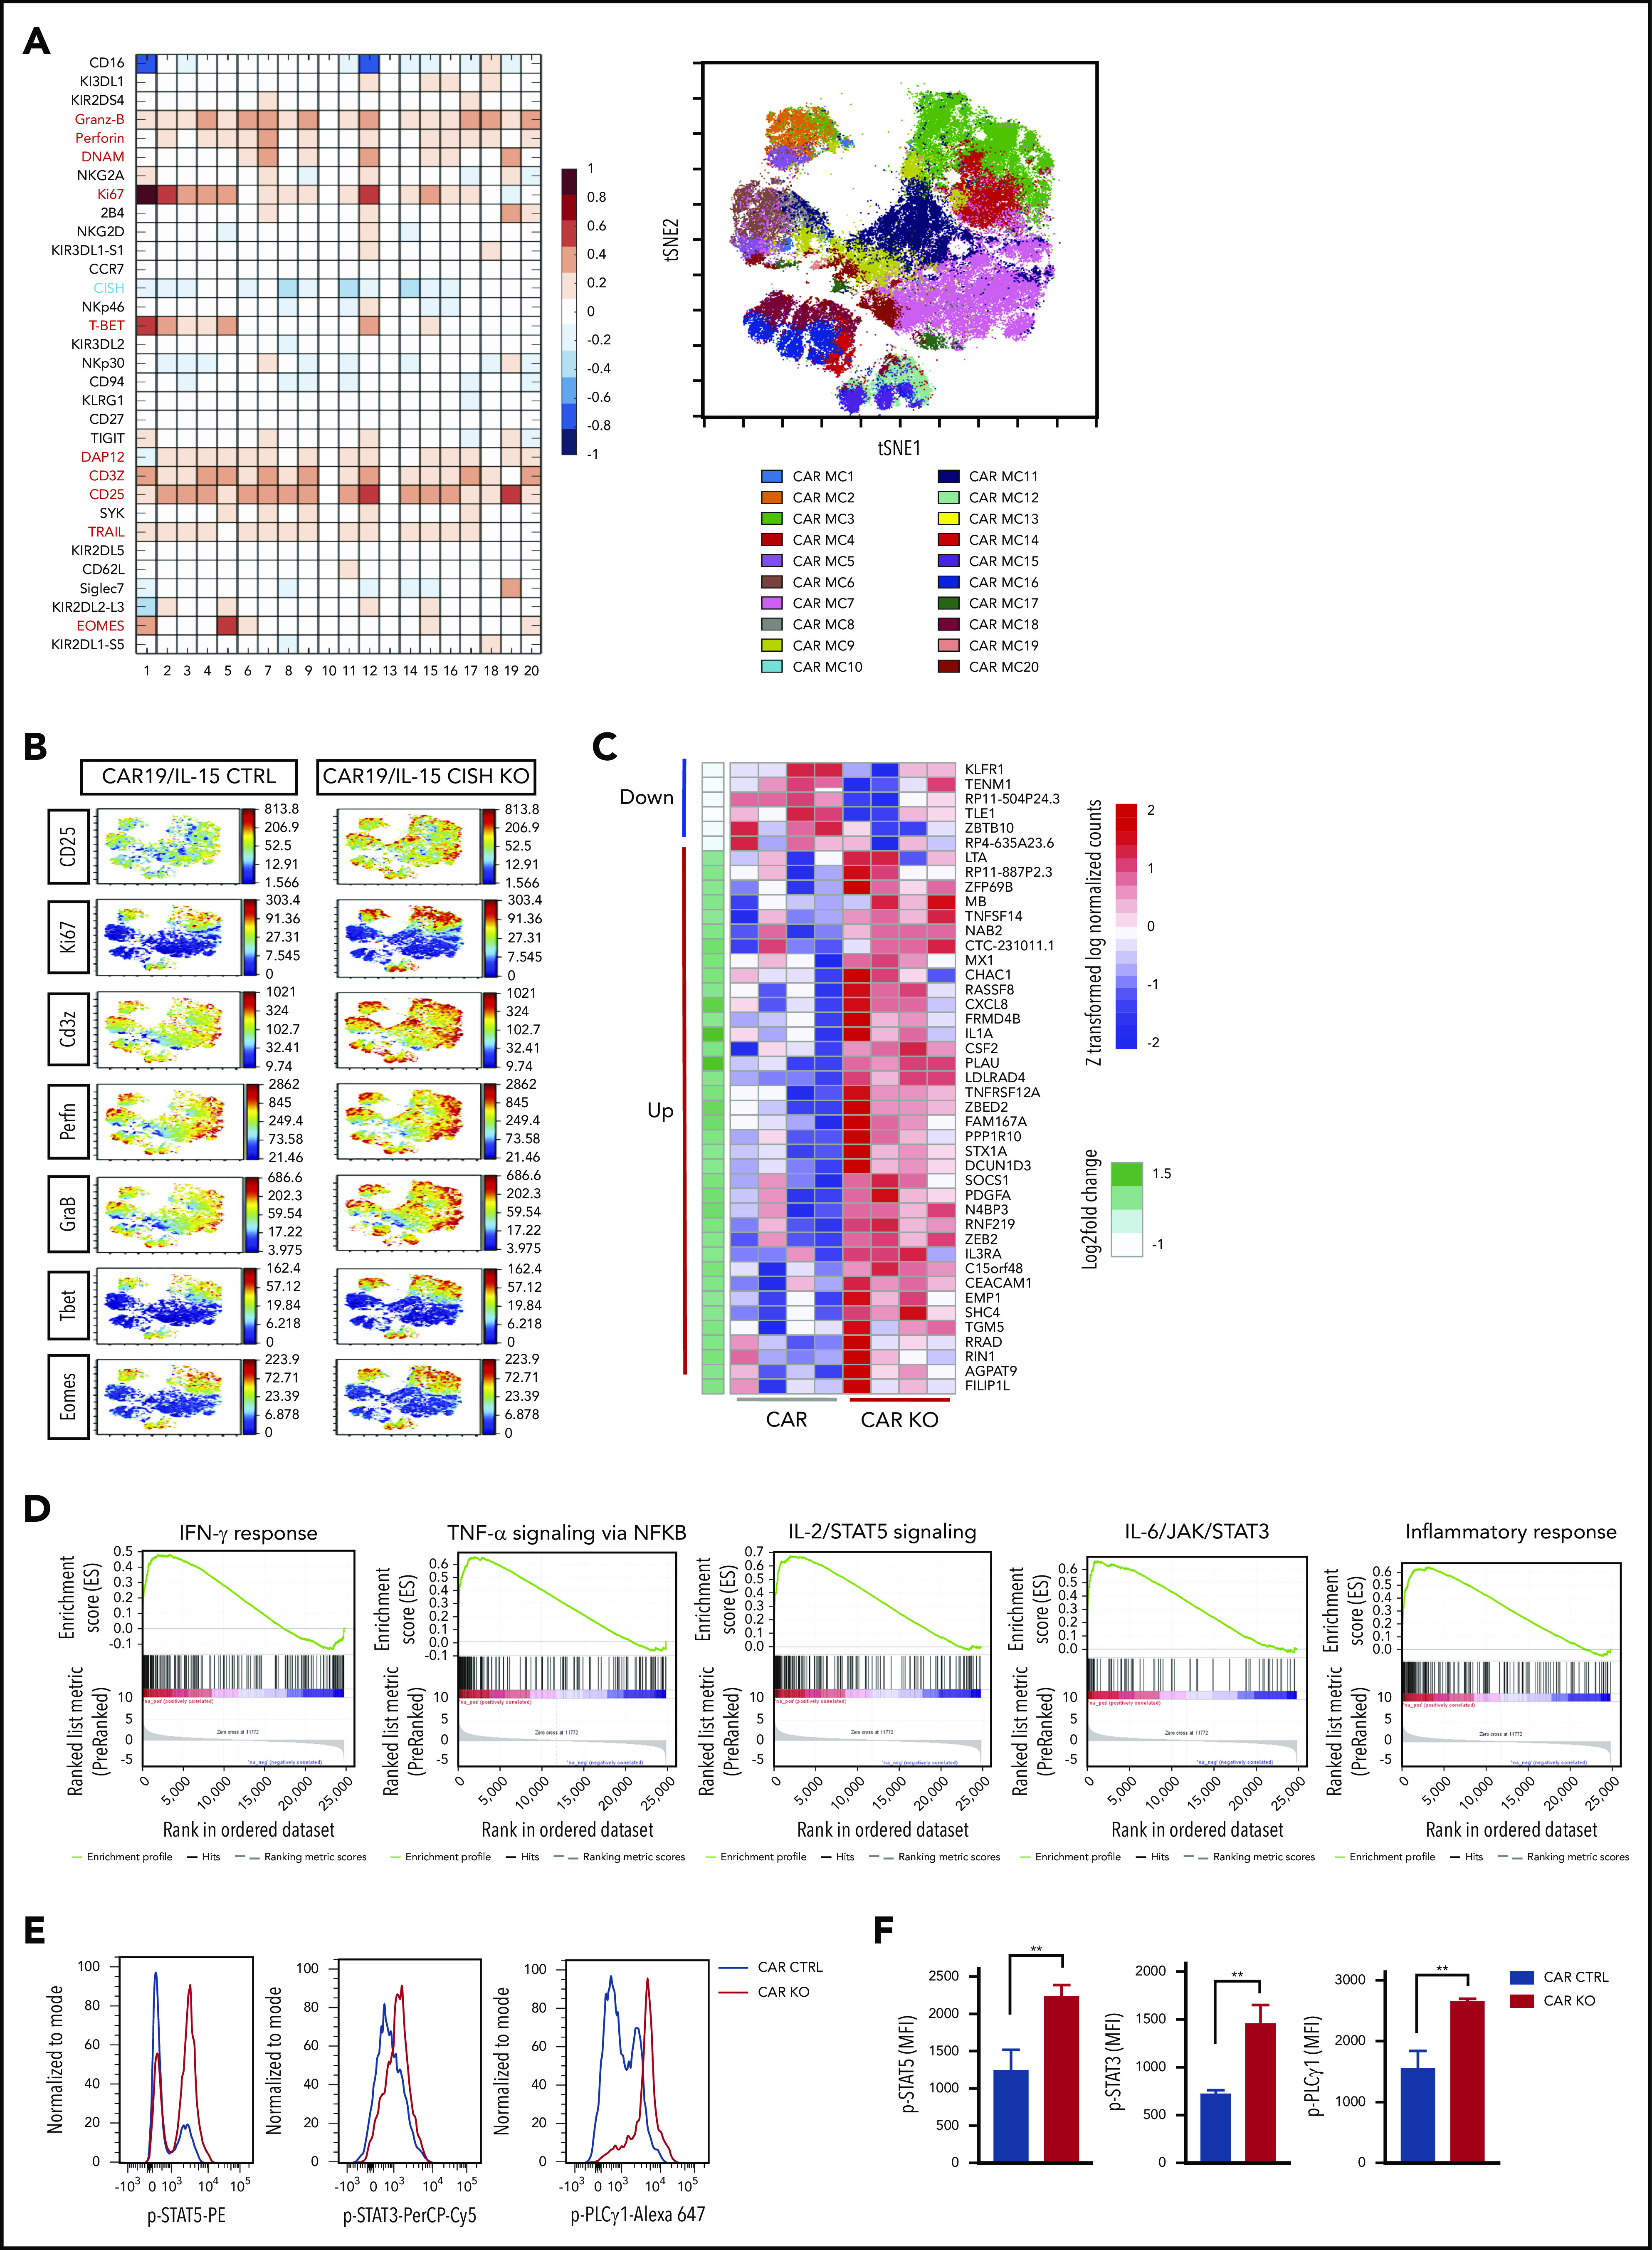
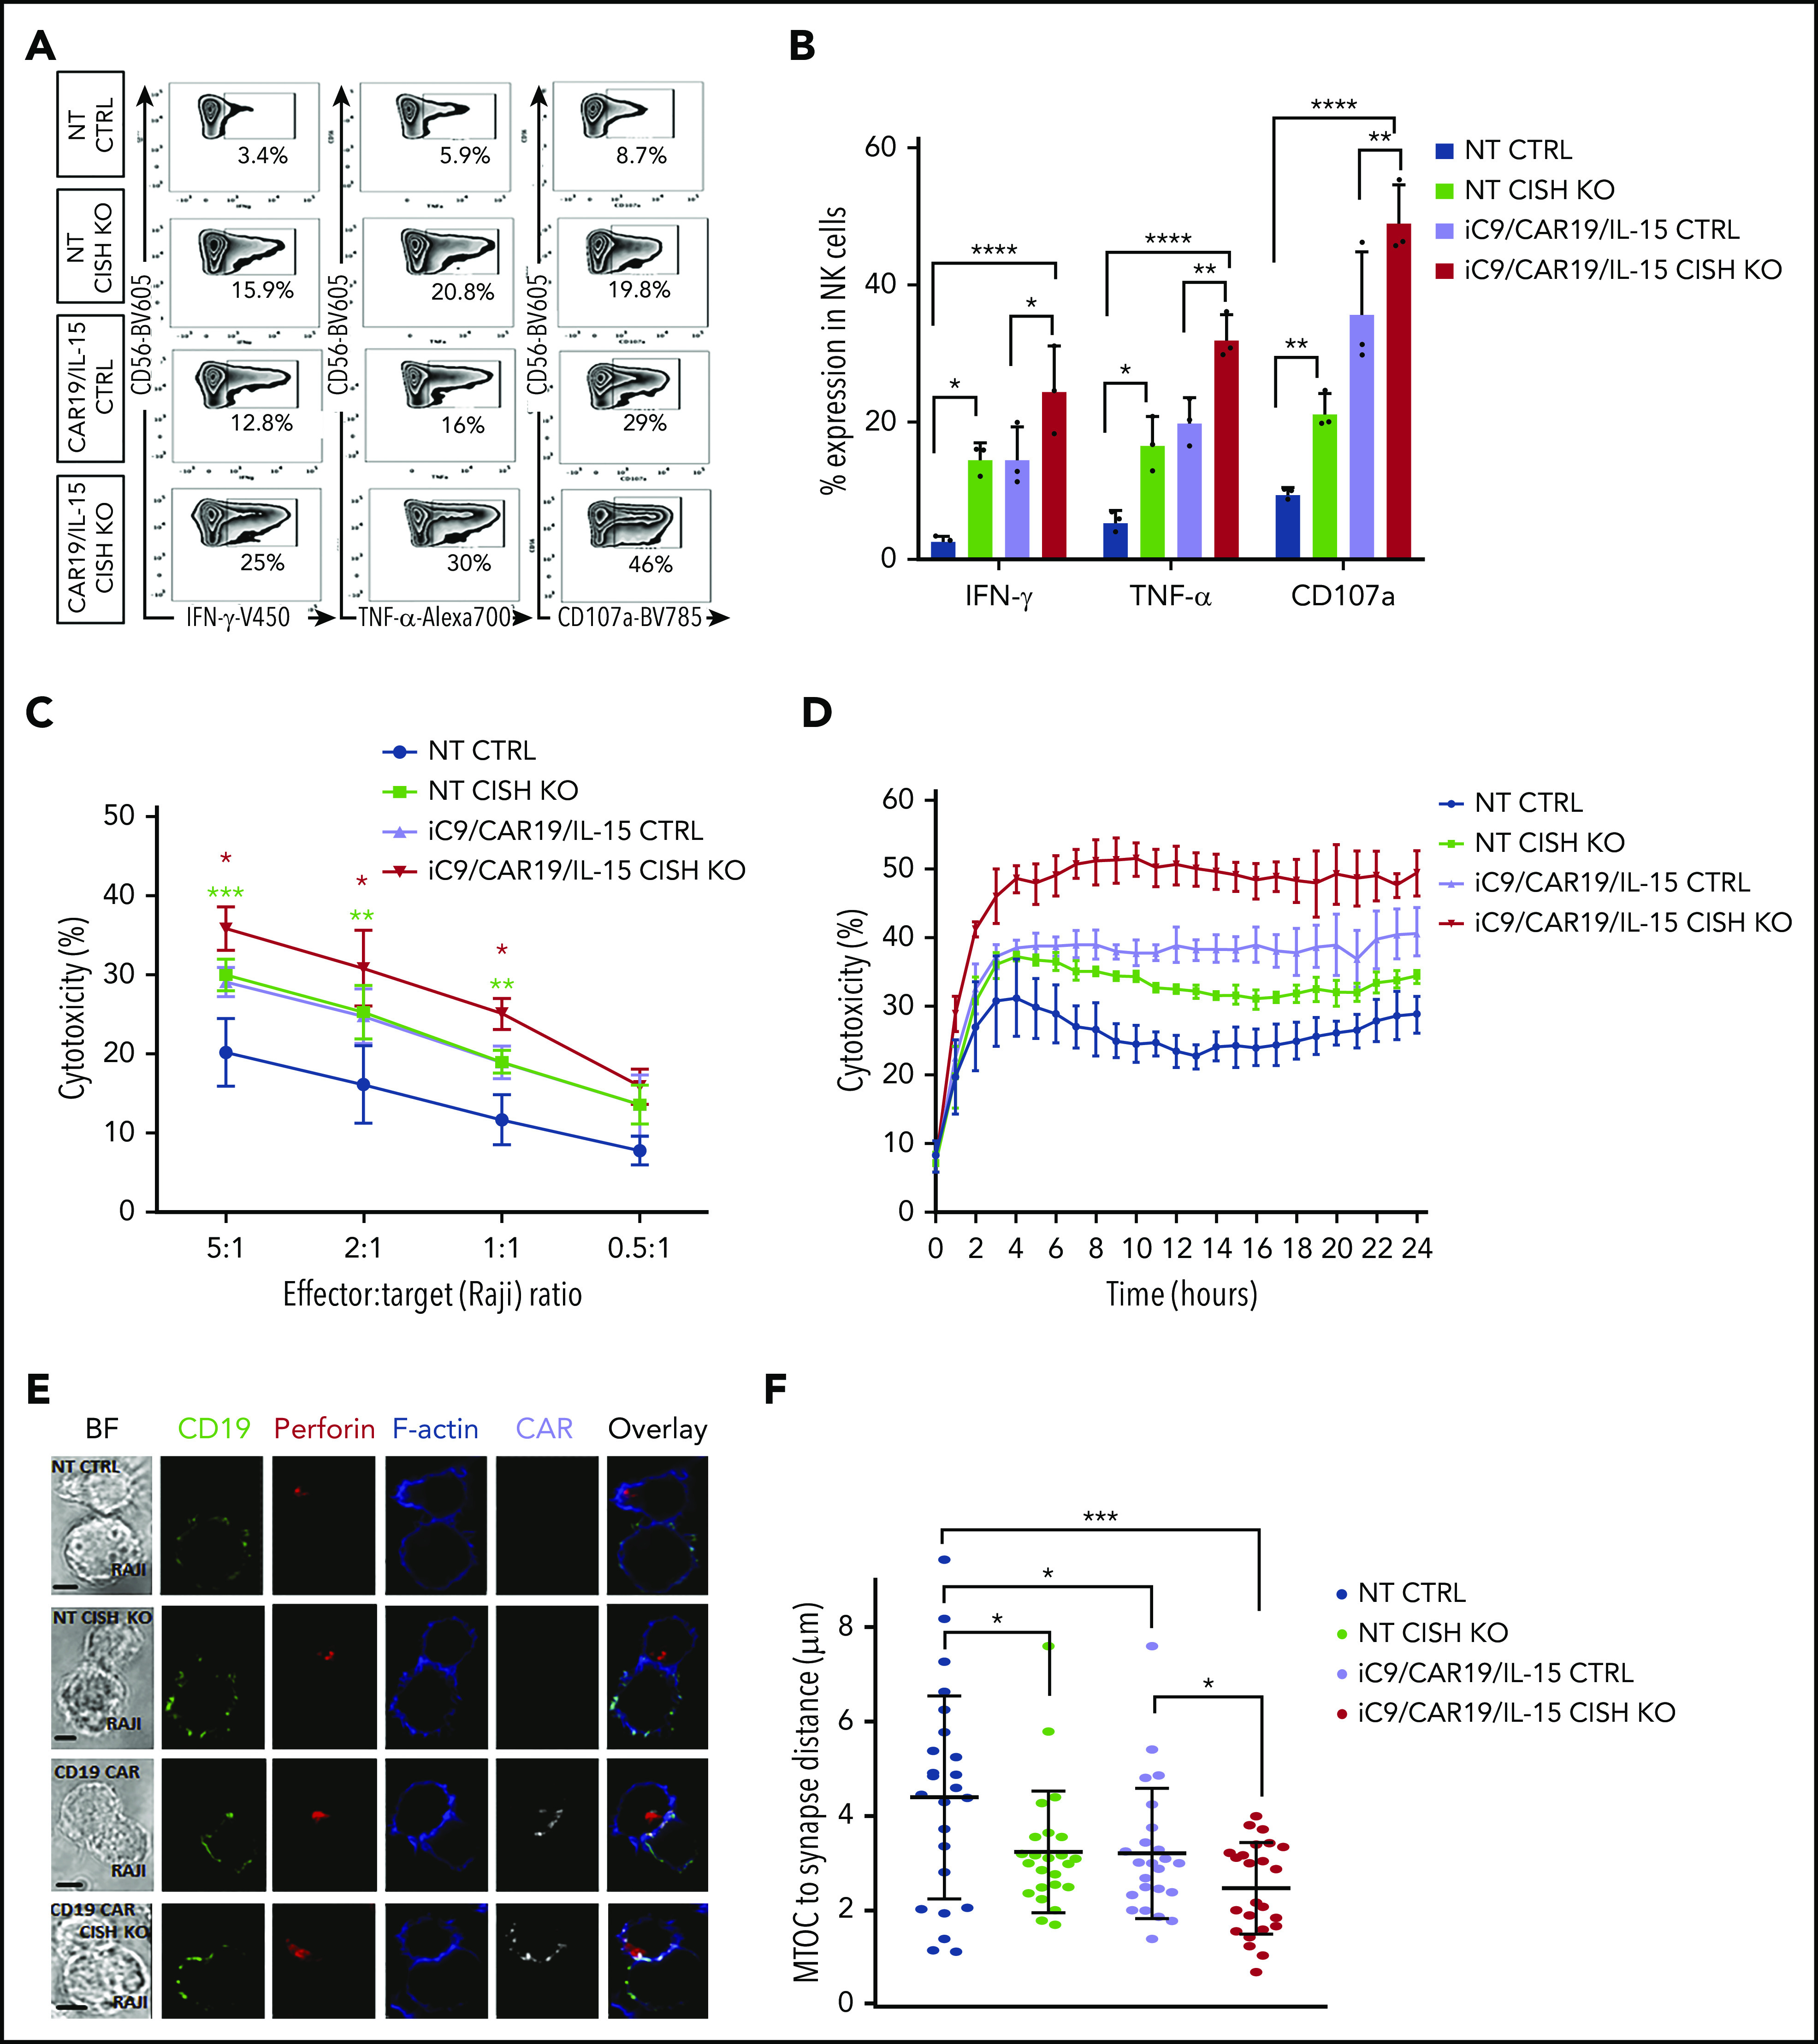
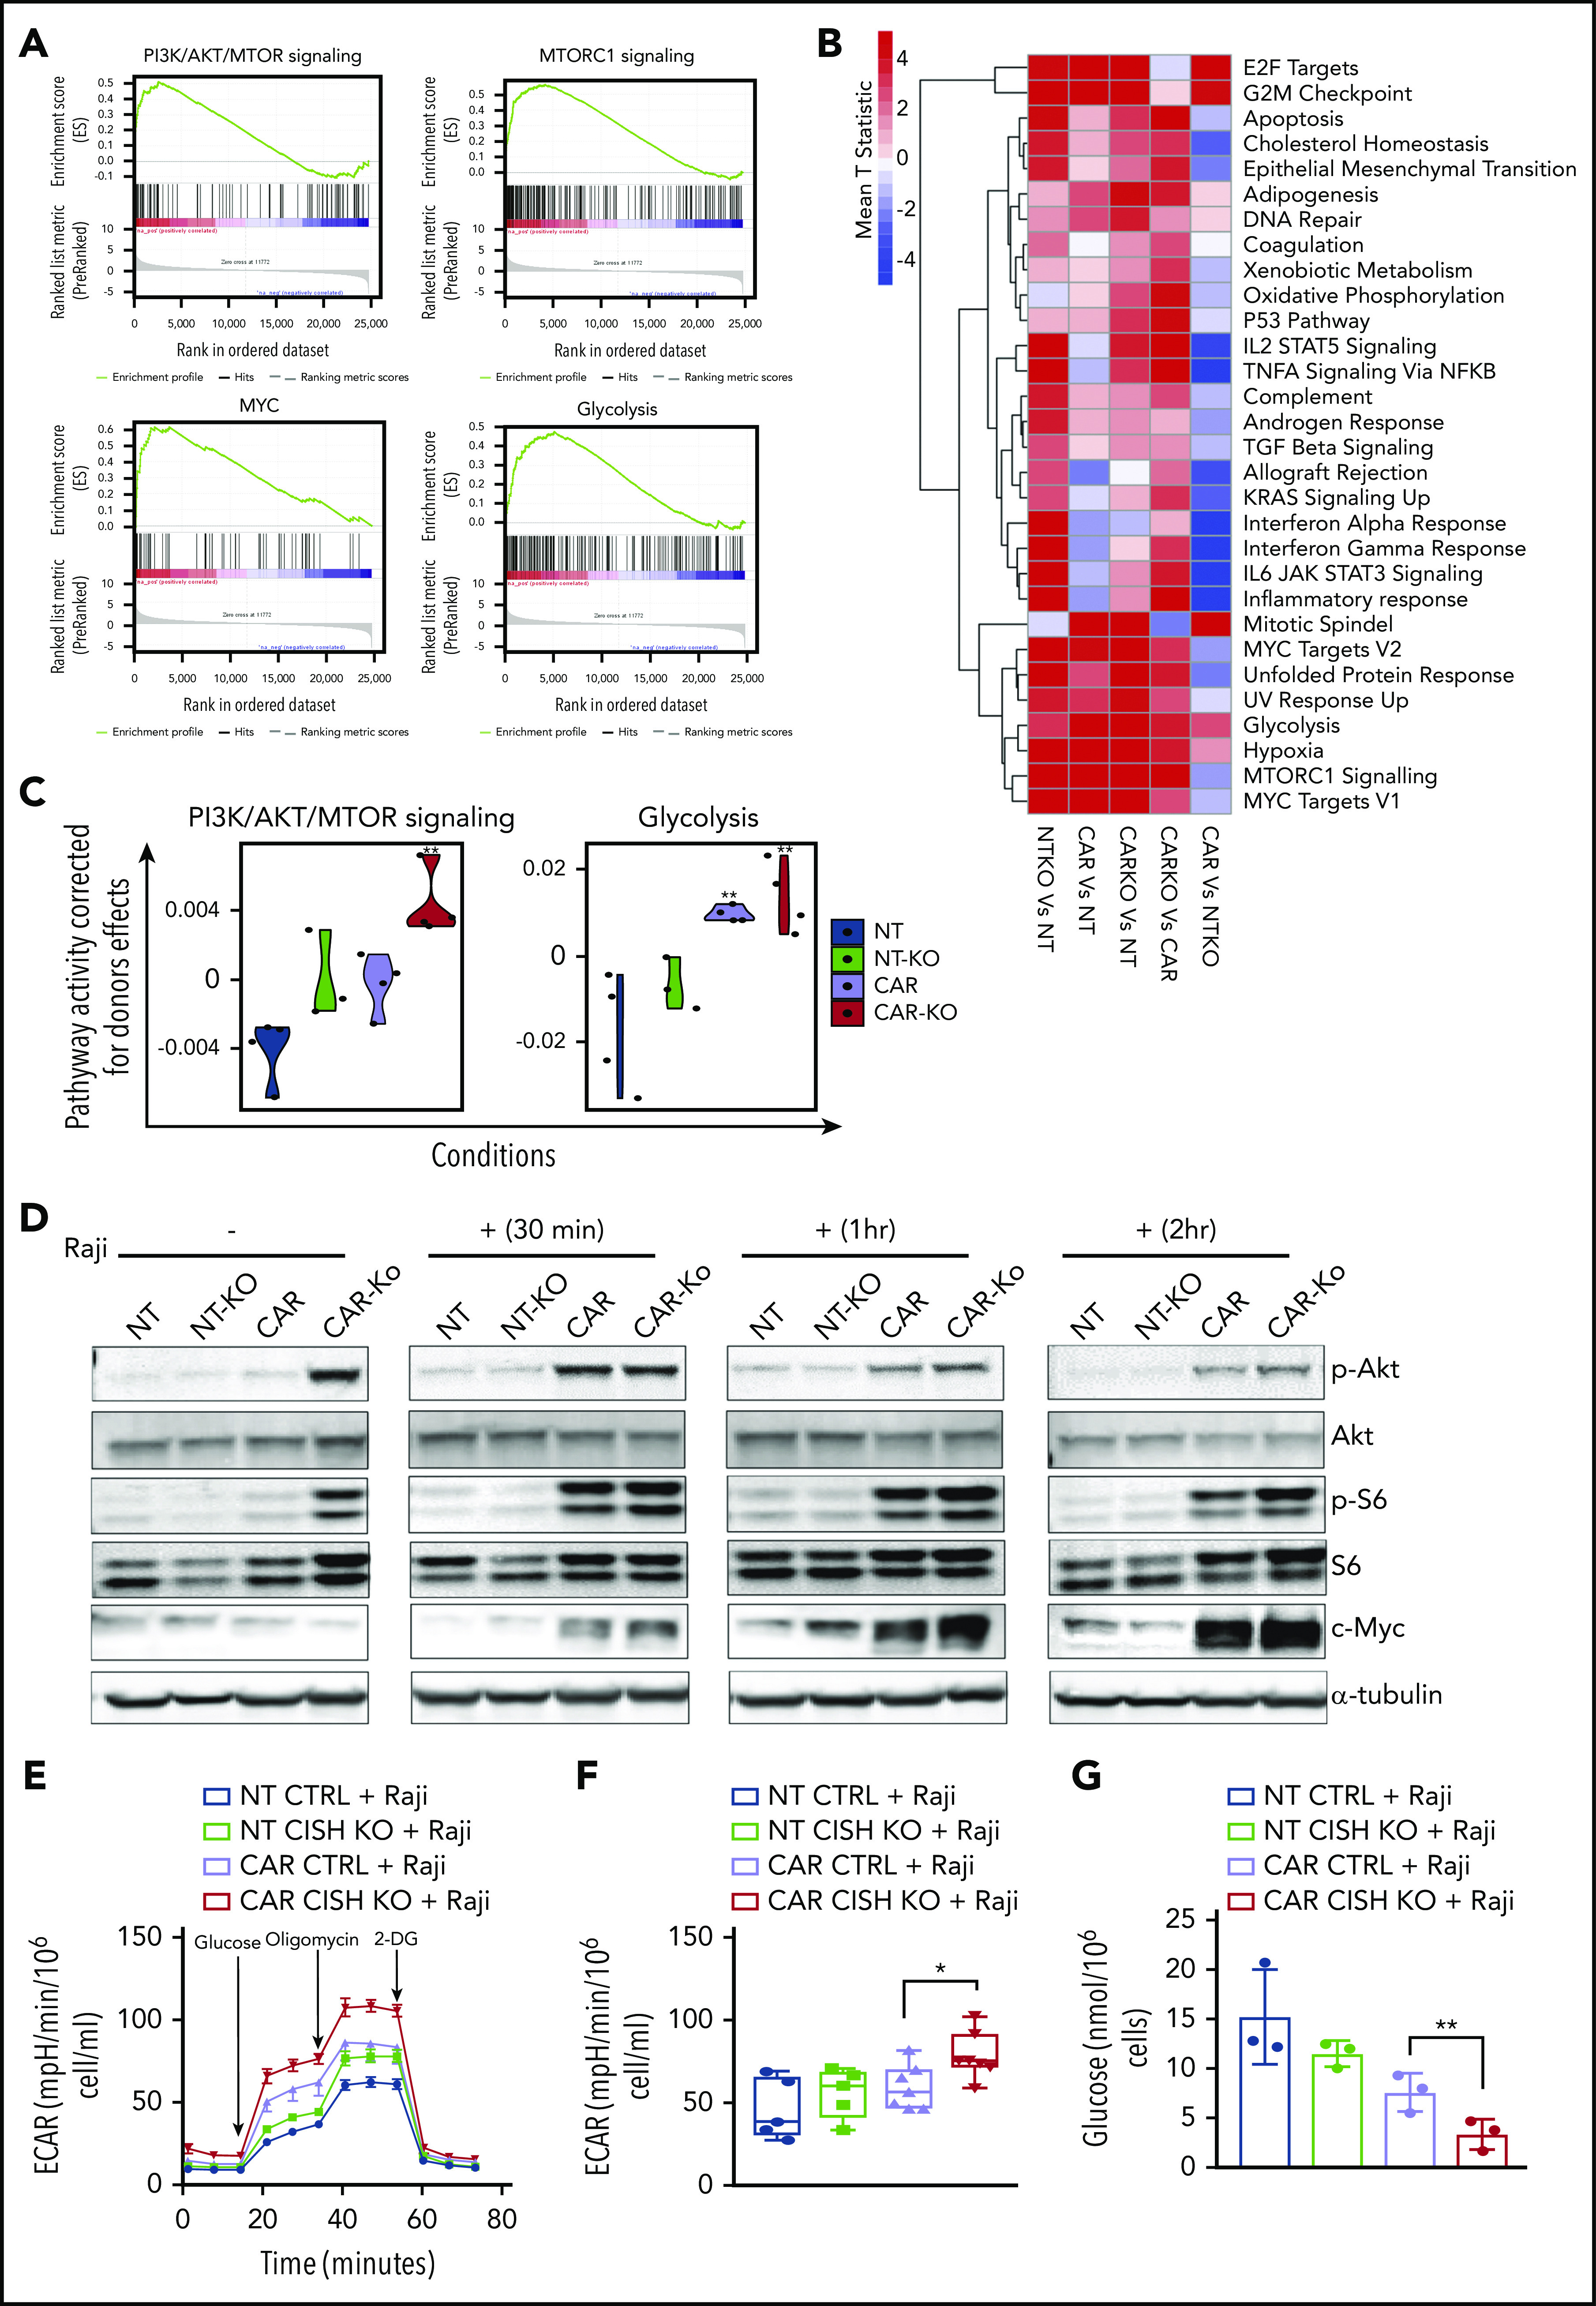
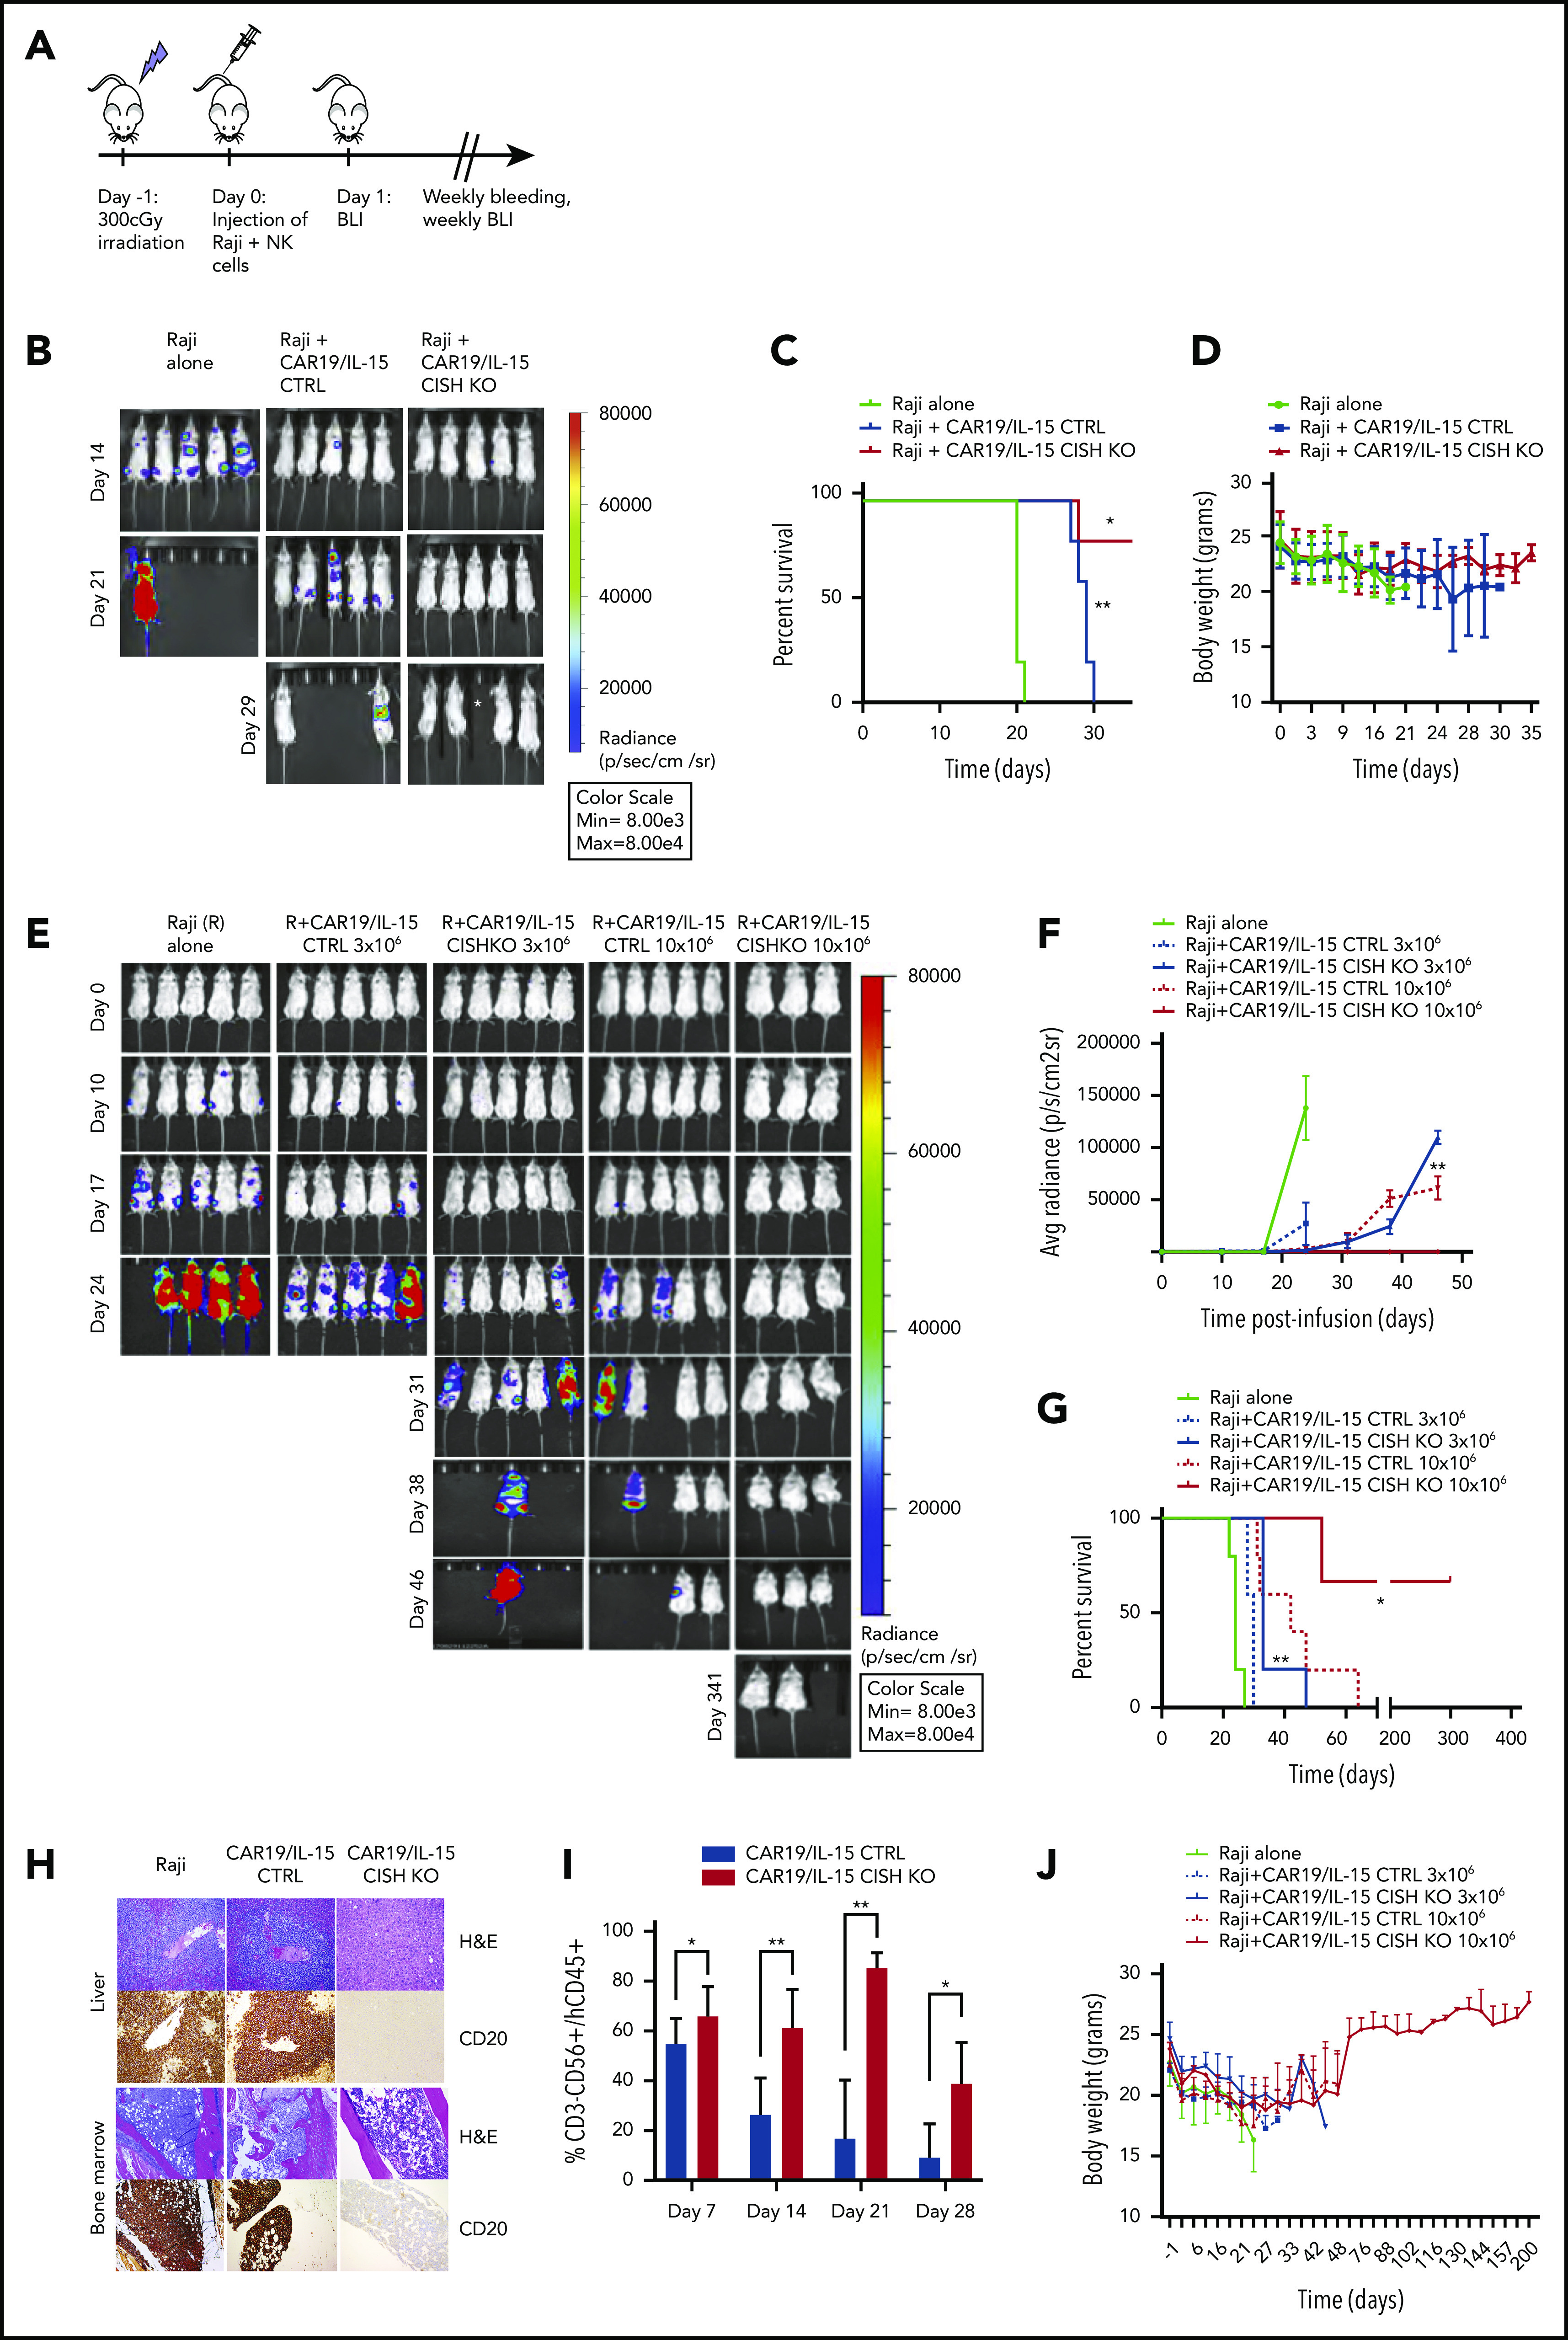
Immune checkpoint therapy has resulted in remarkable improvements in the outcome for certain cancers. To broaden the clinical impact of checkpoint targeting, we devised a strategy that couples targeting of the cytokine-inducible Src homology 2-containing (CIS) protein, a key negative regulator of interleukin 15 (IL-15) signaling, with fourth-generation "armored" chimeric antigen receptor (CAR) engineering of cord blood-derived natural killer (NK) cells. This combined strategy boosted NK cell effector function through enhancing the Akt/mTORC1 axis and c-MYC signaling, resulting in increased aerobic glycolysis. When tested in a lymphoma mouse model, this combined approach improved NK cell antitumor activity more than either alteration alone, eradicating lymphoma xenografts without signs of any measurable toxicity. We conclude that targeting a cytokine checkpoint further enhances the antitumor activity of IL-15-secreting armored CAR-NK cells by promoting their metabolic fitness and antitumor activity. This combined approach represents a promising milestone in the development of the next generation of NK cells for cancer immunotherapy.


Conflict of interest statement

Conflict-of-interest disclosure: K.R., M.D., R.B., P.P.B., E.L., E.J.S, R.E.C., D.M., and The University of Texas MD Anderson Cancer Center (MDACC) have an institutional financial conflict of interest with Takeda Pharmaceutical for the licensing of the technology related to the research reported here. MDACC has implemented an Institutional Conflict of Interest Management and Monitoring Plan to manage and monitor the conflict of interest with respect to MDACC’s conduct of any other ongoing or future research related to this relationship. M.A.B., M.S.S., G.R.R., M.S.M., G.K., and R.T. are employed by IDT, which manufactures reagents similar to some described in the paper; M.A.B., M.S.M., R.T., and G.R.R. own equity in DHR, the parent company of IDT. H.L. is a consultant for IDT. The remaining authors declare no competing financial interests.

Figures

None
Graphical abstract
Figure 1.
Figure 1.
CRISPR-Cas9–mediated deletion of CISH in iC9/CAR19/IL-15 NK cells. (A) Schematic representation of CRISPR-Cas9–mediated CISH KO using 2 guide RNAs (gRNA) targeting exon 4 of the CISH gene. PAM, protospacer-adjacent motif. (B-C) CB-NK cells were expanded with K562 based feeder cells and IL-2 and then either left NT or transduced with a retroviral vector expressing iC9/CAR19/IL-15 construct on day 4 (D4) of expansion. On day 7 (D7) of expansion, NT and iC9/CAR19/IL-15–expressing CB-NK cells were nucleofected with Cas9 alone (Cas9 mock), Cas9 preloaded with gRNA targeting CISH exon 4 (CISH KO), or nonnucleofected (wild-type [WT]). The CISH KO efficiency was determined by PCR (B) and western blot analysis (C). (D) Sanger sequencing results showing multiple peaks reflecting nonhomologous end-joining (NHEJ) events in NT or iC9/CAR19/IL-15 (CAR) NK cells that underwent CISH KO compared with single peaks in control (Cas9 mock). Arrows indicate the base pair position where the gene editing started. (E) Bar graphs showing the relative mRNA expression levels of CISH determined on days 0, 7, 14, and 21 of expansion in NT (blue) and iC9/CAR19/IL-15 (red) NK cells by reverse transcription polymerase chain reaction (RT-PCR) (n = 3). Note that on days 0 and 7 only data for NT-NK cells are included since the CAR transduction step is performed on day 4 of expansion. 18 S ribosomal RNA (18S) was used as the internal reference gene. Bars represent mean values with standard deviation, *P ≤ .05.
Figure 2.
Figure 2.
Phenotype and molecular signature of iC9/CAR19/IL-15 CISH KO NK cells. (A) Comparative heatmap of mass cytometry data showing the expression of NK cell surface markers, transcription factors, and cytotoxicity markers in iC9/CAR19/IL-15 CISH KO compared with iC9/CAR19/IL-15 control NK cells. Each column represents a separate cluster identified by FlowSOM analysis, and each row reflects the expression of a certain marker for each annotation. Color scale shows the expression level for each marker, with red representing higher expression and blue lower expression in iC9/CAR19/IL-15 CISH KO NK cells. The t-SNE map generated from FlowSOM analysis in the right panel shows the 20 NK cell metaclusters (MCs) represented in the mass cytometry heatmap in the left panel. (B) Individual t-SNE maps show the expression of selected NK cell markers for iC9/CAR19/IL-15 CISH KO compared with iC9/CAR19/IL-15 control NK cells. Color scale indicates signal intensity, ranging from low (blue) to high (red) after arcsine transformation. (C) Global gene expression analysis by RNA sequencing. Heatmap displays the genes that were differentially expressed in purified iC9/CAR19/IL-15 CISH KO vs iC9/CAR19/IL-15 control NK cells (n = 4). Color scale shows the expression level of each marker, with red representing higher expression and blue lower expression in iC9/CAR19/IL-15 control (CAR) or iC9/CAR19/IL-15 CISH KO (CAR KO) NK cells (q < 0.1 and absolute log2foldchange > 0.8). (D) GSEA showing enrichment in IFN-γ response, TNF-α signaling via NF-κB, IL-2/STAT5 signaling, IL-6/JAK/STAT3 signaling and inflammatory response in iC9/CAR19/IL-15 CISH KO compared with iC9/CAR19/IL-15 control NK cells. (E) Representative histogram showing enhanced phosphorylation of STAT5 (p-STAT5), STAT3 (p-STAT3) and phospholipase C γ 1 (p-PLCγ1) in iC9/CAR19/IL-15 CISH KO vs iC9/CAR19/IL-15 control NK cells after coculture with Raji cells for 30 minutes. Blue histograms represent CAR control, and red histograms represent CAR CISH KO. (F) Bar graphs showing mean fluorescence intensity (MFI) of p-STAT5, p-STAT3, and p-PLCγ1 in iC9/CAR19/IL-15 CISH KO vs iC9/CAR19/IL-15 control NK cells (n = 3). Blue bars represent CAR control and red bars represent CAR CISH KO. Bars represent mean values with standard deviation. **P ≤ .01.
Figure 3.
Figure 3.
CISH deletion improves function and cytotoxicity of NT and iC9/CAR19/IL-15 NK cells. (A) Representative FACS plots of cytokine production (IFN-γ and TNF-α) and CD107a degranulation by NT control, NT CISH KO, iC9/CAR19/IL-15 control, or iC9/CAR19/IL-15 CISH KO NK cells after coculture with Raji target cells for 6 hours. Inset values indicate the frequency of IFN-γ–, TNF-α–, and CD107a-positive cells from each group. (B) Bar plots summarize the flow cytometry data on cytokine production (IFN-γ and TNF-α) and CD107a degranulation by NT control (blue bars), NT CISH KO (green bars), iC9/CAR19/IL-15 control (purple bars) or iC9/CAR19/IL-15 CISH KO NK cells (red bars) after coculture with Raji target cells for 6 hours (n = 3). Statistical significance is indicated as *P ≤ .05, **P ≤ .01, and ****P ≤ .0001; bars represent mean values with standard deviation. (C) Cytotoxicity of NT control, NT CISH KO, iC9/CAR19/IL-15 control, or iC9/CAR19/IL-15 CISH KO NK cells against Raji targets at different effector-to-target (E:T) ratios, as measured by 51Cr-release assay (n = 3). The bars represent mean values with standard deviation. The red asterisks represent the statistical significance between iC9/CAR19/IL-15 CISH KO vs iC9/CAR19/IL-15 control NK cells (*P ≤ .05). The green asterisks represent the statistical significance between NT CISH KO vs NT control NK cells (***P ≤ .001; **P ≤ .01). (D) Cytotoxicity of NT control, NT CISH KO, iC9/CAR19/IL-15 control, or iC9/CAR19/IL-15 CISH KO NK cells against Raji targets over 24 hours at 1:1 E:T ratio as measured by Incucyte live-imaging cell killing assay (n = 3). Bars represent mean values with standard deviation. At 10 hours, NT CISH KO vs NT control (P = .04), iC9/CAR19/IL-15 CISH KO vs iC9/CAR19/IL-15 control (P = .007). (E) Confocal microscopy showing representative synapse images of NT control, NT CISH KO, iC9/CAR19/IL-15 control or iC9/CAR19/IL-15 CISH KO NK cells conjugated with Raji cells. Images show conjugates in bright field (BF) or stained with anti-CD19 (green), anti-perforin (red), phalloidin-F-actin (blue), and anti-CAR (gray), and an overlay of fluorescence channels are also shown. (F) NT control, NT CISH KO, iC9/CAR19/IL-15 control, or iC9/CAR19/IL-15 CISH KO NK cells were assessed for their ability to polarize lytic granules to Raji cells as measured by distance from the MTOC to the IS. Results from 3 independent donors are shown. Each data point represents a single IS. Statistical significance is indicated as *P ≤ .05 and ***P ≤ .001.
Figure 4.
Figure 4.
Metabolic changes associated with iC9/CAR19/IL-15 CISH KO NK cells. (A) GSEA plots showing enrichment in PI3K/Akt/MTOR, mTORC1, MYC, and glycolysis pathways in iC9/CAR19/IL-15 CISH KO NK cells compared with iC9/CAR19/IL-15 control NK cells. (B) Comparative mean T statistic heat map of RNA sequencing data showing the expression of metabolic pathways in NT control (NT), NT CISH KO (NTKO), iC9/CAR19/IL-15 control (CAR), or iC9/CAR19/IL-15 CISH KO (CARKO) NK cells that are significantly different (q < 0.01) in ≥1 of the 5 comparisons. Each column represents a separate comparison, and each row reflects the expression of a certain hallmark pathway for each annotation. Color scale indicates signal intensity, ranging from lower (blue) to higher (red) expression. (C) Violin plots showing PI3K/Akt/mTORC1 and glycolysis signaling in NT (blue), NT-KO (green), CAR (purple), or CAR-KO (red) NK cells after correction for donor effect. Pathway activity of samples is regressed against donor and the residual is the corrected pathway activity. P values reported are computed relative to NT using the linear regression approach discussed in Materials and methods. **P ≤ .01. (D) NT control (NT), NT CISH KO (NT-KO), iC9/CAR19/IL-15 control (CAR), or iC9/CAR19/IL-15 CISH KO (CAR-KO) NK cells were cultured without (−) or with (+) Raji cells for 30 minutes, 1 hour, or 2 hours; NK cells were then purified, and the protein expression levels of p-Akt, Akt, p-S6, S6, c-MYC, and α-tubulin in NK cells were determined by western blot analysis. Representative blots from 2 independent experiments are shown. (E) A series of ECARs was calculated for NT control (blue lines), NT CISH KO (green lines), iC9/CAR19/IL-15 control (purple lines), or iC9/CAR19/IL-15 CISH KO (red lines) NK cells cocultured with Raji targets for 2 hours and subsequently purified and treated with 2 g/L d-glucose, 1 μM oligomycin, and 100 mM 2-deoxyglucose (2-DG). A representative graph from 5 independent experiments is shown. (F) Box plots summarize the ECAR data by NT control (blue box), NT CISH KO (green box), iC9/CAR19/IL-15 control (purple box), or iC9/CAR19/IL-15 CISH KO (red box) NK cells cocultured with Raji (n = 5). Statistical significance is indicated as *P ≤ .05; bars represent mean values with standard deviation. (G) Bar graph summarizes the glucose concentration in the supernatant of the different NK cell conditions cocultured with Raji for 2 hours: NT control (blue), NT CISH KO (green), iC9/CAR19/IL-15 control (purple), or iC9/CAR19/IL-15 CISH KO (red) NK cells (n = 3). Bars represent mean values with standard deviation (**P ≤ .01).
Figure 5.
Figure 5.
CISH KO iC9/CAR19/IL-15 NK cells improve tumor control and survival in a Raji lymphoma mouse model at low infusion doses. (A) Schematic diagram representing the timeline of the in vivo experiments. (B) BLI imaging of an independent mouse experiment where mice received either Raji alone or Raji plus 10 × 106 CAR19/IL-15 control or Raji plus 10 × 106 CAR19/IL-15 CISH KO (n = 5 mice per group). *This mouse died accidentally during bleeding. (C) Survival curve for the 3 groups of mice described in panel B (Raji alone, green; Raji plus 10 × 106 CAR19/IL-15 control, blue; Raji plus 10 × 106 CAR19/IL-15 CISH KO, red). Statistical significance is represented by *P ≤ .05 for the comparison of the red and blue curves and **P ≤ .01 for the comparison of the blue and gray curves. (D) Graph representing the body weights of mice over time in the 3 different groups described in panel B. Bars represent mean values with standard deviation. (E) BLI data from 5 groups of NSG mice treated with Raji alone (n = 5), Raji plus 1 dose of 3 × 10⁶ of iC9/CAR19/IL-15 control NK cells (n = 5) or iC9/CAR19/IL-15 CISH KO NK cells (n = 5), or Raji plus 1 dose of 10 × 106 of iC9/CAR19/IL-15 control NK cells (n = 5) or iC9/CAR19/IL-15 CISH KO NK cells (n = 3). (F-G) The average radiance (F) and survival curves (G) are shown for the 5 groups of mice described in panel E. Statistical significance is represented by *P ≤ .05 or **P ≤ .01. (H) Photomicrographs of hematoxylin and eosin (H&E) and immunohistochemical CD20 staining of liver (top) and bone marrow (BM) (bottom) from mice engrafted with Raji B cell lymphoma either untreated or treated with iC9/CAR19/IL-15 CISH KO or iC9/CAR19/IL-15 CTLR NK cells (10 × 106 dose level). Representative images show absence of neoplastic B cells in liver and bone marrow of a mouse treated with iC9/CAR19/IL-15 CISH KO NK cells in comparison with similar treatment with iC9/CAR19/IL-15 NK cells retaining CISH expression. Images were taken at 10× (liver) and 5× (bone marrow) using a Leica DFC 495 camera. (I) Bar graph showing the percentage of NK cells (CD3CD56+CD45+) present in peripheral blood from mice treated with iC9/CAR19/IL-15 control vs iC9/CAR19/IL-15 CISH KO NK cells at days 7, 14, 21, and 28. Bars represent mean values with standard deviation. Statistical significance is represented by *P ≤ .05 or **P ≤ .01. (J) Graph showing body weights of NSG mice groups described in panel E over time.
Figure 6.
Figure 6.
Identification of Cas9 off-target sites by GUIDE-seq and quantification of potential Cas9 off-target cleavage sites using rhAmpSeq technology. (A) Sequences of off-target sites identified by GUIDE-seq for 2 guides targeting the CISH locus. The guide sequence is listed on top with off-target sites shown below. The on-target site is identified with a black square. Mismatches to the guide are shown and highlighted in color with insertions shown in gray. The number of GUIDE-seq sequencing reads are shown to the right of each site. 10 µM Alt-R crRNA XT complexed to Alt-R transactivating CRISPR RNA was delivered into HEK293 cells that constitutively express Cas9 nuclease by nucleofection. (B) Pie charts indicate the fractional percentage of the total unique, CRISPR-Cas9–specific read counts that are on-target (red) and off-target (blue). Total editing at the on- and off-target sites identified by GUIDE-Seq was measured using rhAmpSeq, a multiplexed targeted enrichment approach for next-generation sequencing. For each of the 2 CISH targeting guides, amplicons were designed around each Cas9 cleavage site with reads >1% of the on-target GUIDE-seq reads. RNP complexes formed with either WT Cas9 (blue) or Alt-R HiFi Cas9 (red) were delivered via electroporation into expanded NK cells. (C) Insertion/deletion formation at each targeted loci for CISH guide 1 (panel 1, 11-plex) and CISH guide 2 (panel 2, 70-plex) when a single RNP complex was delivered. The on-target locus is indicated with a black asterisk underneath the first 2 bars of each graph. (D) Insertion/deletion formation at each targeted loci when CISH guide 1 and CISH guide 2 were codelivered. The on-target locus is indicated with a black asterisk underneath the first 2 bars of each graph.

Comment in

References

    1. Morvan MG, Lanier LL. NK cells and cancer: you can teach innate cells new tricks. Nat Rev Cancer. 2016;16(1):7-19. - PubMed
    1. Daher M, Rezvani K. Next generation natural killer cells for cancer immunotherapy: the promise of genetic engineering. Curr Opin Immunol. 2018;51:146-153. - PMC - PubMed
    1. Mehta RS, Shpall EJ, Rezvani K. Cord blood as a source of natural killer cells. Front Med (Lausanne). 2016;2:93. - PMC - PubMed
    1. Sarvaria A, Jawdat D, Madrigal JA, Saudemont A. Umbilical cord blood natural killer cells, their characteristics, and potential clinical applications. Front Immunol. 2017;8:329. - PMC - PubMed
    1. Liu E, Marin D, Banerjee P, et al. . Use of CAR-transduced natural killer cells in CD19-positive lymphoid tumors. N Engl J Med. 2020;382(6):545-553. - PMC - PubMed

Publication types

MeSH terms

Substances