

Localization of Cell Receptor-Related Genes of SARS-CoV-2 in the Kidney through Single-Cell Transcriptome Analysis
- PMID: 32903321
- PMCID: PMC7316659
- DOI: 10.1159/000508162
Localization of Cell Receptor-Related Genes of SARS-CoV-2 in the Kidney through Single-Cell Transcriptome Analysis
Abstract
Background: The new coronavirus (SARS-CoV-2), which has been responsible for the recent coronavirus disease 2019 (COVID-19) pandemic, uses the cell receptor angiotensin converting enzyme-2 (ACE2) for entry and the serine protease TMPRSS2 for spike (S) protein priming. Meanwhile, the presence of B0AT1 (SLC6A19) may prevent TMPRSS2 from accessing the cutting position on ACE2. Identifying the expression of these cell receptor-related genes of SARS-CoV-2 is critical for understanding the pathogenesis of SARS-CoV-2 in various tissues, especially in the kidney.
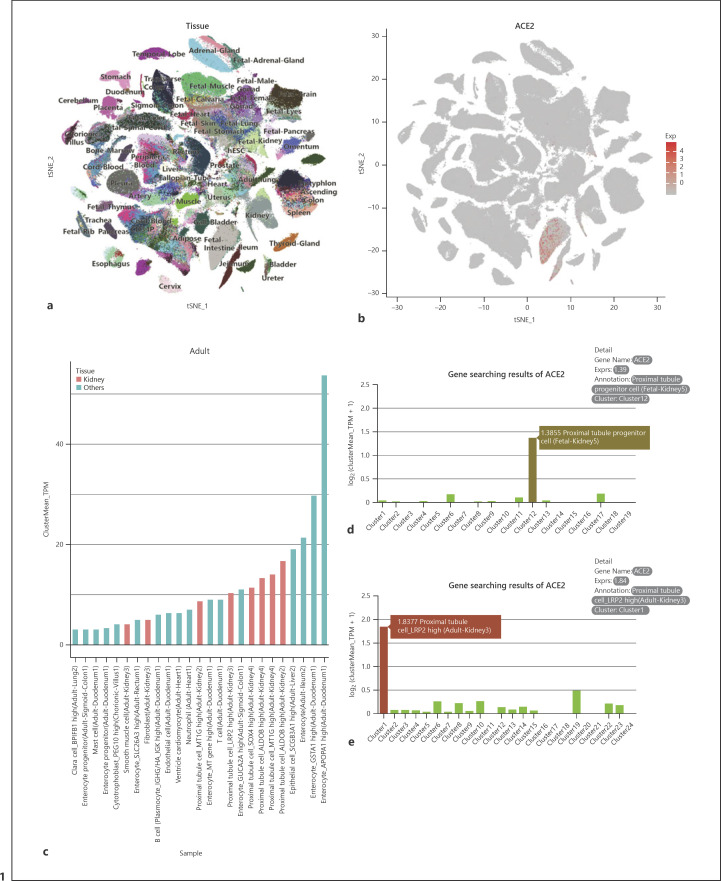
Methods: The single-cell transcription datasets of the human cell landscape (HCL) and other relevant single-cell transcription databases were used to analyze the expression of ACE2, TMPRSS2, and SLC6A19 in various organs and tissues, but mainly in the kidney.
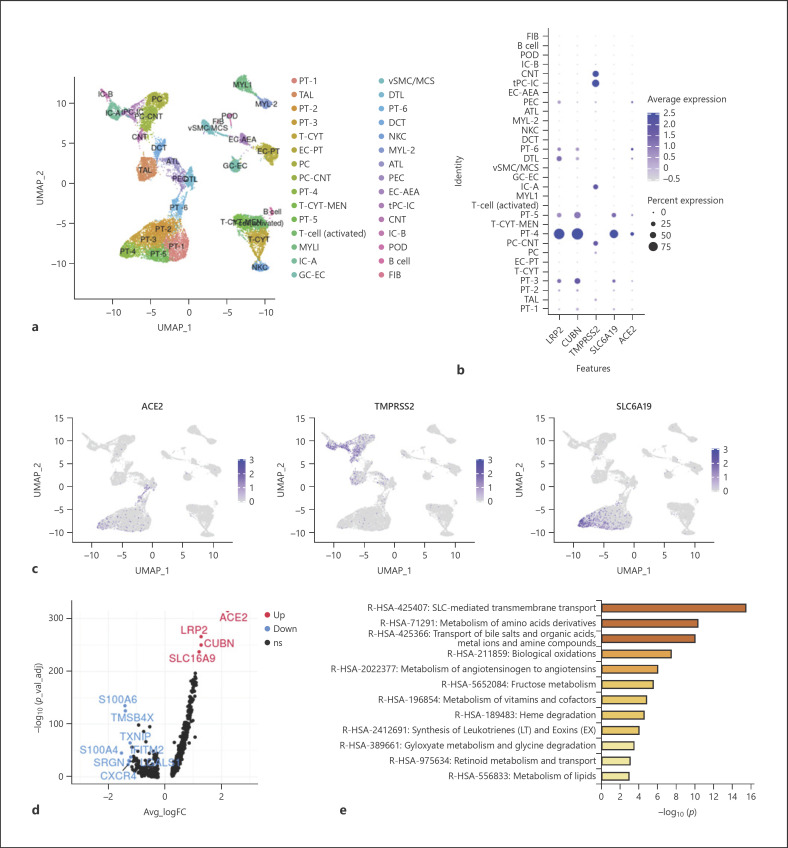
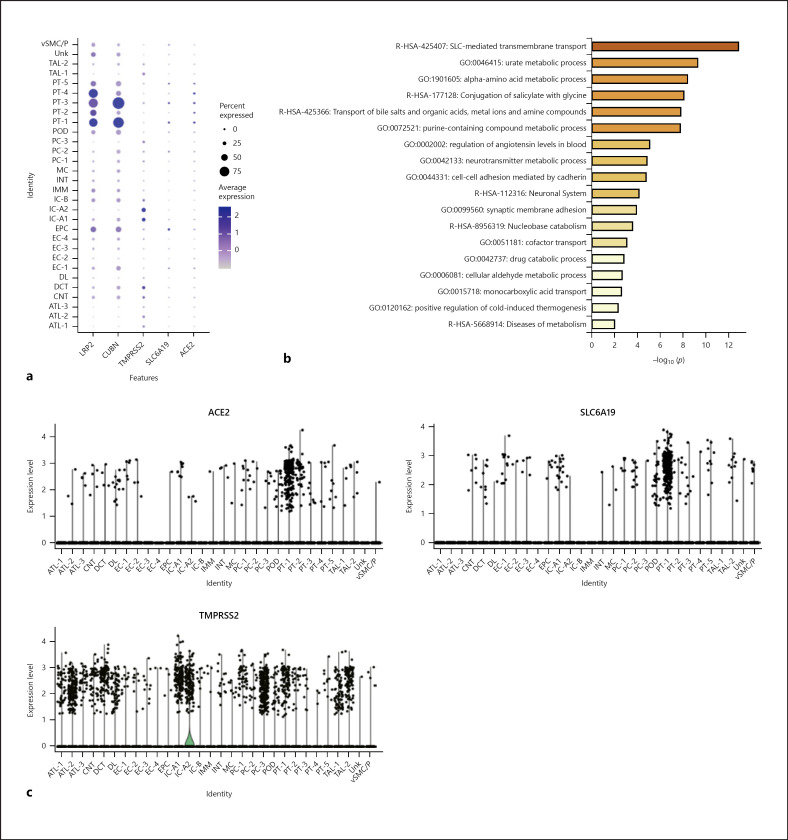
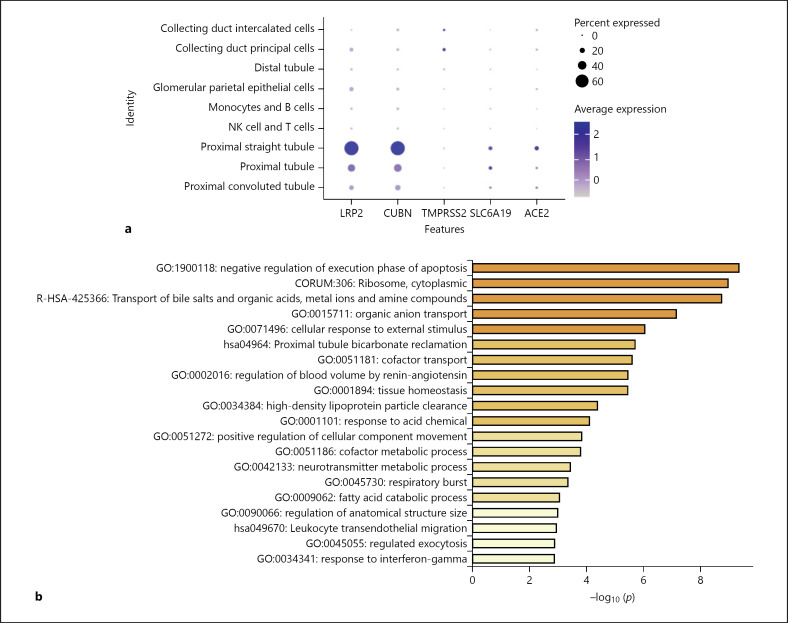
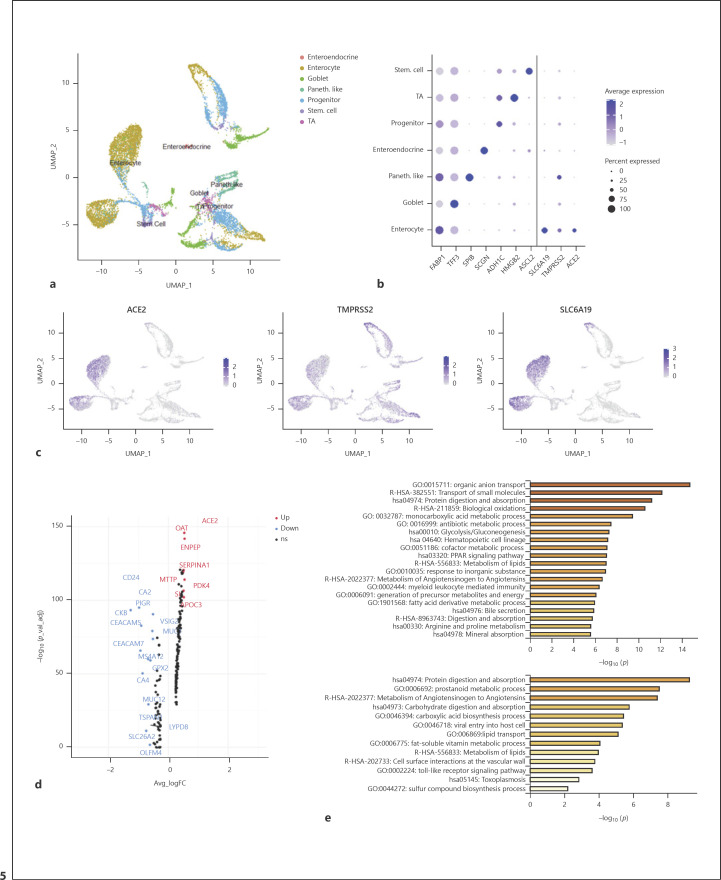
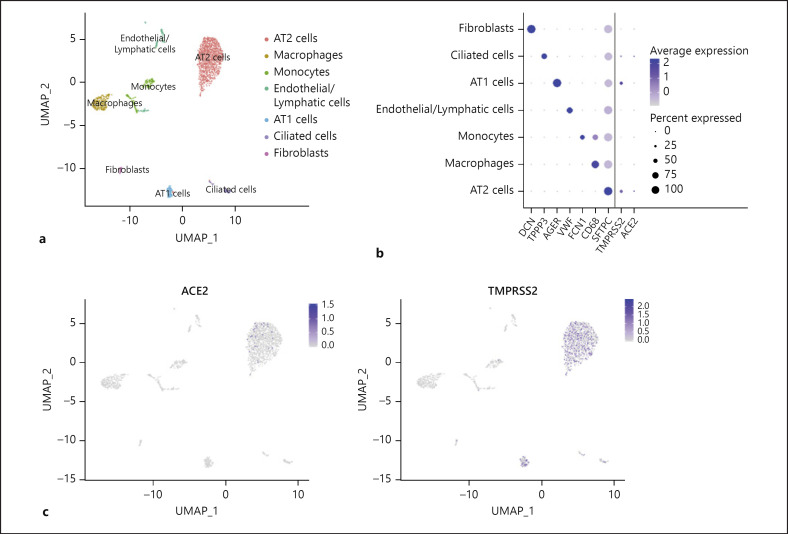
Results: ACE2 was significantly expressed in the S1, S2, and S3 segments of proximal tubule (PT) cells. TMPRSS2 was widely expressed in several renal tubule populations extending from the PT cells to the collection system cell type, of which intercalated cells and the distal convoluted tubule cells showed more significant expression than PT cells. Unexpectedly, although expressed on various renal tubule populations, SLC6A19 was mainly enriched in PT cells, in line with ACE2 expression. Although alveolar-type (AT) 2 cells of the lung and intestinal epithelial cells expressed ACE2 as well as PT cells, AT 2 cells significantly expressed TMPRSS2 but not SLC6A19, while all 3 genes were significantly expressed in intestinal epithelial cells.
Conclusions: ACE2 was widely expressed in specific cell subgroups of various human tissues, especially in intestinal epithelial cells, kidney PT cells, and also AT 2 cells of the lung. These 3 types of cells demonstrated significant differences in the distribution of the cell receptor-related genes of SARS-CoV-2, which may indicate the diversity of cell surface structures and differences in the affinity between SARS-CoV-2 and cells.
Keywords: Angiotensin-converting enzyme-2; Proximal tubule cells; SARS-CoV-2; Single-cell transcriptome sequencing.
Copyright © 2020 by S. Karger AG, Basel.
Conflict of interest statement
The authors have no conflicts of interest to declare.
Figures
Similar articles
-
Distinctive Roles of Furin and TMPRSS2 in SARS-CoV-2 Infectivity.J Virol. 2022 Apr 27;96(8):e0012822. doi: 10.1128/jvi.00128-22. Epub 2022 Mar 28. J Virol. 2022. PMID: 35343766 Free PMC article.
-
Expression profiling meta-analysis of ACE2 and TMPRSS2, the putative anti-inflammatory receptor and priming protease of SARS-CoV-2 in human cells, and identification of putative modulators.Redox Biol. 2020 Sep;36:101615. doi: 10.1016/j.redox.2020.101615. Epub 2020 Jun 24. Redox Biol. 2020. PMID: 32863223 Free PMC article.
-
The OM-85 bacterial lysate inhibits SARS-CoV-2 infection of epithelial cells by downregulating SARS-CoV-2 receptor expression.J Allergy Clin Immunol. 2022 Mar;149(3):923-933.e6. doi: 10.1016/j.jaci.2021.11.019. Epub 2021 Dec 10. J Allergy Clin Immunol. 2022. PMID: 34902435 Free PMC article.
-
Effects of SARS-CoV-2 on Cardiovascular System: The Dual Role of Angiotensin-Converting Enzyme 2 (ACE2) as the Virus Receptor and Homeostasis Regulator-Review.Int J Mol Sci. 2021 Apr 26;22(9):4526. doi: 10.3390/ijms22094526. Int J Mol Sci. 2021. PMID: 33926110 Free PMC article. Review.
-
Interaction of SARS-CoV-2 and Other Coronavirus With ACE (Angiotensin-Converting Enzyme)-2 as Their Main Receptor: Therapeutic Implications.Hypertension. 2020 Nov;76(5):1339-1349. doi: 10.1161/HYPERTENSIONAHA.120.15256. Epub 2020 Aug 27. Hypertension. 2020. PMID: 32851855 Free PMC article. Review.
Cited by
-
Applications and analytical tools of cell communication based on ligand-receptor interactions at single cell level.Cell Biosci. 2021 Jul 3;11(1):121. doi: 10.1186/s13578-021-00635-z. Cell Biosci. 2021. PMID: 34217372 Free PMC article. Review.
-
COVID-19 Mechanisms in the Human Body-What We Know So Far.Front Immunol. 2021 Nov 1;12:693938. doi: 10.3389/fimmu.2021.693938. eCollection 2021. Front Immunol. 2021. PMID: 34790191 Free PMC article. Review.
-
Studying Kidney Diseases at the Single-Cell Level.Kidney Dis (Basel). 2021 Sep;7(5):335-342. doi: 10.1159/000517130. Epub 2021 Jul 5. Kidney Dis (Basel). 2021. PMID: 34604340 Free PMC article. Review.
-
Ascertaining the mechanistic etiology of COVID-associated glomerulonephritis: a systematic review.Front Med (Lausanne). 2025 Jun 9;12:1568943. doi: 10.3389/fmed.2025.1568943. eCollection 2025. Front Med (Lausanne). 2025. PMID: 40552181 Free PMC article.
-
Suppression of ACE2 SUMOylation protects against SARS-CoV-2 infection through TOLLIP-mediated selective autophagy.Nat Commun. 2022 Sep 3;13(1):5204. doi: 10.1038/s41467-022-32957-y. Nat Commun. 2022. PMID: 36057605 Free PMC article.
References
-
- WHO Coronavirus disease (COVID-19) Situation dashboard. [cited 2020 April 4]. Available from: https://experience.arcgis.com/experience/685d0ace521648f8a5beeeee1b9125cd.
LinkOut - more resources
Full Text Sources
Other Literature Sources
Research Materials
Miscellaneous
