Management of Genetic Diversity in the Era of Genomics
- PMID: 32903415
- PMCID: PMC7438563
- DOI: 10.3389/fgene.2020.00880
Management of Genetic Diversity in the Era of Genomics
Abstract
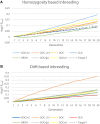
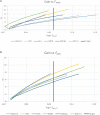
Management of genetic diversity aims to (i) maintain heterozygosity, which ameliorates inbreeding depression and loss of genetic variation at loci that may become of importance in the future; and (ii) avoid genetic drift, which prevents deleterious recessives (e.g., rare disease alleles) from drifting to high frequency, and prevents random drift of (functional) traits. In the genomics era, genomics data allow for many alternative measures of inbreeding and genomic relationships. Genomic relationships/inbreeding can be classified into (i) homozygosity/heterozygosity based (e.g., molecular kinship matrix); (ii) genetic drift-based, i.e., changes of allele frequencies; or (iii) IBD-based, i.e., SNPs are used in linkage analyses to identify IBD segments. Here, alternative measures of inbreeding/relationship were used to manage genetic diversity in genomic optimal contribution (GOC) selection schemes. Contrary to classic inbreeding theory, it was found that drift and homozygosity-based inbreeding could differ substantially in GOC schemes unless diversity management was based upon IBD. When using a homozygosity-based measure of relationship, the inbreeding management resulted in allele frequency changes toward 0.5 giving a low rate of increase in homozygosity for the panel used for management, but not for unmanaged neutral loci, at the expense of a high genetic drift. When genomic relationship matrices were based on drift, following VanRaden and as in GCTA, drift was low at the expense of a high rate of increase in homozygosity. The use of IBD-based relationship matrices for inbreeding management limited both drift and the homozygosity-based rate of inbreeding to their target values. Genetic improvement per percent of inbreeding was highest when GOC used IBD-based relationships irrespective of the inbreeding measure used. Genomic relationships based on runs of homozygosity resulted in very high initial improvement per percent of inbreeding, but also in substantial discrepancies between drift and homozygosity-based rates of inbreeding, and resulted in a drift that exceeded its target value. The discrepancy between drift and homozygosity-based rates of inbreeding was caused by a covariance between initial allele frequency and the subsequent change in frequency, which becomes stronger when using data from whole genome sequence.
Keywords: genetic diversity; genetic drift; genetic gain; genomic relationships; inbreeding; optimum contribution selection.
Copyright © 2020 Meuwissen, Sonesson, Gebregiwergis and Woolliams.
Figures


Similar articles
-
Trends in genome-wide and region-specific genetic diversity in the Dutch-Flemish Holstein-Friesian breeding program from 1986 to 2015.Genet Sel Evol. 2018 Apr 11;50(1):15. doi: 10.1186/s12711-018-0385-y. Genet Sel Evol. 2018. PMID: 29642838 Free PMC article.
-
Impact of kinship matrices on genetic gain and inbreeding with optimum contribution selection in a genomic dairy cattle breeding program.Genet Sel Evol. 2023 Jul 17;55(1):48. doi: 10.1186/s12711-023-00826-x. Genet Sel Evol. 2023. PMID: 37460999 Free PMC article.
-
Pedigree relationships to control inbreeding in optimum-contribution selection realise more genetic gain than genomic relationships.Genet Sel Evol. 2019 Jul 8;51(1):39. doi: 10.1186/s12711-019-0475-5. Genet Sel Evol. 2019. PMID: 31286868 Free PMC article.
-
Symposium review: Exploiting homozygosity in the era of genomics-Selection, inbreeding, and mating programs.J Dairy Sci. 2020 Jun;103(6):5302-5313. doi: 10.3168/jds.2019-17846. Epub 2020 Apr 22. J Dairy Sci. 2020. PMID: 32331889 Review.
-
Invited review: Inbreeding in the genomics era: Inbreeding, inbreeding depression, and management of genomic variability.J Dairy Sci. 2017 Aug;100(8):6009-6024. doi: 10.3168/jds.2017-12787. Epub 2017 Jun 7. J Dairy Sci. 2017. PMID: 28601448 Review.
Cited by
-
Pedigree-based analyses of changes in genetic variability in three major swine breeds in Taiwan after a disease outbreak.Transl Anim Sci. 2022 Apr 13;6(2):txac043. doi: 10.1093/tas/txac043. eCollection 2022 Apr. Transl Anim Sci. 2022. PMID: 35592093 Free PMC article.
-
Correlation of Genomic and Pedigree Inbreeding Coefficients in Small Cattle Populations.Animals (Basel). 2021 Nov 12;11(11):3234. doi: 10.3390/ani11113234. Animals (Basel). 2021. PMID: 34827966 Free PMC article.
-
Prediction of additive genetic variances of descendants for complex families based on Mendelian sampling variances.G3 (Bethesda). 2024 Nov 6;14(11):jkae205. doi: 10.1093/g3journal/jkae205. G3 (Bethesda). 2024. PMID: 39197015 Free PMC article.
-
The value of genomic relationship matrices to estimate levels of inbreeding.Genet Sel Evol. 2021 May 1;53(1):42. doi: 10.1186/s12711-021-00635-0. Genet Sel Evol. 2021. PMID: 33933002 Free PMC article.
-
Approaching autozygosity in a small pedigree of Gochu Asturcelta pigs.Genet Sel Evol. 2023 Oct 25;55(1):74. doi: 10.1186/s12711-023-00846-7. Genet Sel Evol. 2023. PMID: 37880572 Free PMC article.
References
-
- Brisbane J. R., Gibson J. P. (1994). Balancing selection response and rate of inbreeding by including genetic relationships in selection decisions. World Congr. Genet. Appl. Livest. Prod. 19:135. - PubMed
LinkOut - more resources
Full Text Sources

