

A Phase Transition of the Unconscious: Automated Text Analysis of Dreams in Psychoanalytic Psychotherapy
- PMID: 32903443
- PMCID: PMC7434971
- DOI: 10.3389/fpsyg.2020.01667
A Phase Transition of the Unconscious: Automated Text Analysis of Dreams in Psychoanalytic Psychotherapy
Abstract
Aim: Psychotherapy could be interpreted as a self-organizing process which reveals discontinuous pattern transitions (so-called phase transitions). Whereas this was shown in the conscious process of awake patients by different measures and at different time scales, dreams came very seldom into the focus of investigation. The present work tests the hypothesis that, by dreaming, the patient gets progressively more access to affective-laden (i.e., emotionally charged) unconscious dimensions. Furthermore, the study investigates if, over the course of psychotherapy, a discontinuous phase transition occurs in the patient's capacity to get in contact with those unconscious dimensions.
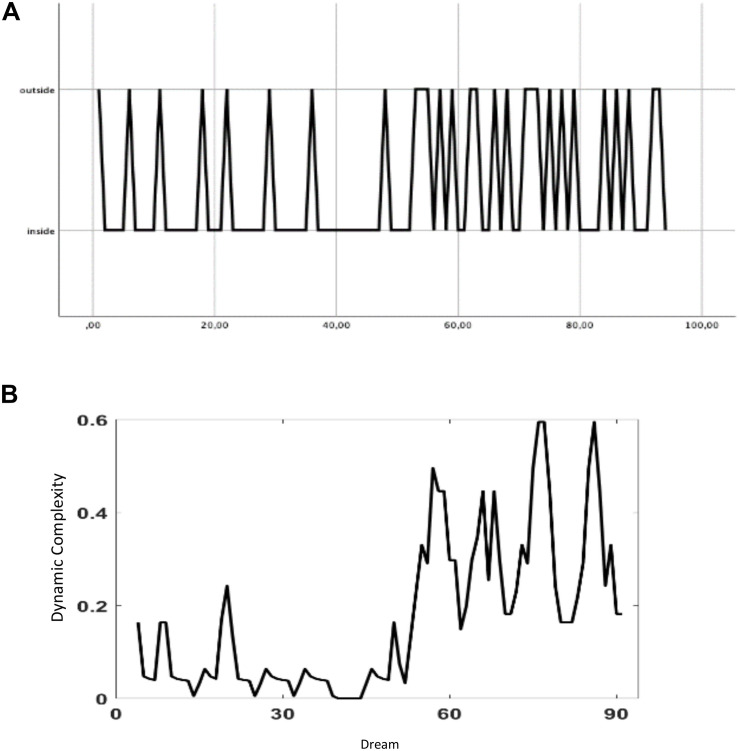
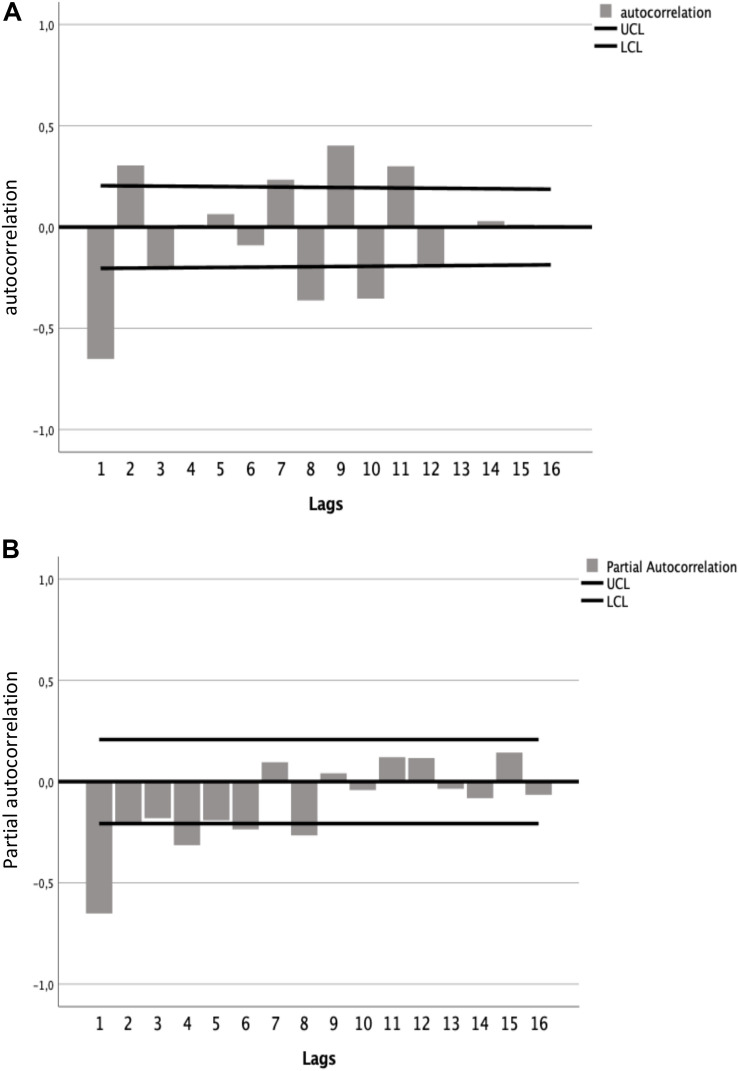
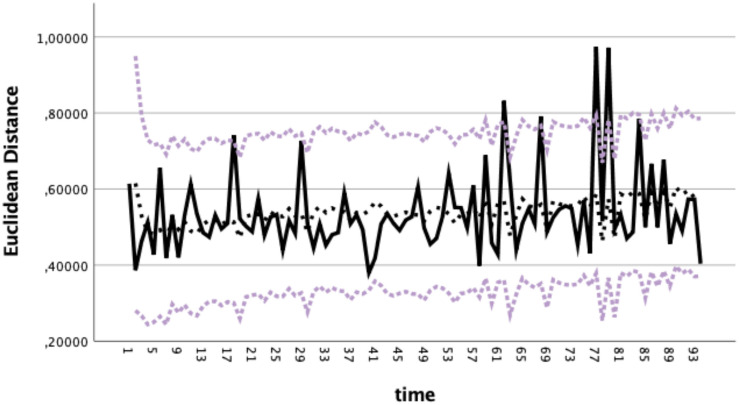
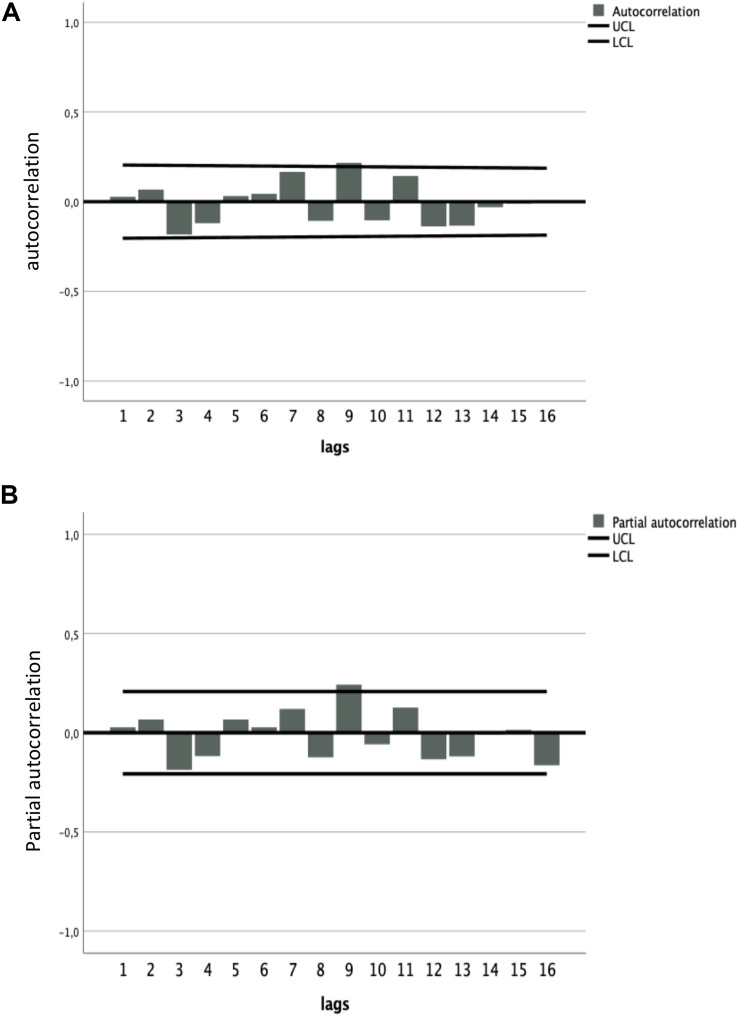
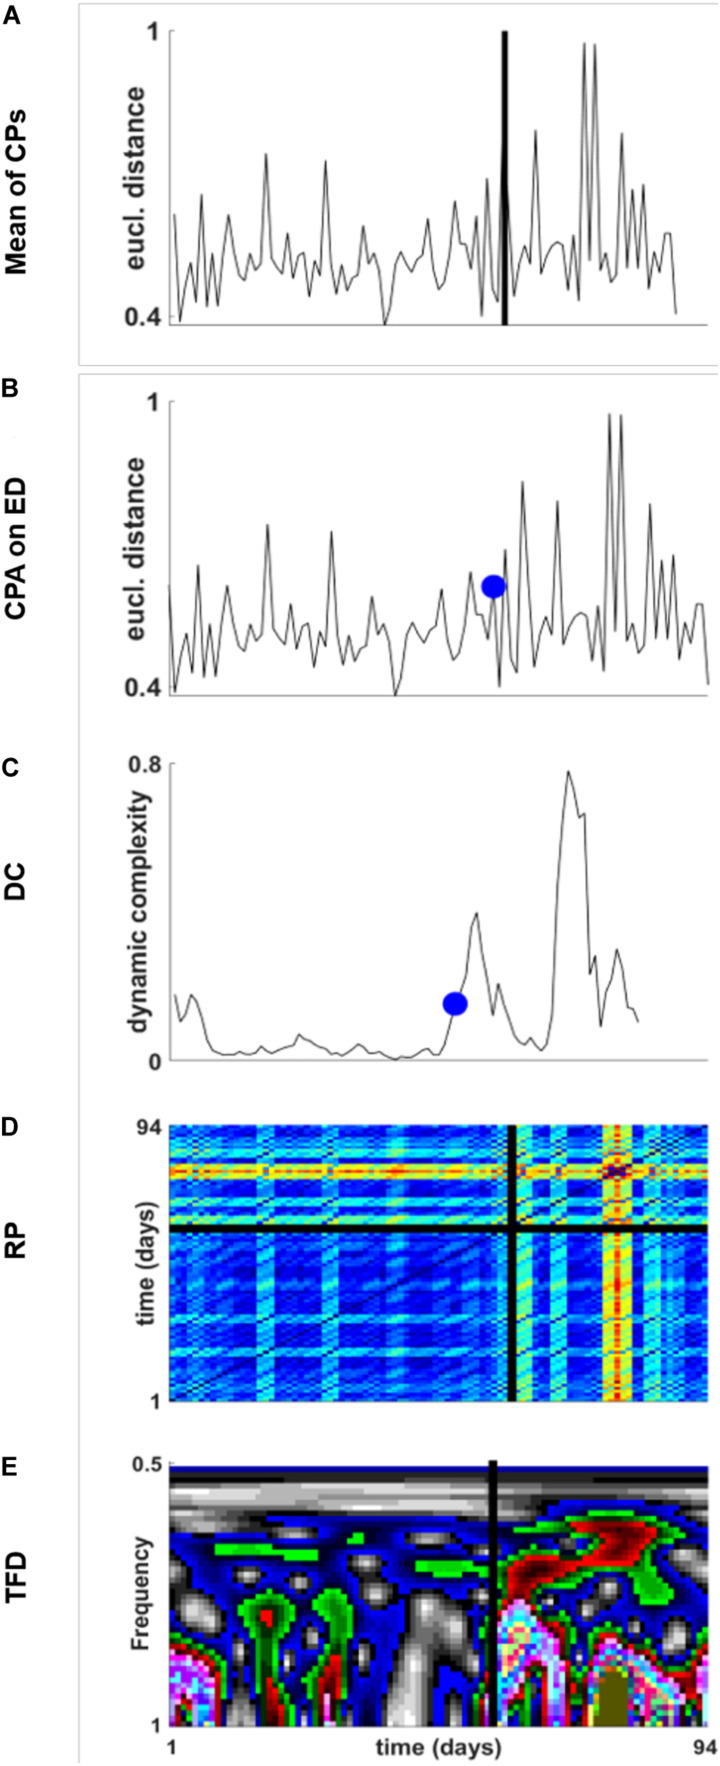
Methods and procedures: A series of 95 dream narratives reported during a psychoanalytic psychotherapy of a female patient (published as the "dreams of Amalie X") was used for analysis. An automated text analysis procedure based on multiple correspondence analysis was applied to the textual corpus of the dreams, highlighting a 10-factor structure. The factors, interpreted as affective-laden unconscious meaning dimensions, were adopted to define a 10-dimensional phase space, in which the ability of a dream to be associated with one or more local factors representing complex affective-laden meanings is measured by the Euclidean distance (ED) from the origin of this hyperspace. The obtained ED time series has been fitted by an autoregressive integrated moving average (ARIMA) model and by non linear methods like dynamic complexity, recurrence plot, and time frequency distribution. Change point analysis was applied to these non linear methods.
Results: The results show an increased frequency and intensity of dreams to get access to affective-laden meanings. Non linear methods identified a phase transition-like jump of the ED dynamics onto a higher complexity level of the dreaming process, suggesting a non linear process in the patient's capacity to get in contact with unconscious dimensions.
Conclusion: The study corroborates the hypothesis that, by dreaming, the patient gets progressively more access to affective-laden meaning intended as unconscious dimensions. The trajectory of this process has been reproduced by an ARIMA model, and beyond this, non linear methods of time series analysis allowed the identification of a phase transition in the unconscious process of the psychoanalytic therapy under investigation.
Keywords: dream analysis; meaning; phase transition; psychotherapy process; text analysis.
Copyright © 2020 Gennaro, Kipp, Viol, de Felice, Andreassi, Aichhorn, Salvatore and Schiepek.
Figures
References
-
- Benzecri J. P. (1973). L’Analyse des Donnees. Paris: Dound.
-
- Benzecri J. P. (1979). Sur le calcul des tax d’inertie dans l’analyse d’un questionnaire addendum et erratum. Cah. Anal. Donnees 4 377–378.
-
- Bolasco S. (1999). Analisi Multidimensionale dei Dati. Roma: Carocci.
-
- Bucci W. (2011). The interplay of subsymbolic and symbolic processes in psychoanalytic treatment: it takes two to tango—But who knows the steps, who’s the leader? The choreography of the psychoanalytic interchange. Psychoanal. Dialogues 21 45–54. 10.1080/10481885.2011.545326 - DOI
-
- Cartwright R. D. (1977). Night Life. Englewood Cliffs, NJ: Prentice Hall.
LinkOut - more resources
Full Text Sources