. 2020 Aug 13:8:473.
doi: 10.3389/fpubh.2020.00473. eCollection 2020.

Modeling the Onset of Symptoms of COVID-19

Affiliations

Modeling the Onset of Symptoms of COVID-19

Joseph R Larsen et al. Front Public Health. .

Abstract

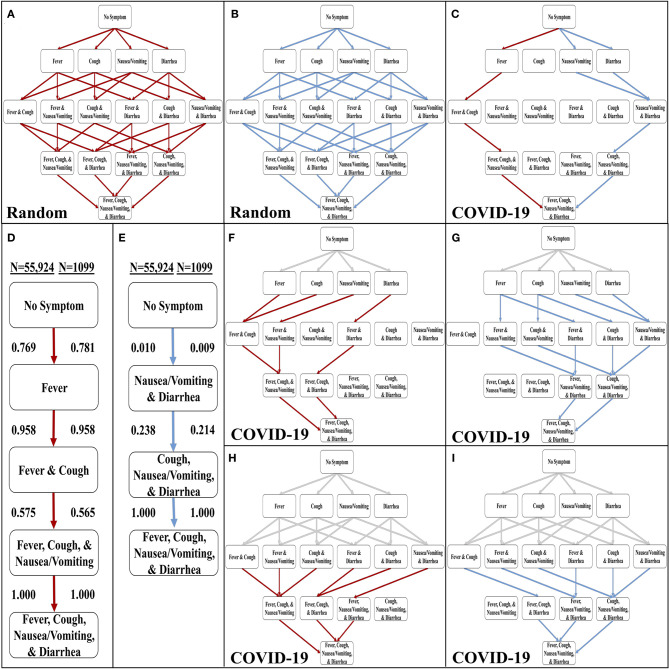
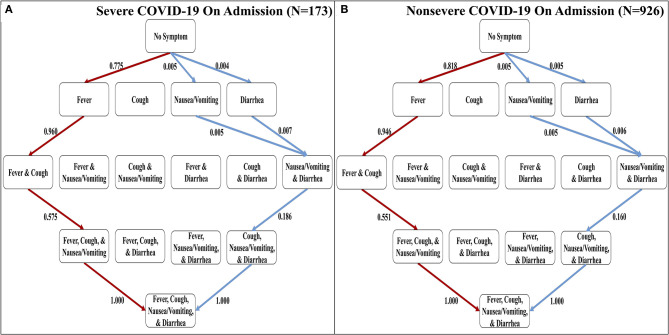
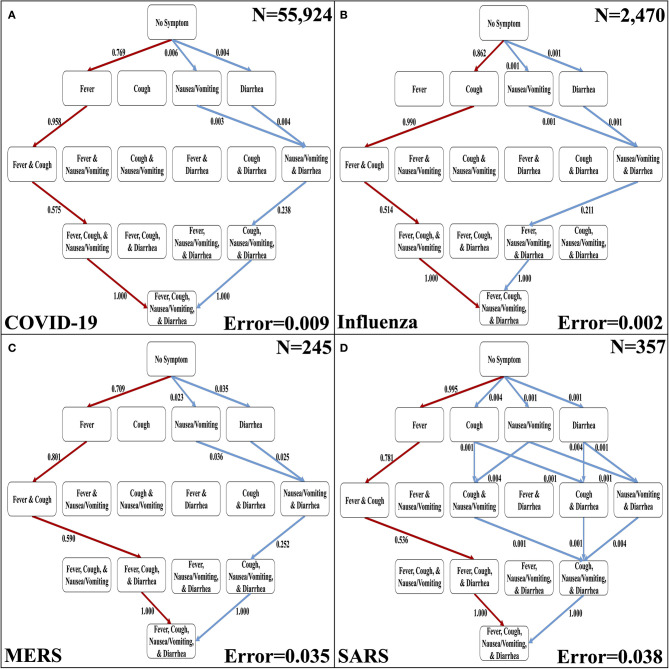
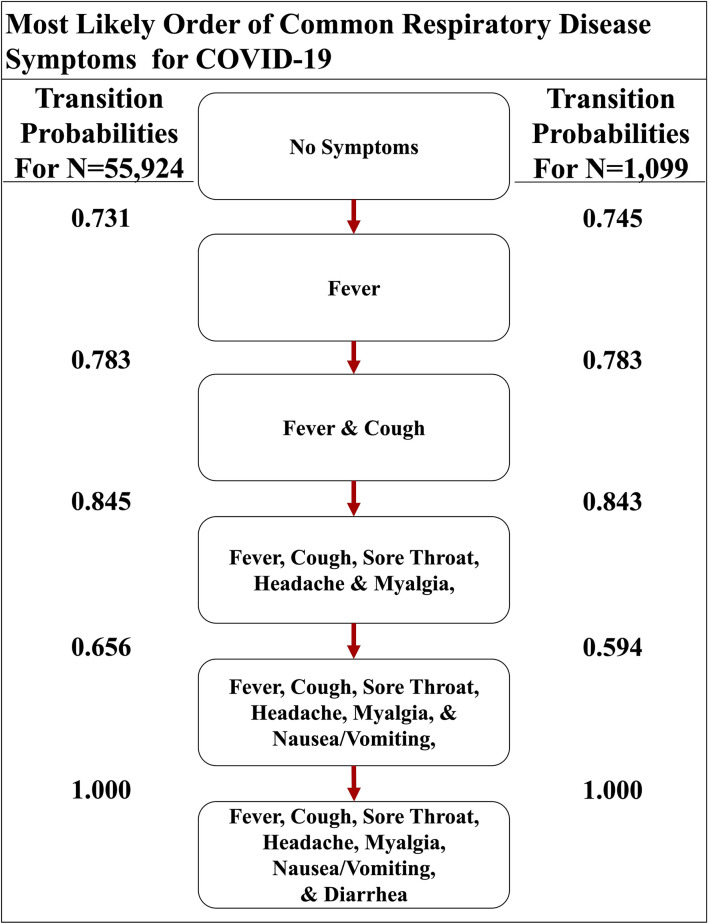
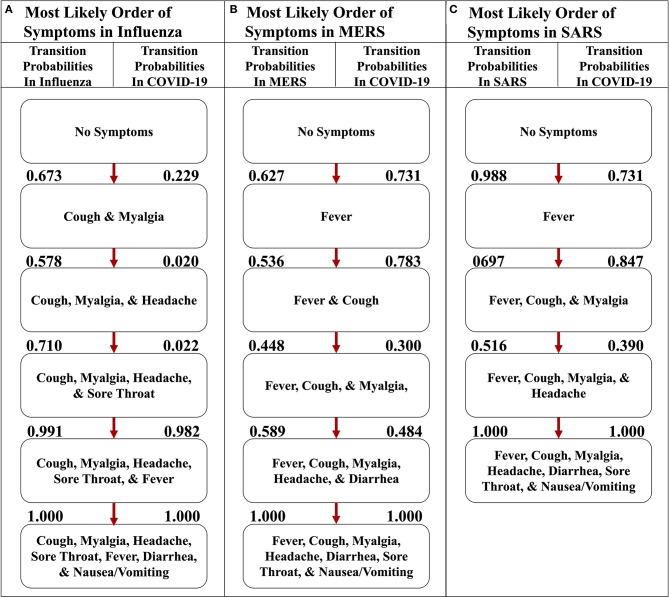
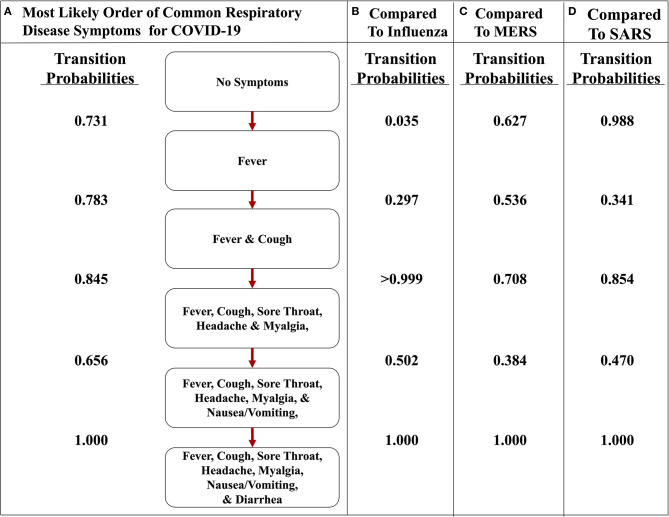
COVID-19 is a pandemic viral disease with catastrophic global impact. This disease is more contagious than influenza such that cluster outbreaks occur frequently. If patients with symptoms quickly underwent testing and contact tracing, these outbreaks could be contained. Unfortunately, COVID-19 patients have symptoms similar to other common illnesses. Here, we hypothesize the order of symptom occurrence could help patients and medical professionals more quickly distinguish COVID-19 from other respiratory diseases, yet such essential information is largely unavailable. To this end, we apply a Markov Process to a graded partially ordered set based on clinical observations of COVID-19 cases to ascertain the most likely order of discernible symptoms (i.e., fever, cough, nausea/vomiting, and diarrhea) in COVID-19 patients. We then compared the progression of these symptoms in COVID-19 to other respiratory diseases, such as influenza, SARS, and MERS, to observe if the diseases present differently. Our model predicts that influenza initiates with cough, whereas COVID-19 like other coronavirus-related diseases initiates with fever. However, COVID-19 differs from SARS and MERS in the order of gastrointestinal symptoms. Our results support the notion that fever should be used to screen for entry into facilities as regions begin to reopen after the outbreak of Spring 2020. Additionally, our findings suggest that good clinical practice should involve recording the order of symptom occurrence in COVID-19 and other diseases. If such a systemic clinical practice had been standard since ancient diseases, perhaps the transition from local outbreak to pandemic could have been avoided.

Keywords: COVID-19; Markov; disease; influenza; model; probability; stochastic; symptoms.


Figures

Figure 1
Figure 1
Development of the stochastic progression model for COVID-19. (A) The most likely paths (red) in the Hasse Diagram for symptoms with random likelihoods of occurring. (B) The least likely paths (blue) in the Hasse Diagram for symptoms with random likelihoods of occurring. (C) The most likely (red) and least likely (blue) paths in the Hasse Diagram for symptoms in COVID-19. (D) The most likely order of symptoms in COVID-19 based on our Stochastic Progression Model determined from transition probabilities presented here. (E) The least likely order of symptoms in COVID-19 based on our Stochastic Progression Model determined from transition probabilities presented here. (F) Hasse Diagram of the most likely paths (red) after traveling any forced path (gray) of patients with one symptom. (G) Hasse Diagram of the least likely paths (blue) after traveling any forced path (gray) of patients with one symptom. (H) Hasse Diagram of the most likely paths (red) after traveling any forced path (gray) of patients with two symptoms. (I) Hasse Diagram of the least likely paths (blue) after traveling any forced path (gray) of patients with two symptoms.
Figure 2
Figure 2
The most and least likely paths of discernible symptoms in severe and non-severe COVID-19 cases on admission. (A) Hasse Diagram of the most likely paths (red) and least likely paths (blue) in COVID-19 for cases designated as severe on admission determined from transition probabilities presented here. (B) Hasse Diagram of the most likely paths (red) and least likely paths (blue) in COVID-19 for cases designated as non-severe on admission determined from transition probabilities presented here.
Figure 3
Figure 3
The most likely and least likely paths of discernible symptoms in respiratory diseases. (A) The most likely paths (red) and least likely paths (blue) in a Hasse Diagram for COVID-19 symptoms. (B) The most likely paths (red) and least likely paths (blue) in a Hasse Diagram for influenza symptoms. (C) The most likely paths (red) and least likely paths (blue) in a Hasse Diagram for MERS symptoms. (D) The most likely paths (red) and least likely paths (blue) in a Hasse Diagram for SARS symptoms. For each diagram, the most and least likely paths are determined from the transition probabilities that are depicted on the edges. Additionally, error of transition probabilities and sample size (N) are presented.
Figure 4
Figure 4
The most likely path of common respiratory symptoms in COVID-19. The most likely path of seven common symptoms of COVID-19, determined by the transition probabilities that are also listed between nodes, of two datasets here.
Figure 5
Figure 5
The most likely paths of symptoms in influenza, MERS, and SARS vs. COVID-19. (A) The most likely path of seven common symptoms of influenza with the transition probabilities listed between nodes. (B) The most likely path of seven common symptoms of MERS with the transition probabilities listed between nodes. (C) The most likely path of seven common symptoms of SARS with the transition probabilities listed between nodes. For each path, the transition probabilities in COVID-19 are listed on the right. The most likely paths for each respective disease here are determined from the transition probabilities listed between nodes on the left.
Figure 6
Figure 6
The most likely path of symptoms in COVID-19 vs. influenza, MERS, and SARS. (A) The most likely path of seven common symptoms of COVID-19 with the transition probabilities listed between nodes. (B) The transition probabilities of the path of influenza. (C) The transition probabilities of the path of MERS. (D) The transition probabilities of the path of SARS. The most likely path here is determined from the transition probabilities listed between nodes for COVID-19.

Similar articles

Cited by

References

    1. Dong E, Du H, Gardner L. An interactive web-based dashboard to track COVID-19 in real time. Lancet Infectious Dis. (2020) 20:533–4. 10.1016/S1473-3099(20)30120-1 - DOI - PMC - PubMed
    1. Cascella M, Rajnik M, Cuomo A, Dulebohn SC, Di Napoli R. Features, Evaluation and Treatment Coronavirus (COVID-19). StatPearls Publishing; (2020). - PubMed
    1. Anderson RM, Heesterbeek H, Klinkenberg D, Hollingsworth TD. How will country-based mitigation measures influence the course of the COVID-19 epidemic? Lancet. (2020) 395:931–4. 10.1016/S0140-6736(20)30567-5 - DOI - PMC - PubMed
    1. Sun K, Chen J, Viboud C. Early epidemiological analysis of the coronavirus disease 2019 outbreak based on crowdsourced data: a population-level observational study. Lancet Digital Health. (2020) 2:E201–8. 10.1016/S2589-7500(20)30026-1 - DOI - PMC - PubMed
    1. Sohrabi C, Alsafi Z, O'Neill N, Khan M, Kerwan A, Al-Jabir A, et al. . World Health Organization declares global emergency: a review of the 2019 novel coronavirus (COVID-19). Int J Surg. (2020) 76:71–6. 10.1016/j.ijsu.2020.02.034 - DOI - PMC - PubMed

Publication types