

Body Surface Mapping of Ventricular Repolarization Heterogeneity: An Ex-vivo Multiparameter Study
- PMID: 32903614
- PMCID: PMC7438571
- DOI: 10.3389/fphys.2020.00933
Body Surface Mapping of Ventricular Repolarization Heterogeneity: An Ex-vivo Multiparameter Study
Abstract
Background: Increased heterogeneity of ventricular repolarization is associated with life-threatening arrhythmia and sudden cardiac death (SCD). T-wave analysis through body surface potential mapping (BSPM) is a promising tool for risk stratification, but the clinical effectiveness of current electrocardiographic indices is still unclear, with limited experimental validation. This study aims to investigate performance of non-invasive state-of-the-art and novel T-wave markers for repolarization dispersion in an ex vivo model.
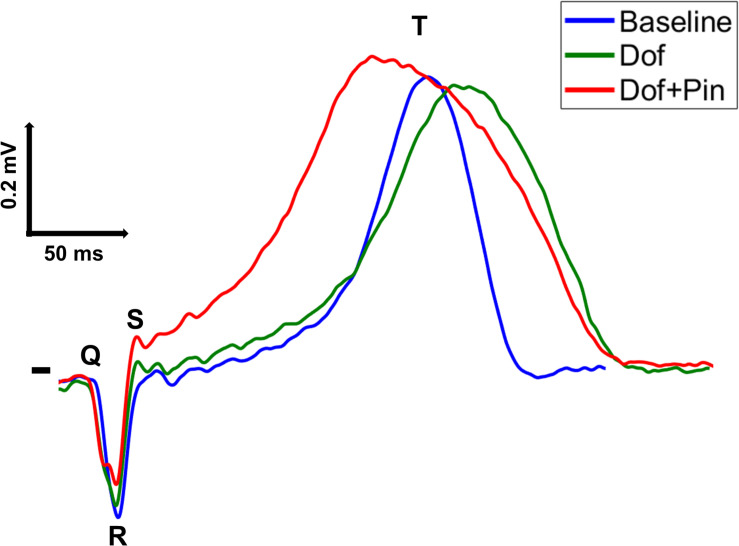
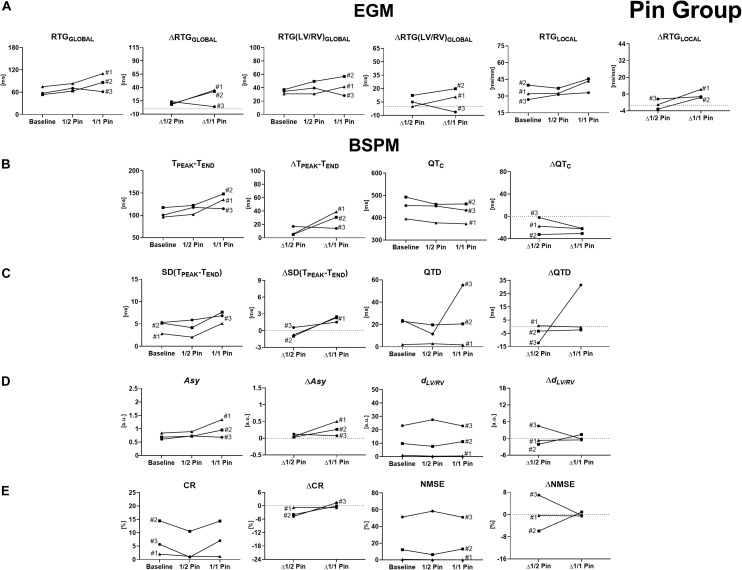
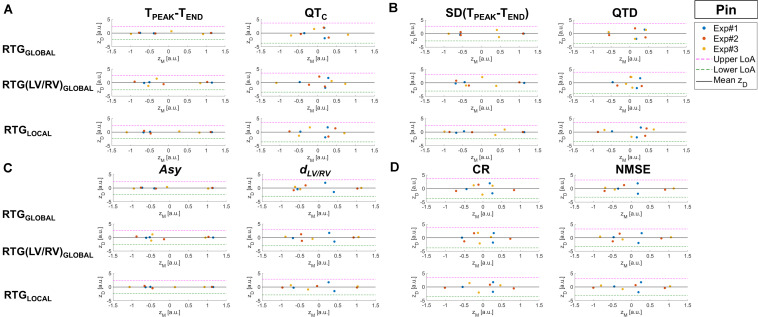
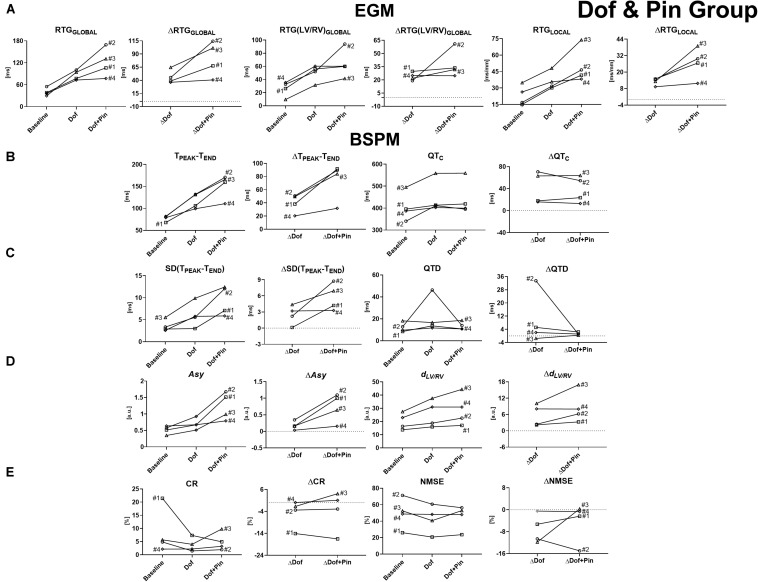
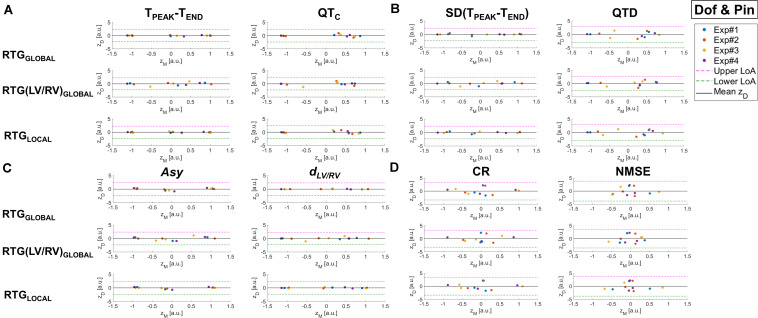
Methods: Langendorff-perfused pig hearts (N = 7) were suspended in a human-shaped 256-electrode torso tank. Tank potentials were recorded during sinus rhythm before and after introducing repolarization inhomogeneities through local perfusion with dofetilide and/or pinacidil. Drug-induced repolarization gradients were investigated from BSPMs at different experiment phases. Dispersion of electrical recovery was quantified by duration parameters, i.e., the time interval between the peak and the offset of T-wave (TPEAK-TEND) and QT interval, and variability over time and electrodes was also assessed. The degree of T-wave symmetry to the peak was quantified by the ratio between the terminal and initial portions of T-wave area (Asy). Morphological variability between left and right BSPM electrodes was measured by dynamic time warping (DTW). Finally, T-wave organization was assessed by the complexity of repolarization index (CR), i.e., the amount of energy non-preserved by the dominant eigenvector computed by principal component analysis (PCA), and the error between each multilead T-wave and its 3D PCA approximation (NMSE). Body surface indices were compared with global measures of epicardial dispersion of repolarization, and with local gradients between adjacent ventricular sites.
Results: After drug intervention, both regional and global repolarization heterogeneity were significantly enhanced. On the body surface, TPEAK-TEND was significantly prolonged and less stable in time in all experiments, while QT interval showed higher variability across the interventions in terms of duration and spatial dispersion. The rising slope of the repolarization profile was steeper, and T-waves were more asymmetric than at baseline. Interventricular shape dissimilarity was enhanced by repolarization gradients according to DTW. Organized T-wave patterns were associated with abnormal repolarization, and they were properly described by the first principal components.
Conclusion: Repolarization heterogeneity significantly affects T-wave properties, and can be non-invasively captured by BSPM-based metrics.
Keywords: T-wave; body surface potential mapping; electrocardiology; sudden cardiac death; ventricular repolarization heterogeneity.
Copyright © 2020 Meo, Bonizzi, Bear, Cluitmans, Abell, Haïssaguerre, Bernus and Dubois.
Figures
Similar articles
-
Steep repolarization time gradients in pig hearts cause distinct changes in composite electrocardiographic T-wave parameters.Ann Noninvasive Electrocardiol. 2022 Nov;27(6):e12994. doi: 10.1111/anec.12994. Epub 2022 Aug 19. Ann Noninvasive Electrocardiol. 2022. PMID: 35986562 Free PMC article.
-
Optical Imaging of Ventricular Action Potentials in a Torso Tank: A New Platform for Non-Invasive Electrocardiographic Imaging Validation.Front Physiol. 2019 Feb 26;10:146. doi: 10.3389/fphys.2019.00146. eCollection 2019. Front Physiol. 2019. PMID: 30863318 Free PMC article.
-
Cellular basis for QT dispersion.J Electrocardiol. 1998;30 Suppl:168-75. doi: 10.1016/s0022-0736(98)80070-8. J Electrocardiol. 1998. PMID: 9535495
-
[Heterogeneities of ventricular repolarization and vulnerability to arrhythmia. How to detect them with noninvasive methods?].Cardiologia. 1999 Apr;44(4):355-60. Cardiologia. 1999. PMID: 10371787 Review. Italian.
-
Transmural dispersion of repolarization and arrhythmogenicity: the Brugada syndrome versus the long QT syndrome.J Electrocardiol. 1999;32 Suppl:158-65. doi: 10.1016/s0022-0736(99)90074-2. J Electrocardiol. 1999. PMID: 10688320 Review.
Cited by
-
Myocardial viability testing: all STICHed up, or about to be REVIVED?Eur Heart J. 2022 Jan 13;43(2):118-126. doi: 10.1093/eurheartj/ehab729. Eur Heart J. 2022. PMID: 34791132 Free PMC article.
-
Steep repolarization time gradients in pig hearts cause distinct changes in composite electrocardiographic T-wave parameters.Ann Noninvasive Electrocardiol. 2022 Nov;27(6):e12994. doi: 10.1111/anec.12994. Epub 2022 Aug 19. Ann Noninvasive Electrocardiol. 2022. PMID: 35986562 Free PMC article.
-
Body Surface Potential Mapping: Contemporary Applications and Future Perspectives.Hearts (Basel). 2021 Dec;2(4):514-542. doi: 10.3390/hearts2040040. Epub 2021 Nov 5. Hearts (Basel). 2021. PMID: 35665072 Free PMC article.
-
Commentary: Assessment of Hypertension Using Clinical Electrocardiogram Features: A First-Ever Review.Front Med (Lausanne). 2021 Jul 5;8:691330. doi: 10.3389/fmed.2021.691330. eCollection 2021. Front Med (Lausanne). 2021. PMID: 34291065 Free PMC article. No abstract available.
-
Myocardial Viability Testing in the Management of Ischemic Heart Failure.Life (Basel). 2022 Nov 1;12(11):1760. doi: 10.3390/life12111760. Life (Basel). 2022. PMID: 36362914 Free PMC article. Review.
References
LinkOut - more resources
Full Text Sources