

Human and Bovine Milk Oligosaccharides Elicit Improved Recognition Memory Concurrent With Alterations in Regional Brain Volumes and Hippocampal mRNA Expression
- PMID: 32903658
- PMCID: PMC7438728
- DOI: 10.3389/fnins.2020.00770
Human and Bovine Milk Oligosaccharides Elicit Improved Recognition Memory Concurrent With Alterations in Regional Brain Volumes and Hippocampal mRNA Expression
Abstract
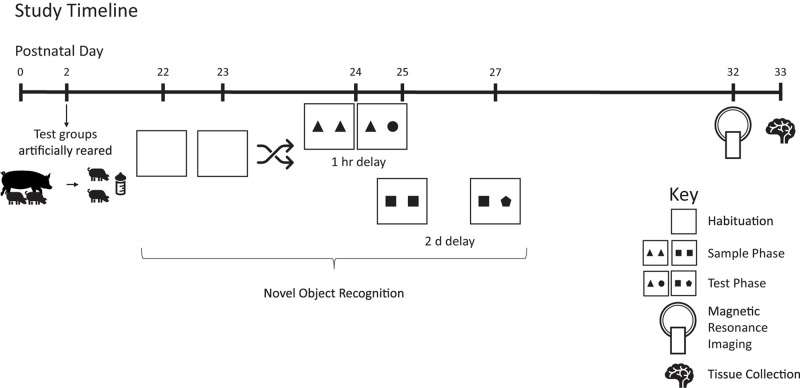
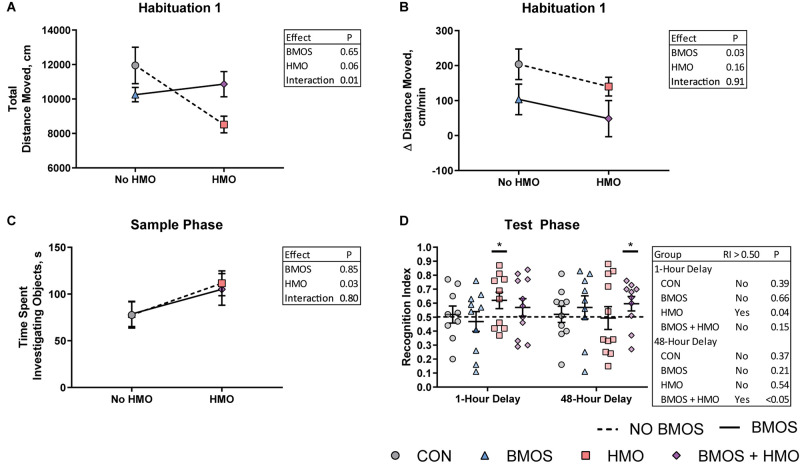
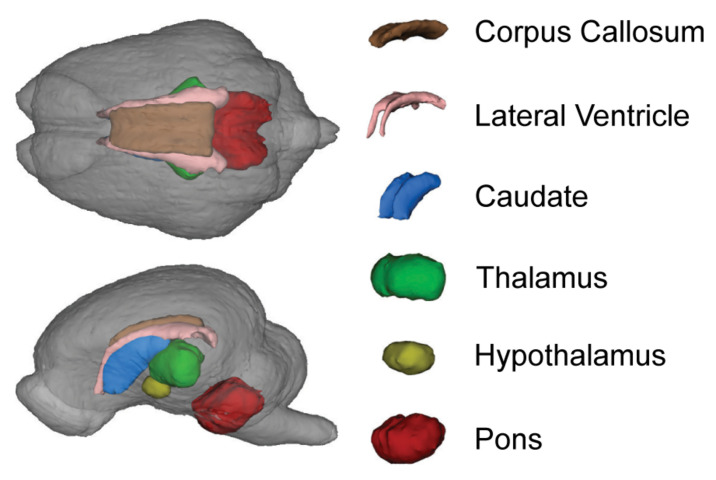
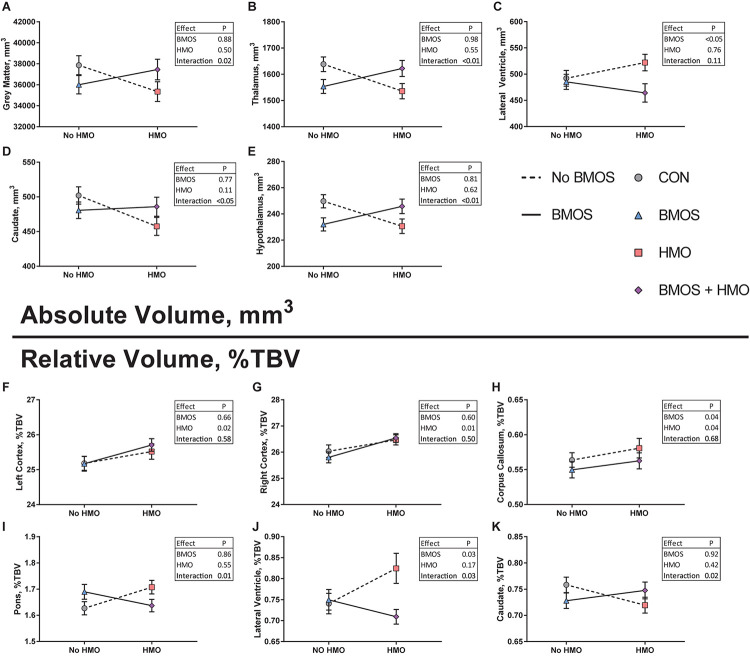
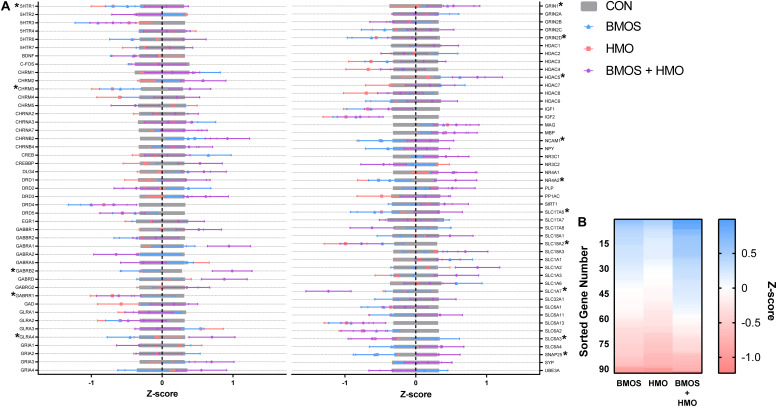
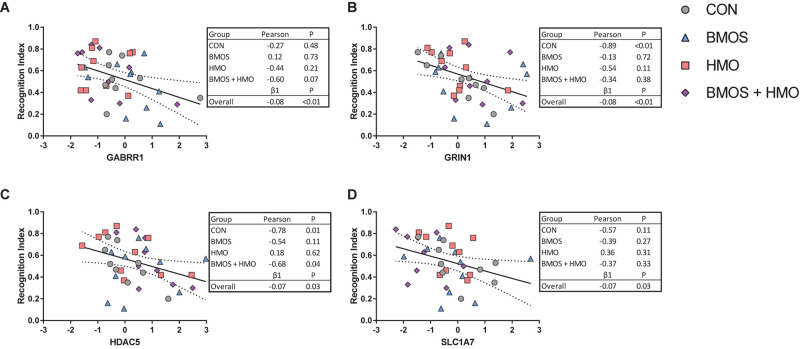
Human milk contains a unique profile of oligosaccharides (OS) and preliminary evidence suggests they impact brain development. The objective of this study was to assess the impact of bovine and/or human milk oligosaccharides (HMO) (2'-fucosyllactose and Lacto-N-neotetraose) on cognition, brain development, and hippocampal gene expression. Beginning on postnatal day (PND) 2, male pigs received one of four milk replacers containing bovine milk oligosaccharides (BMOS), HMO, both (BMOS + HMO), or neither. Pigs were tested on the novel object recognition task using delays of 1- or 48-h at PND 22. At PND 32-33, magnetic resonance imaging procedures were used to assess structural brain development and hippocampal tissue was collected for analysis of mRNA expression. Pigs consuming only HMO exhibited recognition memory after a 1-h delay and those consuming BMOS + HMO exhibited recognition memory after a 48-h delay. Both absolute and relative volumes of cortical and subcortical brain regions were altered by diet. Hippocampal mRNA expression of GABRB2, SLC1A7, CHRM3, and GLRA4 were most strongly affected by diet. HMO and BMOS had distinct effects on brain structure and cognitive performance. These data suggest different mechanisms underlie their influence on brain development.
Keywords: brain; cognition; human milk oligosaccharides (HMOs); milk; neuroimaging; nutrition; pig; prebiotics.
Copyright © 2020 Fleming, Mudd, Hauser, Yan, Metairon, Steiner, Donovan and Dilger.
Figures
Similar articles
-
Formula supplementation with human and bovine milk oligosaccharides modulates blood IgG and T-helper cell populations, and ex vivo LPS-stimulated cytokine production in a neonatal preclinical model.Front Immunol. 2023 Dec 20;14:1327853. doi: 10.3389/fimmu.2023.1327853. eCollection 2023. Front Immunol. 2023. PMID: 38179055 Free PMC article.
-
The Protective and Long-Lasting Effects of Human Milk Oligosaccharides on Cognition in Mammals.Nutrients. 2020 Nov 21;12(11):3572. doi: 10.3390/nu12113572. Nutrients. 2020. PMID: 33233361 Free PMC article. Review.
-
Dietary Oligofructose Alone or in Combination with 2'-Fucosyllactose Differentially Improves Recognition Memory and Hippocampal mRNA Expression.Nutrients. 2020 Jul 17;12(7):2131. doi: 10.3390/nu12072131. Nutrients. 2020. PMID: 32709093 Free PMC article.
-
Bovine Milk Oligosaccharides and Human Milk Oligosaccharides Modulate the Gut Microbiota Composition and Volatile Fatty Acid Concentrations in a Preclinical Neonatal Model.Microorganisms. 2021 Apr 21;9(5):884. doi: 10.3390/microorganisms9050884. Microorganisms. 2021. PMID: 33919138 Free PMC article.
-
Human Milk Oligosaccharides Influence Neonatal Mucosal and Systemic Immunity.Ann Nutr Metab. 2016;69 Suppl 2(Suppl 2):42-51. doi: 10.1159/000452818. Epub 2017 Jan 20. Ann Nutr Metab. 2016. PMID: 28103609 Free PMC article. Review.
Cited by
-
Formula supplementation with human and bovine milk oligosaccharides modulates blood IgG and T-helper cell populations, and ex vivo LPS-stimulated cytokine production in a neonatal preclinical model.Front Immunol. 2023 Dec 20;14:1327853. doi: 10.3389/fimmu.2023.1327853. eCollection 2023. Front Immunol. 2023. PMID: 38179055 Free PMC article.
-
Human Milk Oligosaccharides: A Comprehensive Review towards Metabolomics.Children (Basel). 2021 Sep 14;8(9):804. doi: 10.3390/children8090804. Children (Basel). 2021. PMID: 34572236 Free PMC article. Review.
-
The Effects of Breastfeeding on Childhood Behavioral and Emotional Development: A Prospective Cohort Study in China.Nutrients. 2024 Jun 2;16(11):1743. doi: 10.3390/nu16111743. Nutrients. 2024. PMID: 38892676 Free PMC article.
-
The Protective and Long-Lasting Effects of Human Milk Oligosaccharides on Cognition in Mammals.Nutrients. 2020 Nov 21;12(11):3572. doi: 10.3390/nu12113572. Nutrients. 2020. PMID: 33233361 Free PMC article. Review.
-
Influence of 2'-Fucosyllactose and Bifidobacterium longum Subspecies infantis Supplementation on Cognitive and Structural Brain Development in Young Pigs.Front Neurosci. 2022 Apr 25;16:860368. doi: 10.3389/fnins.2022.860368. eCollection 2022. Front Neurosci. 2022. PMID: 35546890 Free PMC article.
References
-
- Baudry M. (2001). “Long-term Potentiation (Hippocampus),” in International Encyclopedia of the Social & Behavioral Sciences, Ed. Baltes P. (Amsterdam: Elsevier; ), 9081–9083. 10.1016/B0-08-043076-7/03435-5 - DOI
-
- Comstock S. S., Li M., Wang M., Monaco M. H., Kuhlenschmidt T. B., Kuhlenschmidt M. S., et al. (2017). Dietary human milk oligosaccharides but not prebiotic oligosaccharides increase circulating natural killer cell and mesenteric lymph node memory t cell populations in noninfected and rotavirus-infected neonatal piglets. J. Nutr. 147 1041–1047. 10.3945/jn.116.243774 - DOI - PMC - PubMed
LinkOut - more resources
Full Text Sources