. 2020 Aug 5:10:1356.
doi: 10.3389/fonc.2020.01356. eCollection 2020.

The Positive Lymph Node Ratio Predicts Survival in T1-4N1-3M0 Non-Small Cell Lung Cancer: A Nomogram Using the SEER Database

Affiliations

The Positive Lymph Node Ratio Predicts Survival in T1-4N1-3M0 Non-Small Cell Lung Cancer: A Nomogram Using the SEER Database

Yi Liao et al. Front Oncol. .

Abstract

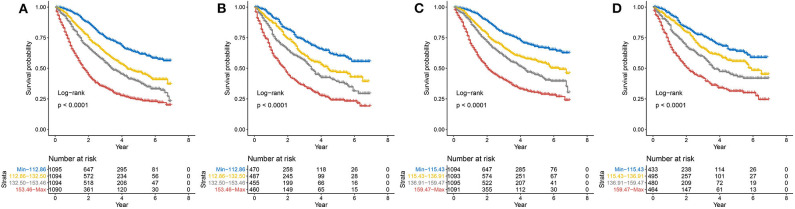
Background: An increasing number of studies have shown that the positive lymph node ratio (pLNR) can be used to evaluate the prognosis of non-small cell lung cancer (NSCLC) patients. To determine the predictive value of the pLNR, we collected data from the Surveillance, Epidemiology, and End Results (SEER) database and performed a retrospective analysis. Methods: We collected survival and clinical information on patients with T1-4N1-3M0 NSCLC diagnosed between 2010 and 2016 from the SEER database and screened them according to inclusion and exclusion criteria. X-tile software was used to obtain the best cut-off value for the pLNR. Then, we randomly divided patients into a training set and a validation set at a ratio of 7:3. Pearson's correlation coefficient, tolerance and the variance inflation factor (VIF) were used to detect collinearity between variables. Univariate and multivariate Cox regression analyses were used to identify significant prognostic factors, and nomograms was constructed to visualize the results. The concordance index (C-index), calibration curves, and decision curve analysis (DCA) were used to assess the predictive ability of the nomogram. We divided the patient scores into four groups according to the interquartile interval and constructed a survival curve using Kaplan-Meier analysis. Results: A total of 6,245 patients were initially enrolled. The best cut-off value for the pLNR was determined to be 0.55. The nomogram contained 13 prognostic factors, including the pLNR. The pLNR was identified as an independent prognostic factor for both overall survival (OS) and cancer-specific survival (CSS). The C-index was 0.703 (95% CI, 0.695-0.711) in the training set and 0.711 (95% CI, 0.699-0.723) in the validation set. The calibration curves and DCA also indicated the good predictability of the nomogram. Risk stratification revealed a statistically significant difference among the four groups of patients divided according to quartiles of risk score. Conclusion: The nomogram containing the pLNR can accurately predict survival in patients with T1-4N1-3M0 NSCLC.

Keywords: SEER; nomogram; non-small cell lung cancer; positive lymph node; prognosis.


Figures

Figure 1
Figure 1
Kaplan-Meier curves of OS and CSS for patients with high and low pLNR in the training set [(A), OS; (C), CSS] and the validation set [(B), OS; (D), CSS]. OS, overall survival; CSS, cancer-specific survival; pLNR, positive lymph node ratio.
Figure 2
Figure 2
The forest map of Cox regression analysis. Univariate Cox regression analyses estimating the risk factors for OS (A) and CSS (B). OS, overall survival; CSS, cancer-specific survival. *Means P < 0.05.
Figure 3
Figure 3
The forest map of Cox regression analysis. Multivariate Cox regression analyses estimating the risk factors for OS (A) and CSS (B). OS, overall survival; CSS, cancer-specific survival. *Means P < 0.05.
Figure 4
Figure 4
Correlations between variables in the overall dataset. (A) The training set (B) and the validation set (C).
Figure 5
Figure 5
(A) Nomogram used to predict the 1-, 3- and 5-year OS rates of patients with T1−4N1−3M0 NSCLC. (B) Calibration curve of the nomogram for predicting the 1-, 3- and 5-year OS rates of patients with T1−4N1−3M0 NSCLC from the training set. Decision curve analysis of the AJCC 7th stage, nomogram and positive lymph node ratio (pLNR) for the 1- (C), 3- (D) and 5-year (E) OS rates of patients with T1−4N1−3M0 NSCLC from the training set. (F) Calibration curve of the nomogram for predicting the 1-, 3- and 5-year OS rates of patients with T1−4N1−3M0 NSCLC from the validation set. Decision curve analysis of the AJCC 7th stage, nomogram and pLNR for the 1- (G), 3- (H) and 5-year (I) OS rates of patients with T1−4N1−3M0 NSCLC from the validation set. OS, overall survival; pLNR, positive lymph node ratio; NSCLC, non-small cell lung cancer. For calibration curves, green, red, and black line represent 1, 3, and 5 years, respectively. For decision curve analysis, green represents the nomogram, red represents pLNR, and blue represents AJCC 7th stage.
Figure 6
Figure 6
(A) Nomogram used to predict the 1-, 3-, and 5-year CSS rates of patients with T1−4N1−3M0 NSCLC. (B) Calibration curve of the nomogram for predicting the 1-, 3-, and 5-year CSS rates of patients with T1−4N1−3M0 NSCLC from the training set. Decision curve analysis of the AJCC 7th stage, nomogram and positive lymph node ratio (pLNR) for the 1- (C), 3- (D) and 5-year (E) CSS rates of patients with T1−4N1−3M0 NSCLC from the training set. (F) Calibration curve of the nomogram for predicting the 1-, 3-, and 5-year CSS rates of patients with T1−4N1−3M0 NSCLC from the validation set. Decision curve analysis of the AJCC 7th stage, nomogram and pLNR for the 1- (G), 3- (H), and 5-year (I) CSS rates of patients with T1−4N1−3M0 NSCLC from the validation set. CSS, cancer-specific survival; pLNR, positive lymph node ratio; NSCLC, non-small cell lung cancer. For calibration curves, green, red, and black line represent 1, 3, and 5 years, respectively. For decision curve analysis, green represents the nomogram, red represents pLNR, and blue represents AJCC 7th stage.
Figure 7
Figure 7
Kaplan–Meier curves of risk group stratification within the training set for (A) OS and (B) CSS and within the validation set for (C) OS and (D) CSS. OS, overall survival; CSS, cancer-specific survival.

Similar articles

Cited by

References

    1. Bray F, Ferlay J, Soerjomataram I, Siegel RL, Torre LA, Jemal A. Global cancer statistics 2018: GLOBOCAN estimates of incidence and mortality worldwide for 36 cancers in 185 countries. CA Cancer J Clin. (2018) 68:394–424. 10.3322/caac.21492 - DOI - PubMed
    1. Ferlay J, Colombet M, Soerjomataram I, Mathers C, Parkin DM, Pineros M, et al. . Estimating the global cancer incidence and mortality in 2018: GLOBOCAN sources and methods. Int J Cancer. (2019) 144:1941–53. 10.1002/ijc.31937 - DOI - PubMed
    1. Yang D, Liu Y, Bai C, Wang X, Powell CA. Epidemiology of lung cancer and lung cancer screening programs in China and the United States. Cancer Lett. (2020) 468:82–7. 10.1016/j.canlet.2019.10.009 - DOI - PubMed
    1. Rami-Porta R, Bolejack V, Crowley J, Ball D, Kim J, Lyons G, et al. The IASLC lung cancer staging project: proposals for the revisions of the T descriptors in the forthcoming eighth edition of the TNM classification for lung cancer. J Thorac Oncol. (2015) 10:990–1003. 10.1097/JTO.0000000000000559 - DOI - PubMed
    1. Yang L, Wang S, Zhou Y, Lai S, Xiao G, Gazdar A, et al. . Evaluation of the 7th and 8th editions of the AJCC/UICC TNM staging systems for lung cancer in a large North American cohort. Oncotarget. (2017) 8:66784–95. 10.18632/oncotarget.18158 - DOI - PMC - PubMed

LinkOut - more resources