. 2020 Jul 30:11:777.
doi: 10.3389/fgene.2020.00777. eCollection 2020.

Integrative Analysis Revealing Human Heart-Specific Genes and Consolidating Heart-Related Phenotypes

Affiliations

Integrative Analysis Revealing Human Heart-Specific Genes and Consolidating Heart-Related Phenotypes

Jinsoo Ahn et al. Front Genet. .

Abstract

Elucidating expression patterns of heart-specific genes is crucial for understanding developmental, physiological, and pathological processes of the heart. The aim of the present study is to identify functionally and pathologically important heart-specific genes by performing the Ingenuity Pathway Analysis (IPA). Through a median-based analysis of tissue-specific gene expression based on the Genotype-Tissue Expression (GTEx) data, we identified 56 genes with heart-specific or elevated expressions in the heart (heart-specific/enhanced), among which three common heart-specific/enhanced genes and four atrial appendage-specific/enhanced genes were unreported regarding the heart. Differential expression analysis further revealed 225 differentially expressed genes (DEGs) between atrial appendage and left ventricle. Our integrative analyses of those heart-specific/enhanced genes and DEGs with IPA revealed enriched heart-related traits and diseases, consolidating evidence of relationships between these genes and heart function. Our reports on comprehensive identification of heart-specific/enhanced genes and DEGs and their relation to pathways associated with heart-related traits and diseases provided molecular insights into essential regulators of cardiac physiology and pathophysiology and potential new therapeutic targets for heart diseases.

Keywords: differentially expressed genes; gene expression; heart disease; heart-specific genes; ingenuity pathway analysis.


Figures

FIGURE 1
FIGURE 1
Schematic diagram of the approach. Gene expression values (TPMs) across 47 human tissues including atrial appendage (AA) and left ventricle (LV) were collected from the GTEx v7 study. Following analyses were proceeded to: (i) collect genes with TPM > 0.1 in at least 20% of samples and median TPM > 0.5 in AA and LV, (ii) identify heart-specific/enhanced genes including protein-coding genes and DEGs, (iii) test enrichment of the top 500 genes having high relative median values and heart-specific/enhanced genes, (iv) perform text-mining of PubMed abstracts, and (v) conduct Ingenuity Pathway Analysis (IPA) for three groups (heart-specific/enhanced genes, DEGs, and unreported genes).
FIGURE 2
FIGURE 2
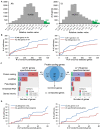
Distribution and classification of genes highly expressed in the heart. (A) Median TPMs in AA and LV are divided by an average of other tissues’ median TPMs, and the resulting relative median values (RMVs) are distributed. Green bars represent the top 500 genes with relative median values of more than 2.51-fold and 2.32-fold in AA and LV, respectively. (B) The number of enriched KEGG pathways were plotted against cumulatively increased randomly selected genes from two groups (all genes passed cutoffs and the top 500 genes) in AA and LV. (C) Types and numbers of heart-specific genes whose median expression is more than 5-fold higher in the heart compared to all other tissues (All 5-folds), and heart-enhanced genes whose median expression is more than 5-fold higher in heart tissue compared to all other tissues, except one tissue (5-folds, except 1) and two tissues (5-folds, except 2). The significance of differences under ANOVA-based test was set at a threshold of FDR < 0.01. Venn diagram shows genes whose expression is specific or enhanced in both AA and LV as indicated in the intersection (n = 32), among which four genes are unreported in PubMed regarding the heart. (D) Cumulative enrichment test for AA- and LV-specific genes with random selection.
FIGURE 3
FIGURE 3
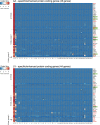
Heat maps of heart-specific and heart-enhanced genes. Visualization is based on relative median expression levels of heart-specific (all median 5-folds) and heart-enhanced (median 5-folds, except 1 & median 5-folds, except 2) genes in 47 human tissues [A1: Heart – Atrial Appendage, A2: Heart – Left Ventricle, and B through AT: 45 non-heart tissues (B: Muscle – Skeletal, C: Artery – Aorta, D: Artery – Coronary, E: Artery – Tibial, F: Adipose – Subcutaneous, G: Adipose – Visceral (Omentum), H: Adrenal Gland, I: Brain – Amygdala, J: Brain – Anterior cingulate cortex (BA24), K: Brain – Caudate (basal ganglia), L: Brain – Cerebellar Hemisphere, M: Brain – Cerebellum, N: Brain – Cortex, O: Brain – Frontal Cortex (BA9), P: Brain – Hippocampus, Q: Brain – Hypothalamus, R: Brain – Nucleus accumbens (basal ganglia), S: Brain – Putamen (basal ganglia), T: Brain – Spinal cord (cervical c-1), U: Brain – Substantia nigra, V: Breast – Mammary Tissue, W: Colon – Sigmoid, X: Colon – Transverse, Y: Esophagus – Gastroesophageal Junction, Z: Esophagus – Mucosa, AA: Esophagus – Muscularis, AB: Kidney – Cortex, AC: Liver, AD: Lung, AE: Minor Salivary Gland, AF: Nerve – Tibial, AG: Ovary, AH: Pancreas, AI: Pituitary, AJ: Prostate, AK: Skin – Not Sun Exposed (Suprapubic), AL: Skin – Sun Exposed (Lower leg), AM: Small Intestine – Terminal Ileum, AN: Spleen, AO: Stomach, AP: Testis, AQ: Thyroid, AR: Uterus, AS: Vagina, AT: Whole Blood)]. Genes specific or enhanced in either atrial appendage or left ventricle are shown in red letters, and common genes overlapping between atrial appendage and left ventricle are denoted by black letters. Functionally unreported heart-specific/enhanced genes are indicated with green filled rectangles. Tissues with less than a 5-fold difference in medians are marked with black unfilled rectangles in the heat maps. Z-scores of RMVs were calculated by heatmap3 for each row (i.e., each gene). By selecting the heart-specific/enhanced genes, heat maps were skewed to positive z-scores compared to Supplementary Figures S2, S3. |z-score| ≥ 2 indicates at least 2 standard deviation from the mean.
FIGURE 4
FIGURE 4
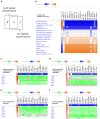
IPA Comparison Analysis of specific/enhanced protein-coding and non-coding genes in 20 tissues. (A) A diagram showing an intersection of 53 common-specific/enhanced genes (α), 81 AA-specific/enhanced genes (α + β), and 79 LV-specific/enhanced genes (α + γ). (B) A heat map of enriched ‘Diseases and Biological Functions’ with common-specific/enhanced genes (α). For each tissue, log2RMV and FDR of each gene compared to other tissues were calculated by the limma package as an input for the analysis. Enriched IPA terms out of ∼900 ‘Diseases and Biological Functions’ terms are listed. Activation z-scores calculated by IPA software indicate prediction of activation (orange) or inhibition (blue) of each pathway in each tissue. Ranges of color keys were automatically selected by IPA software, and a significant activation z-score was set to greater than or equal to 2 standard deviation (i.e., |z-score| ≥ 2) and dots denote non-significant z-scores (i.e., | z-score| < 2). (C–F) Gene Heatmaps for Canonical Pathways of ‘Factors Promoting Cardiogenesis in Vertebrates’ (C,D) and ‘Actin Cytoskeleton Signaling’ (E,F). Activation z-scores of canonical pathways and expression log ratios (i.e., log2RMV) of AA-specific/enhanced genes (α + β) (C,E) and LV-specific/enhanced genes (α + γ) (D,F) are displayed. Overall, symbols for each tissue (A1 or A2 through AQ) are consistent with Figure 3.
FIGURE 5
FIGURE 5
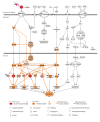
Canonical Pathway of ‘Promoting Cardiogenesis in Vertebrates’ in IPA with AA-specific/enhanced genes in Figure 4C. Up-regulated expression in AA was indicated with red nodes. Prediction of activation for molecules (nodes) and for relations (lines) are colored with orange. The color intensity represents the relative magnitude of changes in gene expression or prediction of activation. Direct and indirect relations are indicated by solid and dashed lines, respectively. White molecules represent their absence in the input gene set. Gray lines indicate that direction of change was not predicted. Number one on the top left of the genes indicate a single form. Blue stars indicate LV-enhanced genes, MYH7 and MYL2, in Figure 4D, that were up-regulated in the case of LV regarding this canonical pathway. Data were analyzed through IPA to generate the canonical pathway (https://www.qiagenbioinformatics.com/products/ingenuity-pathway-analysis).
FIGURE 6
FIGURE 6
Canonical Pathway of ‘Actin Cytoskeleton Signaling’ in IPA with AA-specific/enhanced genes in Figure 4E. Details of figure legends are in Figure 5. Molecules in blue box indicate a LV-specific gene (MYL3) and LV-enhanced genes (MYH7 and MYL2) in Figure 4F, that were up-regulated with this canonical pathway in the case of LV.
FIGURE 7
FIGURE 7
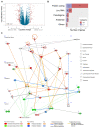
Relationship between a network of DEGs and the canonical calcium signaling pathway. (A) Differential expression analysis of 23,610 genes and volcano plot representation of DEGs. The negative log10-transformed adjusted p-value was plotted against the log ratios (fold change) between AA and LV. Red dots represent 236 and 105 DEGs in AA and LV, respectively, that show both at least 8-fold changes and high statistical significance (FDR < 0.01). (B) DEGs were categorized into five groups including protein-coding, lincRNA, pseudogene, antisense RNA, and others (processed transcript and sense intronic). Numbers of DEGs in each category are marked on the bar graph. (C) The top scoring IPA network related to DEGs: ‘Cardiovascular System Development and Function, Embryonic development, Organ development’. Up- (red) and down- (green) regulated genes (nodes) are indicated. Orange and blue lines indicate prediction of activation and inhibition, respectively, while gray lines indicate no prediction for direction of changes. Solid and dashed lines represent direct and indirect relations, respectively. Calcium signaling is shown as a pathway that has the highest prediction of activation. CP, canonical pathway. The networks were generated through IPA (QIAGEN Inc., https://www.qiagenbioinformatics.com/products/ingenuity-pathway-analysis).
FIGURE 8
FIGURE 8
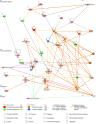
Networks of an unreported AA-specific/enhanced DEG (CHRNE). AMPK signaling and calcium signaling are shown as related pathways in the networks. CP, canonical pathway. A Blue star pointed CHRNE which is unreported regarding the heart. Details regarding the network in Figure 7C.
FIGURE 9
FIGURE 9
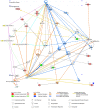
A network analysis for an unreported AA-specific/enhanced DEG (PRR32) indicated with a blue star. Relationships between genes (nodes) and heart diseases (cardiac fibrosis, cardiac hypertrophy, and cardiac necrosis/cell death) are indicated. Tx, toxicity-related lists. Details on the network are in Figure 7C.

References

    1. Ahn J., Wu H., Lee K. (2019). Integrative analysis revealing human adipose-specific genes and consolidating obesity loci. Sci. Rep. 9:3087. - PMC - PubMed
    1. Bao Z. Z., Bruneau B. G., Seidman J. G., Seidman C. E., Cepko C. L. (1999). Regulation of chamber-specific gene expression in the developing heart by Irx4. Science 283 1161–1164. 10.1126/science.283.5405.1161 - DOI - PubMed
    1. Barth A. S., Merk S., Arnoldi E., Zwermann L., Kloos P., Gebauer M., et al. (2005). Functional profiling of human atrial and ventricular gene expression. Pflugers. Arch. 450 201–208. 10.1007/s00424-005-1404-8 - DOI - PubMed
    1. Benjamini A., Hochberg Y. (1995). Controlling the false discovery rate: a practical and powerful approach to multiple testing. J. R. Stat. Soc. B Stat. Methodol. 57 289–300. 10.1111/j.2517-6161.1995.tb02031.x - DOI
    1. Bi X., He X., Xu M., Zhao M., Yu X., Lu X., et al. (2015). Acetylcholine ameliorates endoplasmic reticulum stress in endothelial cells after hypoxia/reoxygenation via M3 AChR-AMPK signaling. Cell Cycle 14 2461–2472. 10.1080/15384101.2015.1060383 - DOI - PMC - PubMed

LinkOut - more resources