

In silico Hierarchical Clustering of Neuronal Populations in the Rat Ventral Tegmental Area Based on Extracellular Electrophysiological Properties
- PMID: 32903825
- PMCID: PMC7438989
- DOI: 10.3389/fncir.2020.00051
In silico Hierarchical Clustering of Neuronal Populations in the Rat Ventral Tegmental Area Based on Extracellular Electrophysiological Properties
Abstract
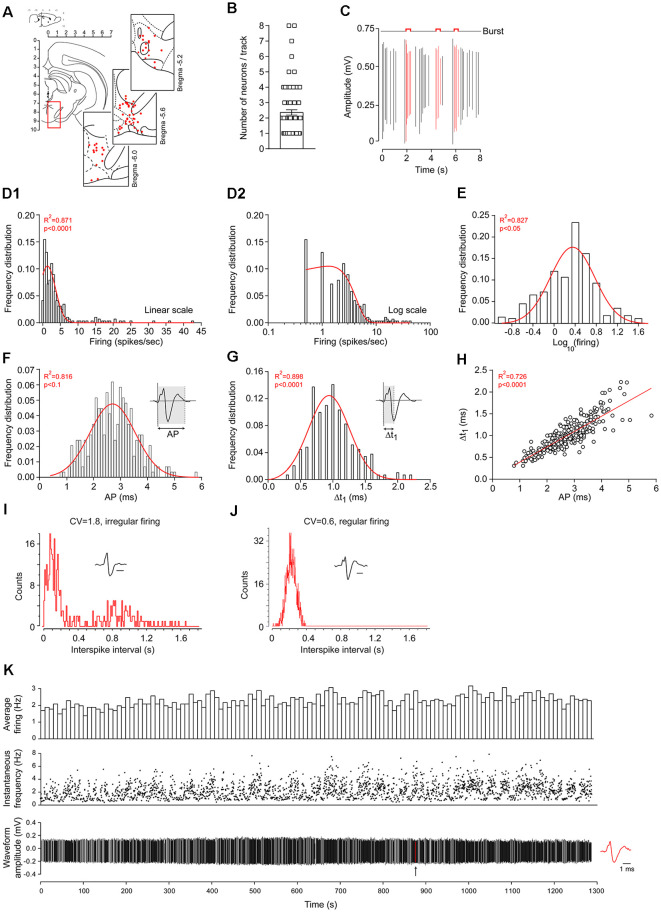
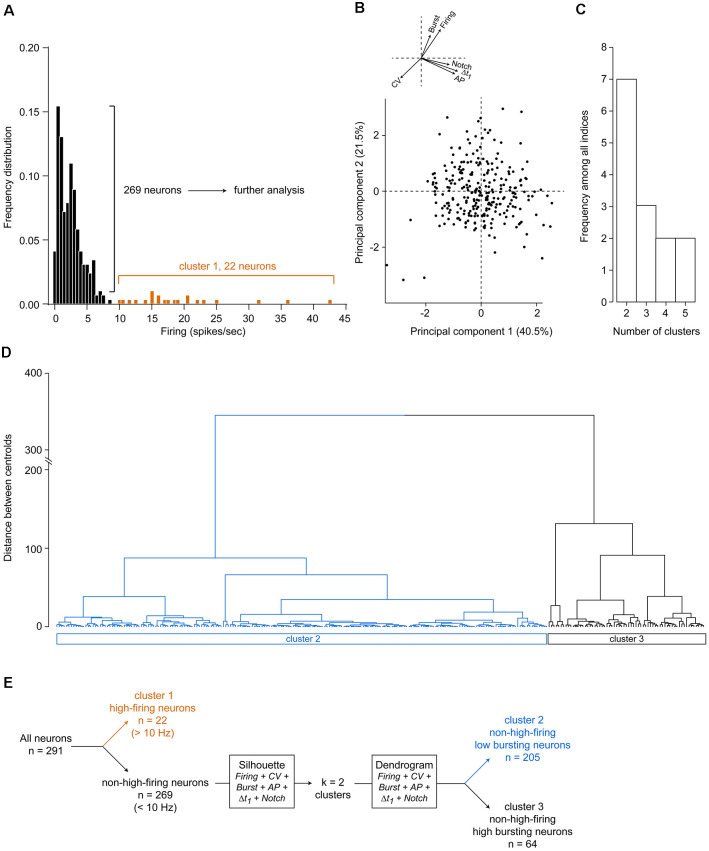
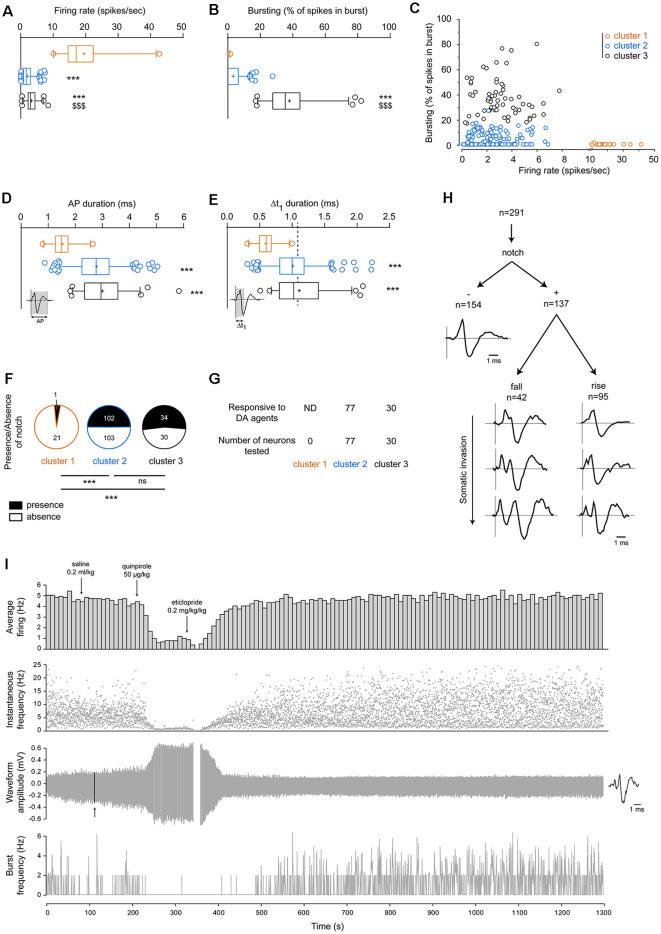
The ventral tegmental area (VTA) is a heterogeneous brain region, containing different neuronal populations. During in vivo recordings, electrophysiological characteristics are classically used to distinguish the different populations. However, the VTA is also considered as a region harboring neurons with heterogeneous properties. In the present study, we aimed to classify VTA neurons using in silico approaches, in an attempt to determine if homogeneous populations could be extracted. Thus, we recorded 291 VTA neurons during in vivo extracellular recordings in anesthetized rats. Initially, 22 neurons with high firing rates (>10 Hz) and short-lasting action potentials (AP) were considered as a separate subpopulation, in light of previous studies. To segregate the remaining 269 neurons, presumably dopaminergic (DA), we performed in silico analyses, using a combination of different electrophysiological parameters. These parameters included: (1) firing rate; (2) firing rate coefficient of variation (CV); (3) percentage of spikes in a burst; (4) AP duration; (5) Δt1 duration (i.e., time from initiation of depolarization until end of repolarization); and (6) presence of a notched AP waveform. Unsupervised hierarchical clustering revealed two neuronal populations that differed in their bursting activities. The largest population presented low bursting activities (<17.5% of total spikes in burst), while the remaining neurons presented higher bursting activities (>17.5%). Within non-high-firing neurons, a large heterogeneity was noted concerning AP characteristics. In conclusion, this analysis based on conventional electrophysiological criteria clustered two subpopulations of putative DA VTA neurons that are distinguishable by their firing patterns (firing rates and bursting activities) but not their AP properties.
Keywords: VTA; dopaminergic neurons; electrophysiology; hierarchical clustering; neurophysiology.
Copyright © 2020 Di Miceli, Husson, Ruel, Layé, Cota, Fioramonti, Bosch-Bouju and Gronier.
Figures
Similar articles
-
Ih blockade reduces cocaine-induced firing patterns of putative dopaminergic neurons of the ventral tegmental area in the anesthetized rat.Prog Neuropsychopharmacol Biol Psychiatry. 2022 Jan 10;112:110431. doi: 10.1016/j.pnpbp.2021.110431. Epub 2021 Aug 27. Prog Neuropsychopharmacol Biol Psychiatry. 2022. PMID: 34454991 Free PMC article.
-
A subpopulation of neurochemically-identified ventral tegmental area dopamine neurons is excited by intravenous cocaine.J Neurosci. 2015 Feb 4;35(5):1965-78. doi: 10.1523/JNEUROSCI.3422-13.2015. J Neurosci. 2015. PMID: 25653355 Free PMC article.
-
Medial prefrontal cortical output neurons to the ventral tegmental area (VTA) and their responses to burst-patterned stimulation of the VTA: neuroanatomical and in vivo electrophysiological analyses.Synapse. 1999 Dec 15;34(4):245-55. doi: 10.1002/(SICI)1098-2396(19991215)34:4<245::AID-SYN1>3.0.CO;2-D. Synapse. 1999. PMID: 10529719
-
Increased burst-firing of ventral tegmental area dopaminergic neurons in D-amino acid oxidase knockout mice in vivo.Eur J Neurosci. 2014 Oct;40(7):2999-3009. doi: 10.1111/ejn.12667. Epub 2014 Jul 5. Eur J Neurosci. 2014. PMID: 25040393
-
Dissecting the diversity of midbrain dopamine neurons.Trends Neurosci. 2013 Jun;36(6):336-42. doi: 10.1016/j.tins.2013.03.003. Epub 2013 Apr 12. Trends Neurosci. 2013. PMID: 23582338 Review.
Cited by
-
Hierarchical organization of the forebrain cholinergic system in rats.iScience. 2025 Feb 11;28(3):112001. doi: 10.1016/j.isci.2025.112001. eCollection 2025 Mar 21. iScience. 2025. PMID: 40124521 Free PMC article.
-
Identification of adult spinal Shox2 neuronal subpopulations based on unbiased computational clustering of electrophysiological properties.Front Neural Circuits. 2022 Aug 4;16:957084. doi: 10.3389/fncir.2022.957084. eCollection 2022. Front Neural Circuits. 2022. PMID: 35991345 Free PMC article.
-
Nonlinear relationship between CAN current and influx underpins synergistic action of muscarinic and NMDA receptors on bursts induction in midbrain dopaminergic neurons.Cogn Neurodyn. 2022 Jun;16(3):719-731. doi: 10.1007/s11571-021-09740-8. Epub 2022 Jan 17. Cogn Neurodyn. 2022. PMID: 35603052 Free PMC article.
-
Functional architecture of the forebrain cholinergic system in rodents.Res Sq [Preprint]. 2024 Jun 19:rs.3.rs-4504727. doi: 10.21203/rs.3.rs-4504727/v1. Res Sq. 2024. Update in: iScience. 2025 Feb 11;28(3):112001. doi: 10.1016/j.isci.2025.112001. PMID: 38947053 Free PMC article. Updated. Preprint.
References
-
- Ackerman J. M., Johansen P. A., Clark D., White F. J. (1993). Electrophysiological effects of putative autoreceptor-selective dopamine agonists on A10 dopamine neurons. J. Pharmacol. Exp. Ther. 265, 963–970. - PubMed
Publication types
MeSH terms
LinkOut - more resources
Full Text Sources