. 2020 Jul 30:8:678.
doi: 10.3389/fcell.2020.00678. eCollection 2020.

Cofilin-1 Is a Mechanosensitive Regulator of Transcription

Affiliations

Cofilin-1 Is a Mechanosensitive Regulator of Transcription

Catarina Domingues et al. Front Cell Dev Biol. .

Abstract

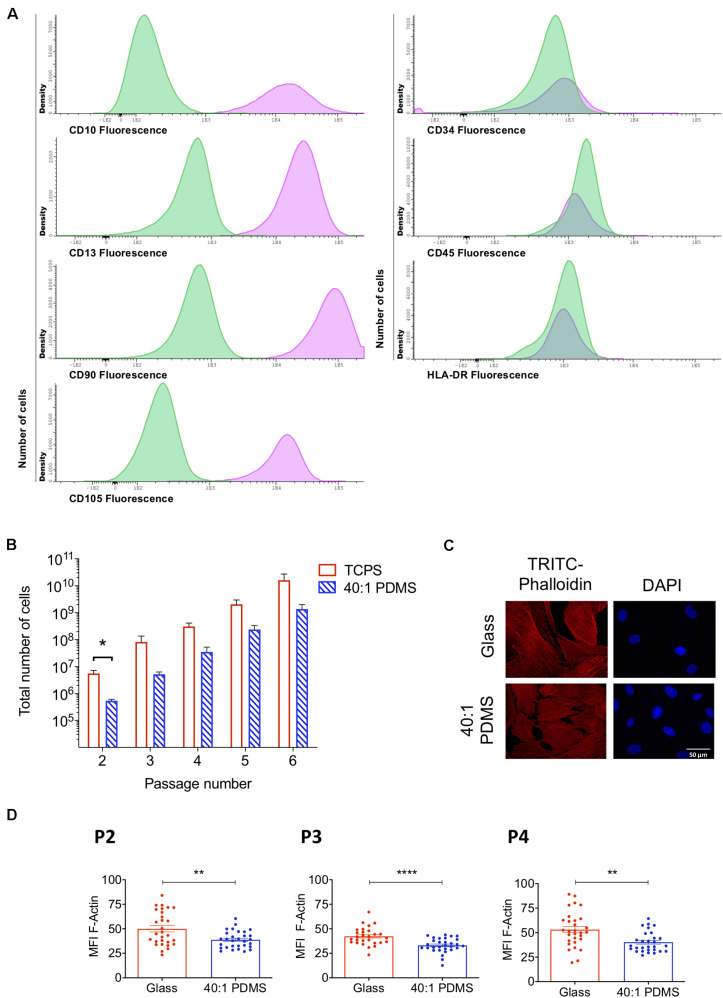
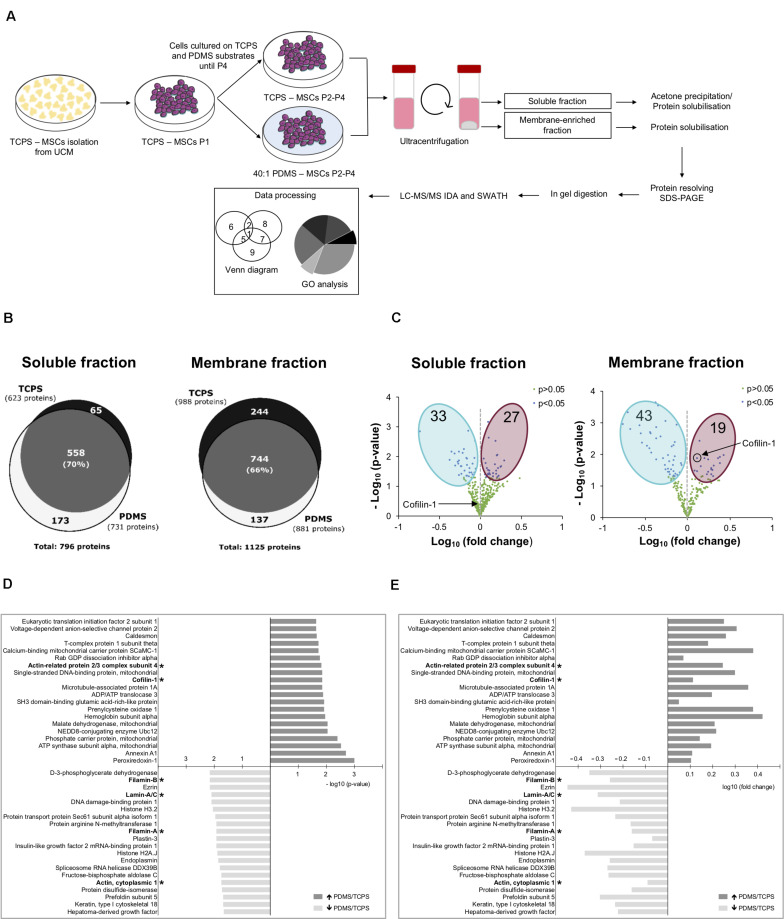
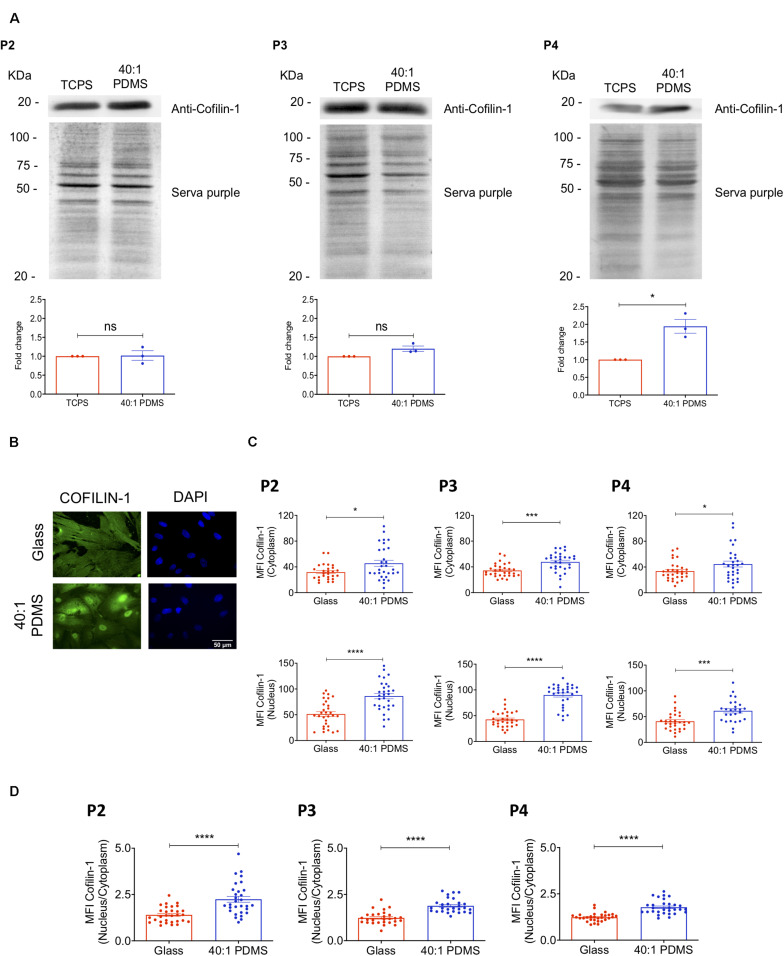
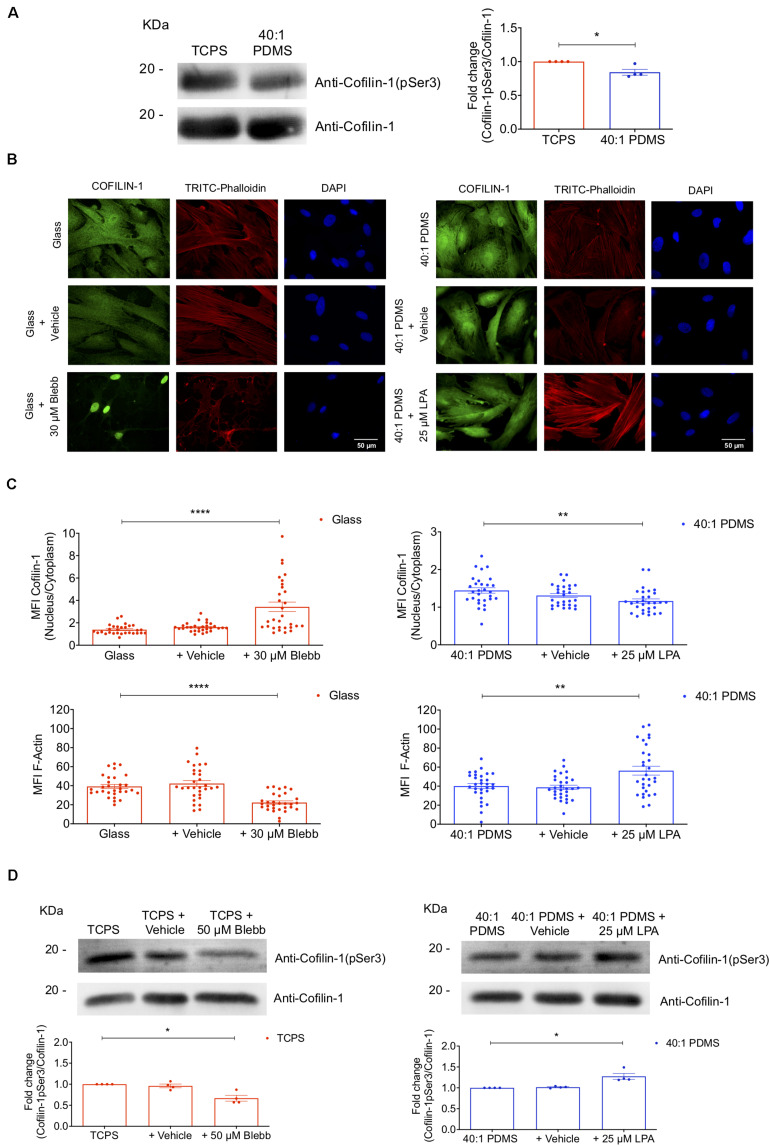
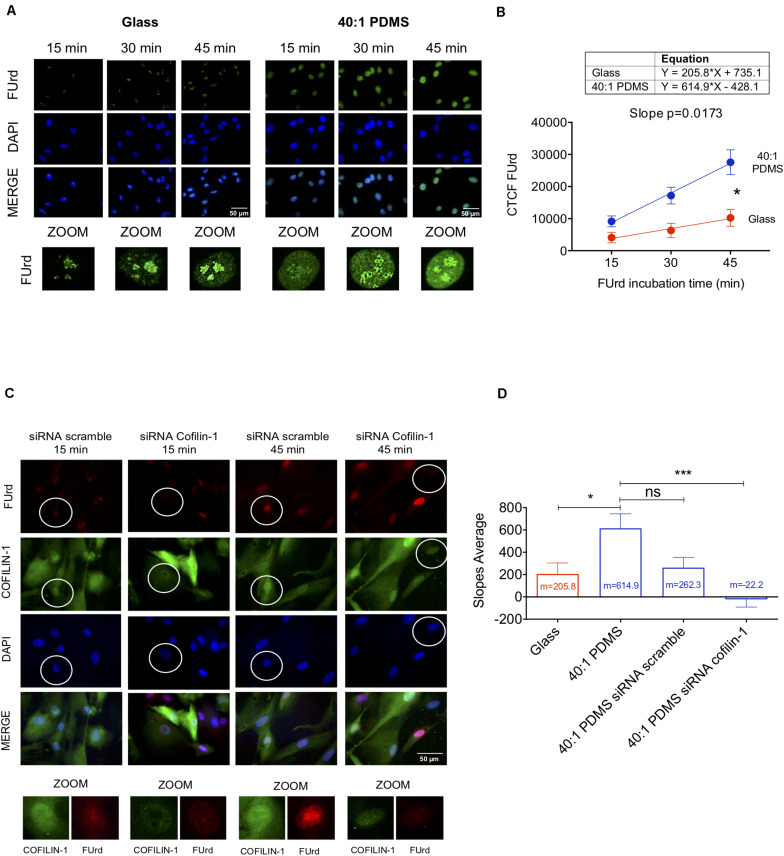
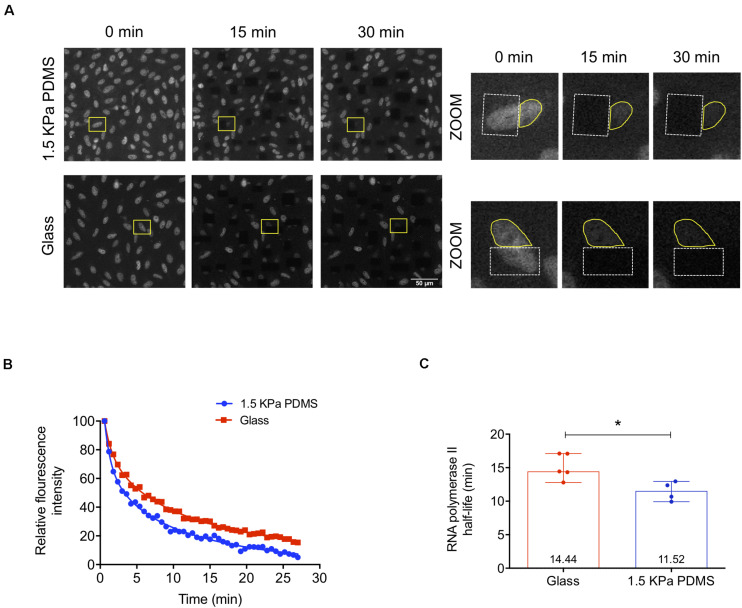
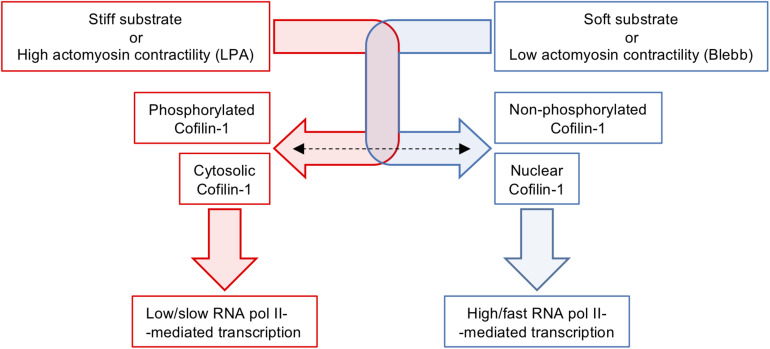
The mechanical properties of the extracellular environment are interrogated by cells and integrated through mechanotransduction. Many cellular processes depend on actomyosin-dependent contractility, which is influenced by the microenvironment's stiffness. Here, we explored the influence of substrate stiffness on the proteome of proliferating undifferentiated human umbilical cord-matrix mesenchymal stem/stromal cells. The relative abundance of several proteins changed significantly by expanding cells on soft (∼3 kPa) or stiff substrates (GPa). Many such proteins are associated with the regulation of the actin cytoskeleton, a major player of mechanotransduction and cell physiology in response to mechanical cues. Specifically, Cofilin-1 levels were elevated in cells cultured on soft comparing with stiff substrates. Furthermore, Cofilin-1 was de-phosphorylated (active) and present in the nuclei of cells kept on soft substrates, in contrast with phosphorylated (inactive) and widespread distribution in cells on stiff. Soft substrates promoted Cofilin-1-dependent increased RNA transcription and faster RNA polymerase II-mediated transcription elongation. Cofilin-1 is part of a novel mechanism linking mechanotransduction and transcription.

Keywords: Cofilin-1; cytoskeleton; hUCM-MSCs; mechanotransduction; proteomics; transcription.


Figures

FIGURE 1
FIGURE 1
hUCM-MSCs can proliferate on and respond to mechanical cues provided by a soft PDMS substrate. (A) Immunophenotypic characterisation of hUCM-MSCs (average of four independent samples at P4). Cells were labelled with antibodies against the indicated antigens and analysed by flow cytometry. In parallel, unlabelled hUCM-MSCs were also acquired in the flow cytometer as negative controls. In the histograms, y-axis represents the number of cells (density); and x-axis represents the amount of protein expressed per cell, measured as mean fluorescence intensity (MFI). Labelled hUCM-MSCs are represented as pink lines, whereas green lines correspond to unlabelled hUCM-MSCs (negative control). hUCM-MSCs were positive for CD10, CD13, CD90, and CD105, and negative for CD34, CD45 and HLA-DR. (B) Total number of cells calculated for hUCM-MSCs on each passage (P2–P6) in culture on TCPS or 40:1 PDMS (as indicated). Bars represent mean ± SEM of at least three independent experiments using cells obtained from different donors. Statistical analysis was performed using the non-parametric Mann–Whitney test with significant differences indicated as *p < 0.05. (C) Representative fluorescence microscopy images and (D), respective MFI of F-actin of hUCM-MSCs cultured on stiff or soft 40:1 PDMS substrates from P2 to P4 (as indicated). At each of the indicated passages, cells were seeded on stiff glass coverslips or soft 40:1 PDMS substrates for 48 h and then fixed and stained with TRITC-Phalloidin (to stain F-actin, in red) and DAPI (to counterstain nuclei, in blue). Bars represent mean ± SEM of three independent experiments. Statistical analysis was performed using a two-tailed Student’s t-test with significant differences indicated as **p < 0.01 and ****p < 0.0001.
FIGURE 2
FIGURE 2
Substrate stiffness influences the proteome of hUCM-MSCs. (A) Experimental workflow. hUCM-MSCs were isolated from umbilical cord explants obtained from three distinct donors on TCPS plates and passaged (into P1) when the colonies were well developed. Cells were then maintained in parallel in culture from P2 until P4 on stiff TCPS and soft 40:1 PDMS substrates. Cells were lysed and then the membrane- and soluble-enriched fractions were obtained by ultra-centrifugation. The proteins from the two fractions were precipitated and/or solubilised, resolved by SDS-PAGE and analysed by mass spectrometry. (B) Venn diagrams illustrating the total number of proteins and the number of exclusive and common proteins identified in cells cultured on TCPS or 40:1 PDMS present in the soluble (left) or membrane (right) enriched fractions. (C) Volcano plots representing proteins with statistically significant differences (p < 0.05, blue dots) or non-significant differences (p > 0.05, green dots) between proteins found in the proteome of soluble (left) and membrane (right) fractions obtained from cells cultured on soft PDMS substrates relative to stiff TCPS. The blue and magenta areas surround the proteins with statistically significant lower or higher expression in cells cultured on soft PDMS versus stiff TCPS, respectively. Black circle and arrows pinpoint Cofilin-1 found in soluble (left) and membrane (right) fractions of cells cultured on soft PDMS versus stiff TCPS. Statistical analysis was performed using One-Sample t-test (theoretical mean of 1.0). (D) Bar chart representing the top 20 most significant (p < 0.05) and (E) differentially abundant proteins (fold change) present in soluble and membrane fractions obtained from cells cultured on 40:1 PDMS versus TCPS substrates. (*) marks proteins involved in mechanotransduction or actin cytoskeleton regulation. Bars represent –log10 of the p-value (D) or log10 of the fold change (E). All data were collected from three independent experiments using cells obtained from three distinct donors.
FIGURE 3
FIGURE 3
Cofilin-1 is highly present in cells cultured on soft versus stiff substrates. (A) Western blot analysis (top) of Cofilin-1 present in whole-cell protein extracts (separated by SDS-PAGE) obtained from hUCM-MSCs isolated and cultured on TCPS until P1 and then cultured on stiff TCPS or soft 40:1 PDMS until P2, P3, or P4 (as indicated). For quantification analysis (bottom), Cofilin-1 expression was normalised using the respective total protein level assessed by staining the WB membrane using SERVA purple (top). Bars (bottom) represent mean ± SEM of three independent experiments. Statistical analysis was performed using One-Sample t-test (theoretical mean of 1.0) with significant differences indicated as *p < 0.05; ns, non-significant. (B) Representative fluorescence microscopy images and (C) respective MFI quantification of Cofilin-1 in the nucleus or cytoplasm of cells cultured on glass coverslips or 40:1 PDMS until P2, P3, or P4 (as indicated). (D) MFI quantification of Cofilin-1 ratio (nucleus/cytoplasm) present in cells cultured as in (C). Cells were fixed and stained with an anti-Cofilin-1 antibody (green) and DAPI for nuclear counterstaining (blue). In (C,D) bars represent mean ± SEM of cells analysed from three independent experiments. Statistical analysis was performed using a two-tailed Student’s t-test, with significant differences indicated as *p < 0.05, ***p < 0.001, and ****p < 0.0001.
FIGURE 4
FIGURE 4
Substrate stiffness and soluble modulators of actomyosin influence Cofilin-1 subcellular localisation and phosphorylation state. (A) Cofilin-1 and phospho-Cofilin-1 (pSer3) levels were evaluated by western blot analysis of whole-cell protein extracts separated by SDS-PAGE (left) obtained from cells cultured on TCPS or 40:1 PDMS between P2 and P4. For the quantification (right) values were normalised by the respective total Cofilin-1 protein level in TCPS or PDMS for each independent experiment. Bars represent the mean of the ratio of Cofilin-1 (pSer3)/total Cofilin-1 ± SEM of four independent experiments. Statistical analysis was performed using One-Sample t-test (theoretical mean of 1.0) with significant differences indicated as *p < 0.05. (B) Representative fluorescence microscopy images and (C) respective MFI quantification of Cofilin-1 nucleus/cytoplasm ratio and F-actin (TRITC-Phalloidin) for cells cultured on glass coverslips or 40:1 PDMS after treatment or not with Blebbistatin or LPA (as indicated). Cells seeded on stiff glass coverslips (left) were cultured for 24 h and then incubated or not with Blebbistatin (30 μM) for an additional 24 h; cells seeded on soft 40:1 PDMS (right) were cultured for 46 h and then incubated or not with LPA (25 μM) for an additional 2 h. In both cases, cells were fixed after 48 h in culture and stained with anti-Cofilin-1 antibody (green), TRITC-Phalloidin for F-actin (red) and DAPI for nuclear counterstaining (blue). Bars represent mean ± SEM of cells analysed from three independent experiments. Statistical analysis was performed using One-Way ANOVA followed by Dunnett’s multiple comparisons test between all conditions (**p < 0.01; ****p < 0.0001). (D) Western blot analyses were performed to detect Cofilin-1 and phospho-Cofilin-1 (pSer3) as described in (A), using whole-cell extracts obtained from cells cultured on stiff TCPS and treated or not with Blebbistatin or cultured on soft 40:1 PDMS and treated or not with LPA (as indicated), with seeding and treatment regimens similar to those described in (B,C). For the quantification (bottom) values were normalised by the respective total Cofilin-1 protein level in TCPS (left) or PDMS (right) for each independent experiment. Bars represent the mean of the ratio of Cofilin-1 (pSer3)/total Cofilin-1 ± SEM of four independent experiments. Statistical analysis was performed using One-Sample t-test (theoretical mean of 1.0) with significant differences indicated as *p < 0.05.
FIGURE 5
FIGURE 5
Soft substrates induce overall increased transcription in hUCM-MSCs in a Cofilin-1-dependent manner. (A) Representative fluorescence microscopy images of the nuclei of cells cultured on glass coverslips or 40:1 PDMS. After 48 h in culture, hUCM-MSCs were incubated with FUrd during 15, 30, and 45 min, fixed and stained with an anti-BrdU antibody that recognises FUrd (green) to identify the new transcripts and nuclei were counterstained with DAPI (blue). (B) Linear regression of FUrd nuclear incorporation (CTCF, corrected total cell fluorescence) as a function of time occurring in cells on each substrate (data represent mean ± SEM of 6 independent experiments). Linear regression analysis (using the linear regression tools of GraphPad Prism 8) shows that the slopes of the two curves are significantly different from each other (p = 0.0173), indicating increased transcriptional activity in cells cultured on soft PDMS substrates (blue line) when compared with glass (red). (C) Representative fluorescence microscopy images of FUrd incorporation during 15 and 45 min in control and Cofilin-1 knock-down cells (using siRNA). Cells were immunostained with anti-Cofilin-1 (green) and anti-BrdU/FUrd (red) antibodies and nuclei were counterstained with DAPI (blue). (D) Bars represent the mean ± SEM of the slope values of FUrd incorporation (as determined in B) for each of the indicated conditions. Only cells effectively knocked-down for Cofilin-1 (representative images highlighted with circles) were taken into account during corrected total cell fluorescence quantification of FUrd. Statistical analysis was performed for 6 independent experiments using One-Way ANOVA followed by Dunnett’s multiple comparisons test comparing all conditions against 40:1 PDMS (ns, non-significant; *p < 0.05; ***p < 0.001).
FIGURE 6
FIGURE 6
RNA polymerase II transcription elongation is faster in cells cultured on soft PDMS substrates. (A) Representative confocal microscopy images of MRC-5 cells (expressing GFP-RNA polymerase II) during fluorescence loss in photobleaching (FLIP) experiments. MRC-5 cells were cultured on stiff μ-slide glass wells or soft 1.5 kPa PDMS and after 72 h in culture cells were subjected to FLIP assay. In the zoomed images on the right panel (from the highlighted regions indicated with the yellow rectangles on the left panel), the dashed white lines circumscribe the bleached areas and the solid yellow lines represent the fluorescence measurement areas. (B) Representative three-phase exponential decay curves of GFP-RNA polymerase II signal of two single cells cultured on each substrate (glass or PDMS). (C) RNA polymerase II elongation half-life time was calculated based on the half-time slow parameter of the three-phase exponential decay curves obtained from cells cultured on stiff or soft substrates. Bars represent the median with range of at least four independent experiments. For each experiment, at least 10 cells were quantified. Statistical analysis was performed using the non-parametric Mann–Whitney test, with significant differences indicated as *p < 0.05.
FIGURE 7
FIGURE 7
Schematics illustrating the modulation of Cofilin-1 by substrates stiffness or soluble factors affecting intracellular contractility. Stiff substrates or actomyosin tension induced by LPA favour elevated levels of F-actin, Cofilin-1 phosphorylation and Cofilin-1 adopts a mainly cytosolic localisation. On the other hand, soft substrates or low actomyosin tension caused by treatment with Blebbistatin induce low amounts of F-actin, no Cofilin-1 phosphorylation and Cofilin-1 adopts a nuclear localisation. The presence of Cofilin-1 in the nucleus is consistent with enhanced/faster RNA polymerase II-dependent transcription.

References

    1. Anjo S. I., Santa C., Manadas B. (2015). Short GeLC-SWATH: a fast and reliable quantitative approach for proteomic screenings. Proteomics 15 757–762. 10.1002/pmic.201400221 - DOI - PubMed
    1. Anjo S. I., Santa C., Saraiva S. C., Freitas K., Barah F., Carreira B., et al. (2017). “Neuroproteomics using short GeLC-SWATH: from the evaluation of proteome changes to the clarification of protein function,” in Current Proteomic Approaches Applied to Brain Function, eds Santamaría E., Fernández-Irigoyen J. (Cham: Springer; ), 107–138. 10.1007/978-1-4939-7119-0_8 - DOI
    1. Aragona M., Panciera T., Manfrin A., Giulitti S., Michielin F., Elvassore N., et al. (2013). A mechanical checkpoint controls multicellular growth through YAP/TAZ regulation by actin-processing factors. Cell 154 1047–1059. 10.1016/j.cell.2013.07.042 - DOI - PubMed
    1. Bamburg J. R., Bernstein B. W. (2010). Roles of ADF/cofilin in actin polymerization and beyond. F1000 Biol. Rep. 2:62. - PMC - PubMed
    1. Burridge K., Guilluy C. (2016). Focal adhesions, stress fibers and mechanical tension. Exp. Cell Res. 343 14–20. 10.1016/j.yexcr.2015.10.029 - DOI - PMC - PubMed

LinkOut - more resources