

Comparison of the Diagnostic Performance of C26:0-Lysophosphatidylcholine and Very Long-Chain Fatty Acids Analysis for Peroxisomal Disorders
- PMID: 32903870
- PMCID: PMC7438929
- DOI: 10.3389/fcell.2020.00690
Comparison of the Diagnostic Performance of C26:0-Lysophosphatidylcholine and Very Long-Chain Fatty Acids Analysis for Peroxisomal Disorders
Abstract
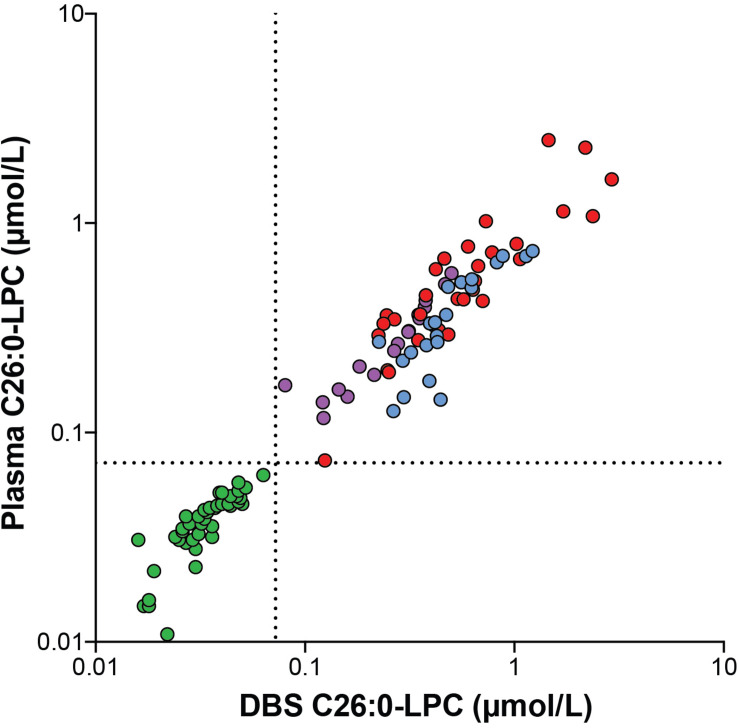
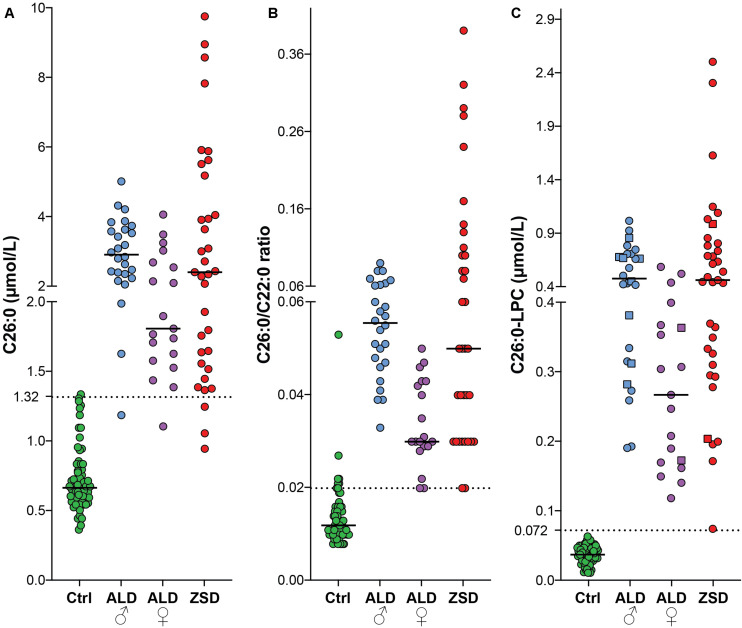
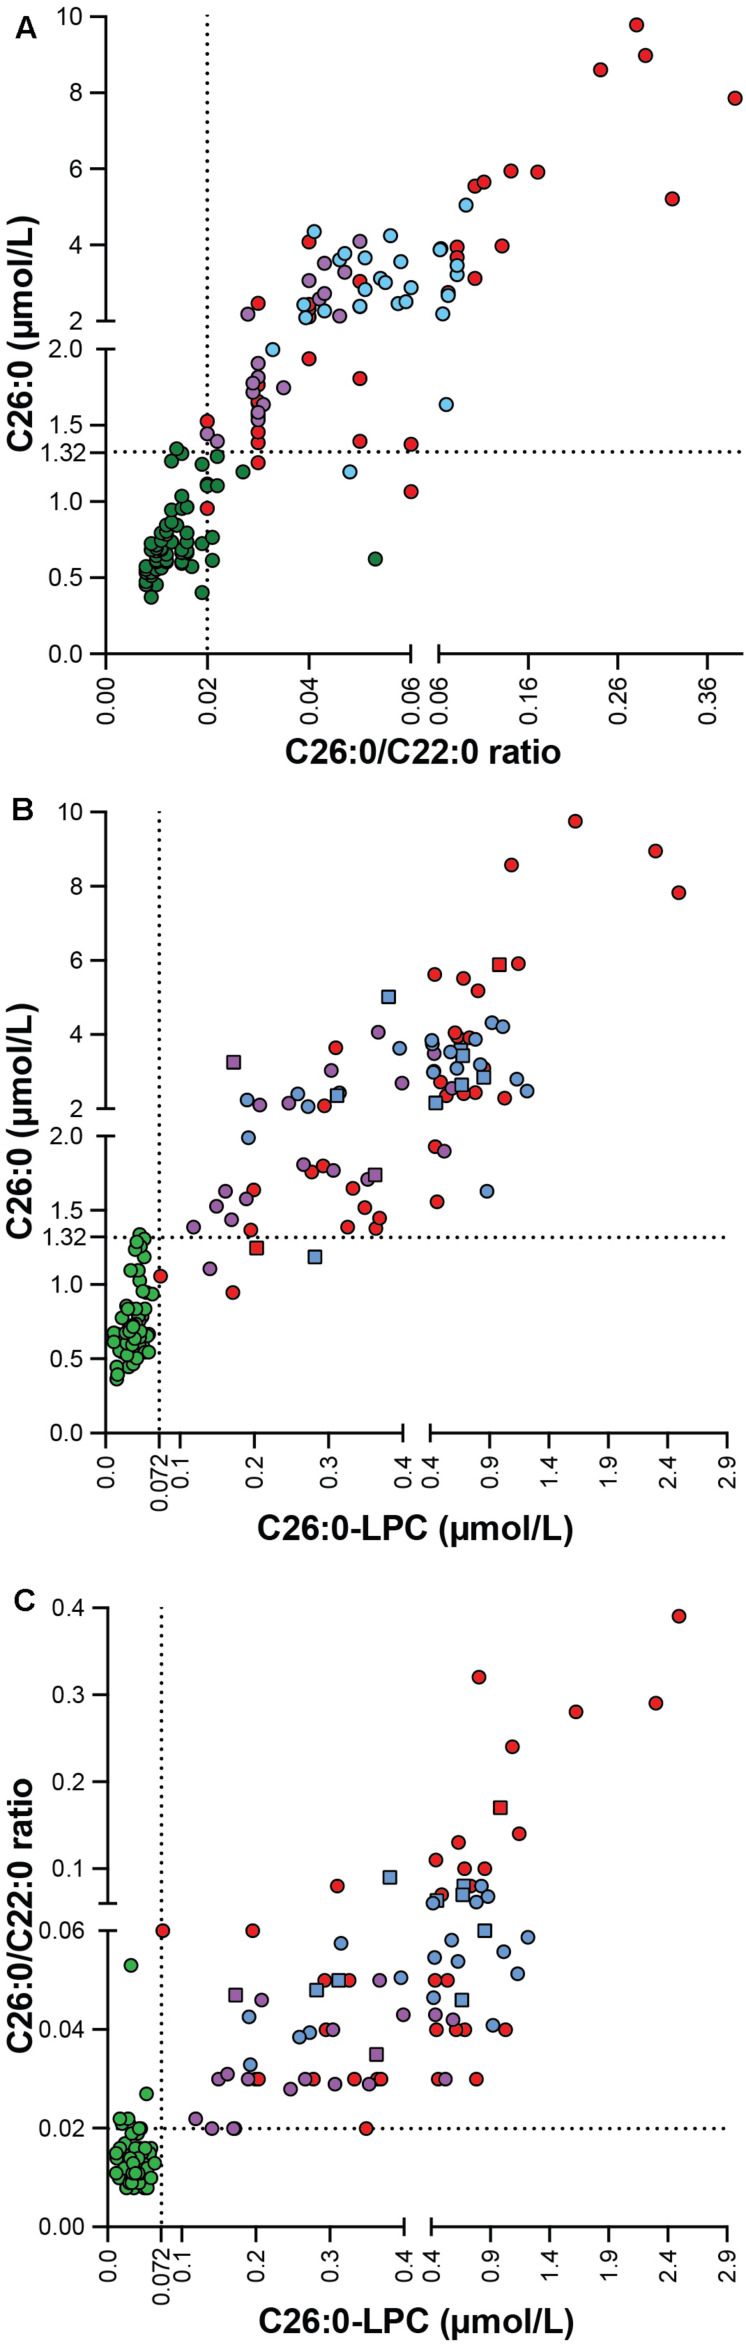
Peroxisomes are subcellular organelles that are involved in various important physiological processes such as the oxidation of fatty acids and the biosynthesis of bile acids and plasmalogens. The gold standard in the diagnostic work-up for patients with peroxisomal disorders is the analysis of very long-chain fatty acid (VLCFA) levels in plasma. Alternatively, C26:0-lysophosphatidylcholine (C26:0-LPC) can be measured in dried blood spots (DBS) using liquid chromatography tandem mass spectrometry (LC-MS/MS); a fast and easy method but not yet widely used. Currently, little is known about the correlation of C26:0-LPC in DBS and C26:0-LPC in plasma, and how C26:0-LPC analysis compares to VLCFA analysis in diagnostic performance. We investigated the correlation between C26:0-LPC levels measured in DBS and plasma prepared from the same blood sample. For this analysis we included 43 controls and 38 adrenoleukodystrophy (ALD) (21 males and 17 females) and 33 Zellweger spectrum disorder (ZSD) patients. In combined control and patient samples there was a strong positive correlation between DBS C26:0-LPC and plasma C26:0-LPC, with a Spearman's rank correlation coefficient of r (114) = 0.962, p < 0.001. These data show that both plasma and DBS are suitable to determine blood C26:0-LPC levels and that there is a strong correlation between C26:0-LPC levels in both matrices. Following this, we investigated how VLCFA and C26:0-LPC analysis compare in diagnostic performance for 67 controls, 26 ALD males, 19 ALD females, and 35 ZSD patients. For C26:0-LPC, all ALD and ZSD samples had C26:0-LPC levels above the upper limit of the reference range. For C26:0, one out of 67 controls had C26:0 levels above the upper reference range. For 1 out of 26 (1/26) ALD males, 1/19 ALD females and 3/35 ZSD patients, the C26:0 concentration was within the reference range. The C26:0/C22:0 ratio was within the reference range for 0/26 ALD males, 1/19 ALD females and 2/35 ZSD patients. Overall, these data demonstrate that C26:0-LPC analysis has a superior diagnostic performance compared to VLCFA analysis (C26:0 and C26:0/C22:0 ratio) in all patient groups. Based on our results we recommend implementation of C26:0-LPC analysis in DBS and/or plasma in the diagnostic work-up for peroxisomal disorders.
Keywords: C26:0-lysophosphatidylcholine; VLCFA; adrenoleukodystrophy; beta-oxidation; dried bloodspots; peroxisomes; very long-chain fatty acids.
Copyright © 2020 Jaspers, Ferdinandusse, Dijkstra, Barendsen, van Lenthe, Kulik, Engelen, Goorden, Vaz and Kemp.
Figures
Similar articles
-
Plasma C24:0- and C26:0-lysophosphatidylcholines are reliable biomarkers for the diagnosis of peroxisomal β-oxidation disorders.J Lipid Res. 2024 Mar;65(3):100516. doi: 10.1016/j.jlr.2024.100516. Epub 2024 Feb 4. J Lipid Res. 2024. PMID: 38320654 Free PMC article.
-
A pilot study of newborn screening for X-linked adrenoleukodystrophy based on liquid chromatography-tandem mass spectrometry method for detection of C26:0-lysophosphatidylcholine in dried blood spots: Results from 43,653 newborns in a southern Chinese population.Clin Chim Acta. 2024 Jan 1;552:117653. doi: 10.1016/j.cca.2023.117653. Epub 2023 Nov 15. Clin Chim Acta. 2024. PMID: 37977233
-
Improved analysis of C26:0-lysophosphatidylcholine in dried-blood spots via negative ion mode HPLC-ESI-MS/MS for X-linked adrenoleukodystrophy newborn screening.Clin Chim Acta. 2012 Aug 16;413(15-16):1217-21. doi: 10.1016/j.cca.2012.03.026. Epub 2012 Apr 4. Clin Chim Acta. 2012. PMID: 22503909
-
[X-linked adrenoleukodystrophy].Ann Endocrinol (Paris). 2007 Dec;68(6):403-11. doi: 10.1016/j.ando.2007.04.002. Epub 2007 May 29. Ann Endocrinol (Paris). 2007. PMID: 17532287 Review. French.
-
A new test method for biochemical analysis of plasmalogens in dried blood spots and erythrocytes from patients with peroxisomal disorders.J Inherit Metab Dis. 2023 Nov;46(6):1159-1169. doi: 10.1002/jimd.12682. Epub 2023 Oct 31. J Inherit Metab Dis. 2023. PMID: 37747296 Review.
Cited by
-
Practical Approach to Longitudinal Neurologic Care of Adults With X-Linked Adrenoleukodystrophy and Adrenomyeloneuropathy.Neurol Genet. 2024 Oct 3;10(5):e200192. doi: 10.1212/NXG.0000000000200192. eCollection 2024 Oct. Neurol Genet. 2024. PMID: 39372123 Free PMC article. Review.
-
Neurodegeneration in Autism: A Study of Clusterin, Very Long-Chain Fatty Acids, and Carnitine.J Mol Neurosci. 2025 Feb 11;75(1):18. doi: 10.1007/s12031-024-02303-6. J Mol Neurosci. 2025. PMID: 39932645
-
The Effect of a Pex3 Mutation on Hearing and Lipid Content of the Inner Ear.Cells. 2022 Oct 13;11(20):3206. doi: 10.3390/cells11203206. Cells. 2022. PMID: 36291074 Free PMC article.
-
International Recommendations for the Diagnosis and Management of Patients With Adrenoleukodystrophy: A Consensus-Based Approach.Neurology. 2022 Nov 22;99(21):940-951. doi: 10.1212/WNL.0000000000201374. Epub 2022 Sep 29. Neurology. 2022. PMID: 36175155 Free PMC article.
-
Diagnostic Odyssey in an Adult Patient with Ophthalmologic Abnormalities and Hearing Loss: Contribution of RNA-Seq to the Diagnosis of a PEX1 Deficiency.Int J Mol Sci. 2022 Oct 15;23(20):12367. doi: 10.3390/ijms232012367. Int J Mol Sci. 2022. PMID: 36293220 Free PMC article.
References
-
- Brown F. R., Duyn M. A. S., van Moser A. B., Schulman J. D., Rizzo W. B., Snyder R. D., et al. (1982). Adrenoleukodystrophy: effects of dietary restriction of very long chain fatty acids and of administration of carnitine and clofibrate on clinical status and plasma fatty acids. Johns Hopkins Med. J. 151 164–172. - PubMed
-
- Engelen M., Ofman R., Dijkgraaf M. G. W., Hijzen M., Wardt L. A., Van Der Geel B. M., et al. (2010). Lovastatin in X-linked adrenoleukodystrophy. N. Engl. J. Med. 362 276–277. - PubMed
LinkOut - more resources
Full Text Sources
Other Literature Sources