Observational Study
. 2020 Aug 25;1(5):100077.
doi: 10.1016/j.xcrm.2020.100077.

Microbiota Supplementation with Bifidobacterium and Lactobacillus Modifies the Preterm Infant Gut Microbiota and Metabolome: An Observational Study

Affiliations
Observational Study

Microbiota Supplementation with Bifidobacterium and Lactobacillus Modifies the Preterm Infant Gut Microbiota and Metabolome: An Observational Study

Cristina Alcon-Giner et al. Cell Rep Med. .

Abstract

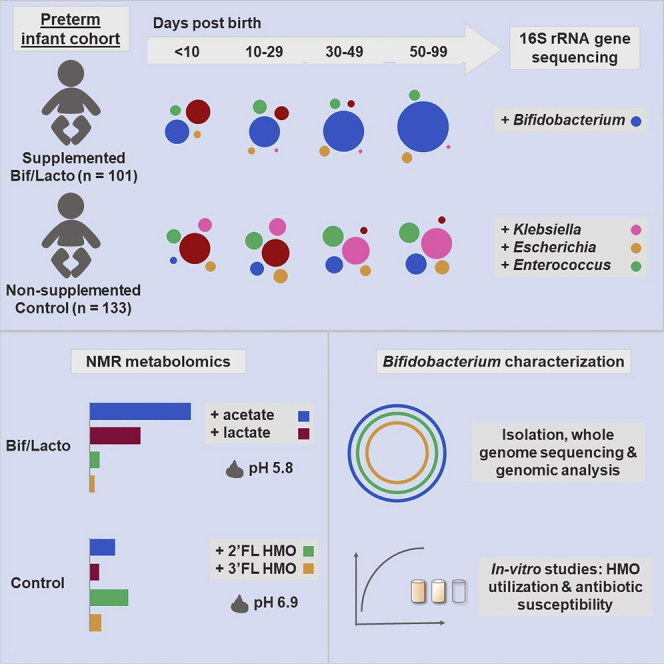
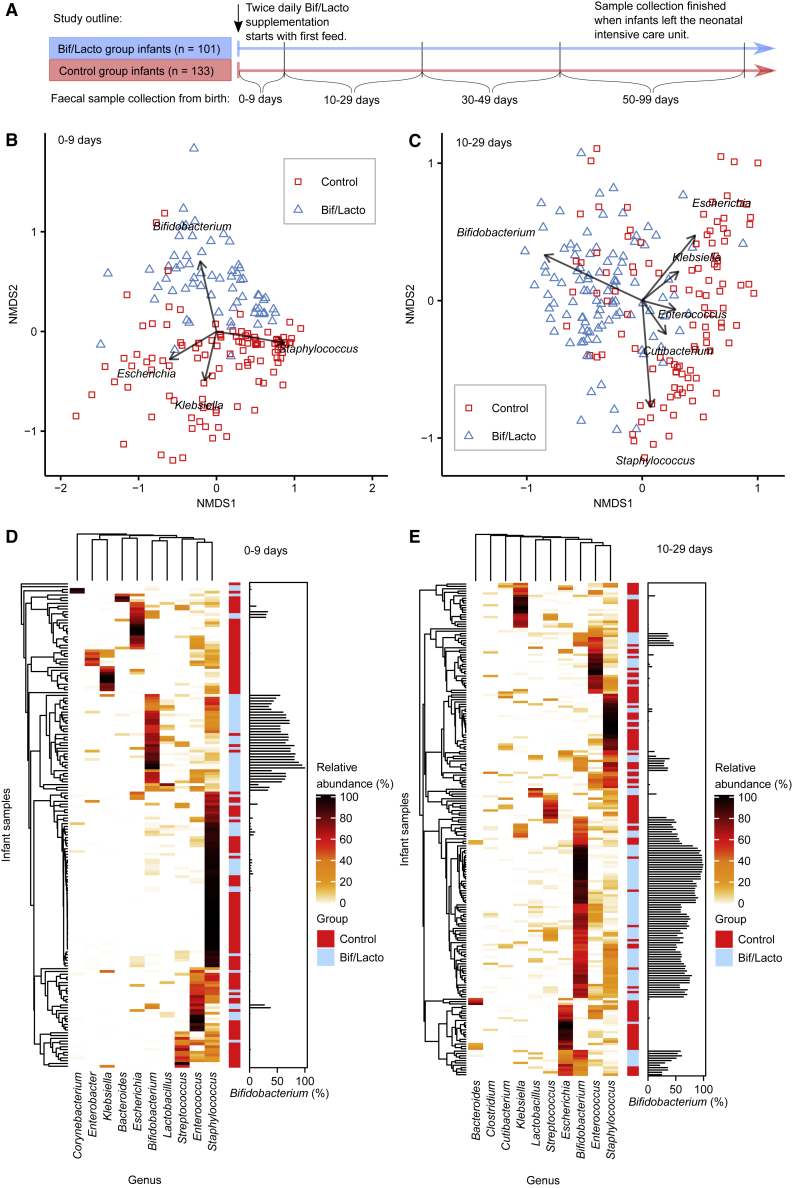
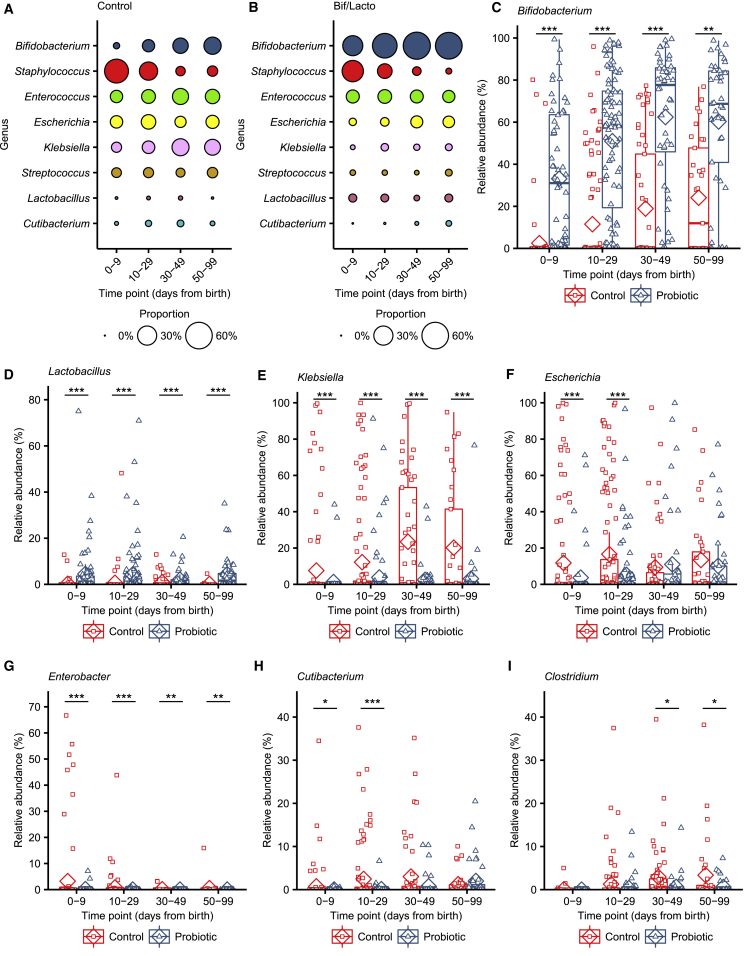
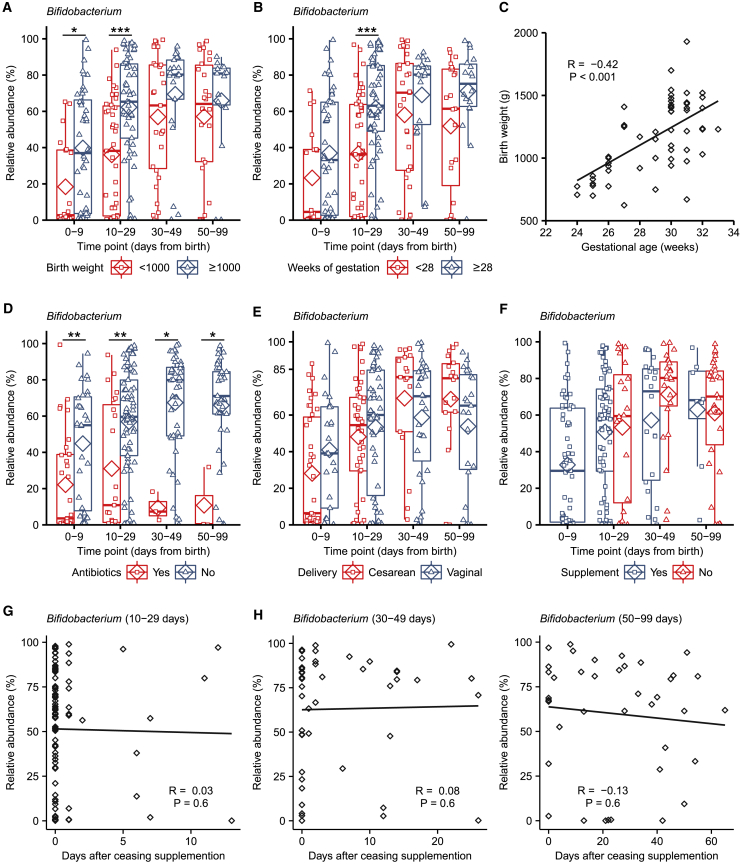
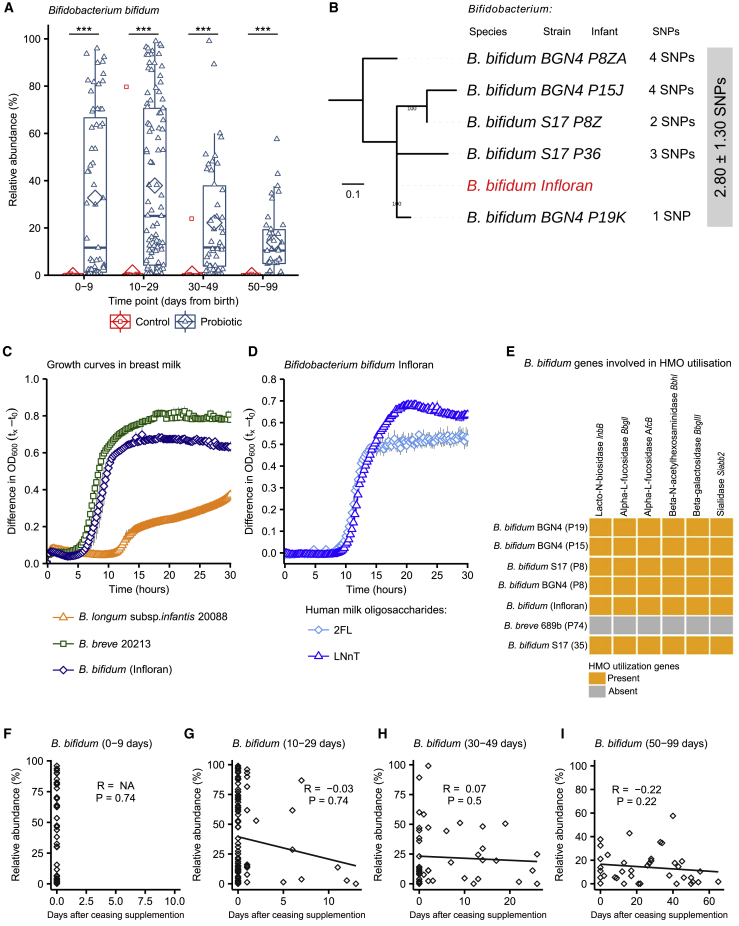
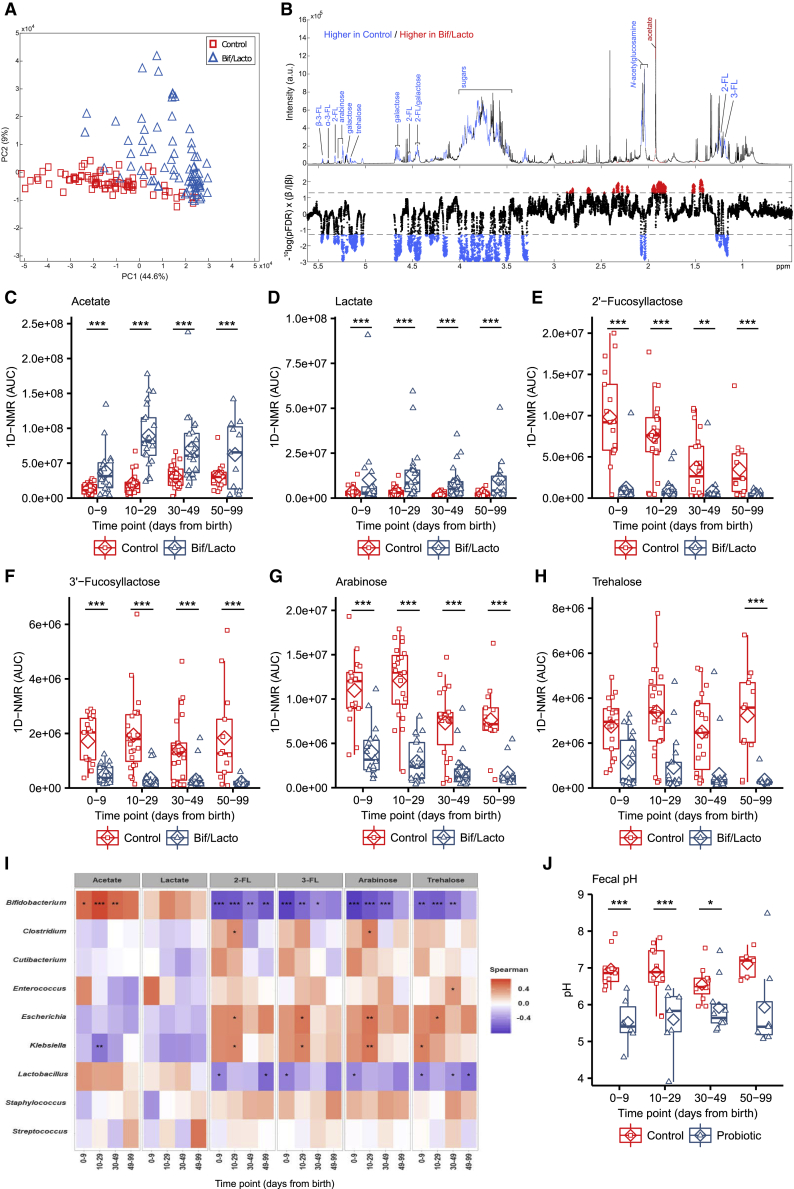
Supplementation with members of the early-life microbiota as "probiotics" is increasingly used in attempts to beneficially manipulate the preterm infant gut microbiota. We performed a large observational longitudinal study comprising two preterm groups: 101 infants orally supplemented with Bifidobacterium and Lactobacillus (Bif/Lacto) and 133 infants non-supplemented (control) matched by age, sex, and delivery method. 16S rRNA gene profiling on fecal samples (n = 592) showed a predominance of Bifidobacterium and a lower abundance of pathobionts in the Bif/Lacto group. Metabolomic analysis showed higher fecal acetate and lactate and a lower fecal pH in the Bif/Lacto group compared to the control group. Fecal acetate positively correlated with relative abundance of Bifidobacterium, consistent with the ability of the supplemented Bifidobacterium strain to metabolize human milk oligosaccharides into acetate. This study demonstrates that microbiota supplementation is associated with a Bifidobacterium-dominated preterm microbiota and gastrointestinal environment more closely resembling that of full-term infants.

Keywords: Bifidobacterium; Lactobacillus; human milk oligosaccharides; metabolites; microbiota; pH; pathobionts; preterm infant; probiotic; supplementation.


Conflict of interest statement

The authors declare no competing interests.

Figures

None
Graphical abstract
Figure 1
Figure 1
Premature Infant Gut Microbiota Clustering and Genus Composition NMDS (non-metric multidimensional scaling) analysis clustered with a Bray-Curtis dissimilarity. Arrows and genus labels on the NMDS plots indicate bacterial genera driving the separation of points on the NMDS plots. Heatmaps showing the ten genera with highest proportional abundance. Heatmap rows were clustered by total microbiota similarity using Bray-Curtis dissimilarity and the columns clustered by genera that occur more often together. Side bar plots show the proportional abundance of Bifidobacterium in each sample. (A) Study outline and sample collections times. Infloran supplementation was given until 34 weeks old, except for very low-birth-weight infants (<1,500 g) who received it until discharge. The control group was not given supplementation. (B) NMDS plot of infant fecal microbiota at 0–9 days (control: n = 110, Bif/Lacto: n = 64). (C) NMDS plot of infant fecal microbiota at 10–29 days (control: n = 109, Bif/Lacto: n = 100). (D) Heatmap showing infant fecal microbiota at 0–9 days (control: n = 110, Bif/Lacto: n = 64). (E) Heatmap showing infant fecal microbiota at 10–29 days (control: n = 109, Bif/Lacto: n = 100). See also Figure S1, Data S1–S3, and Tables S1 and S3.
Figure 2
Figure 2
Genus Abundance between Bif/Lacto and Control Groups (A) Bubble plots show the mean group abundance of the common bacterial genera at each time point in the control group and the Bif/Lacto group. (C) Relative abundance of Bifidobacterium. (D) Relative abundance of Lactobacillus. (E) Relative abundance of Klebsiella, (F) Relative abundance of Escherichia. (G) Relative abundance of Enterobacter (H) Relative abundance of Cutibacterium (I) Relative abundance of Clostridium. For all plots: 0–9 days (control: n = 110, Bif/Lacto: n = 64); 10–29 days (control: n = 109, Bif/Lacto: n = 100); 30–49 days (control: n = 57, Bif/Lacto: n = 48); 50–99 days (control: n = 33, Bif/Lacto: n = 41). Boxplots show group median and interquartile range, diamonds indicate the group mean, and individual points highlight individual infant samples. Asterisks represent p values: ∗p < 0.05, ∗∗p < 0.01 ∗∗∗p < 0.001. See also Figure S2 and Data S4–S6.
Figure 3
Figure 3
Effects of Birth Weight, Antibiotic Use, Delivery Mode, and Bifidobacterium Colonization in Bif/Lacto Group Infants (A) Bifidobacterium abundance between very low birth weight (<1,000 g) and low birth weight (>1,000 g) in Bif/Lacto infants (N = 0–9: <1,000 = 20, ≥1,000 = 44; 10–29: <1,000 = 43, ≥1,000 = 57; 30–49: <1,000 = 27, ≥1,000 = 21; 50–99: <1,000 = 26, ≥1,000 = 15). (B) Bifidobacterium abundance between very low gestational age (<28 weeks) and low gestational age (≥28 weeks) Bif/Lacto infants (N = 0–9: <1,000 = 18, ≥1,000 = 46; 10–29: <1,000 = 43, ≥1,000 = 57; 30–49: <1,000 = 29, ≥1,000 = 19; 50–99: <1,000 = 23, ≥1,000 = 18). (C) Infant birth weight in grams correlated with gestational age in weeks (n = 100). (D) Bifidobacterium abundance in Bif/Lacto infants receiving antibiotics at the time of sample collection (N = 0–9: Yes = 33, No = 31; 10–29: Yes = 23, No = 77; 30–49: Yes = 3, No = 44; 50–99: Yes = 3, No = 37). (E) Bifidobacterium abundance in Bif/Lacto infants delivered by caesarean or vaginal birth (N = 0–9: C = 39, V = 25; 10–29: C = 46, V = 54; 30–49: C = 17, V = 31; 50–99: C = 18, V = 23). (F) Bifidobacterium abundance in Bif/Lacto infants still receiving or no longer receiving supplementation (N = 0–9: Yes = 63; 10–29: Yes = 77, No = 20; 30–49: Yes = 22, No = 23; 50–99: Yes = 8, No = 30). (G) Bifidobacterium abundance in Bif/Lacto infants by days after ceasing supplementation at 10–29 days of age (n = 97). (H) Bifidobacterium abundance in Bif/Lacto infants by days after ceasing supplementation at 30–49 days of age (n = 45). (I) Bifidobacterium abundance in Bif/Lacto infants by days after ceasing supplementation at 50–99 days of age (n = 38). Boxplots show group median and interquartile range, diamonds indicate the group mean, and individual points highlight individual infant samples. Asterisks represent p values: ∗p < 0.05, ∗∗p < 0.01 ∗∗∗p < 0.001. See also Figure S3 and Data S7.
Figure 4
Figure 4
Comparison of B. bifidum Genomes and Phenotypic Characterization of B. bifidum Infloran Strain (A) B. bifidum abundance in Bif/Lacto and control group infants (0–9 days (control: n = 62, Bif/Lacto: n = 63); 10–29 days (control: n = 70, Bif/Lacto: n = 97); 30–49 days (control: n = 38, Bif/Lacto: n = 46); 50–99 days (control: n = 22, Bif/Lacto: n = 39)). (B) Mid-point rooted maximum-likelihood tree based on 12 SNPs called via reference-based approach (strain Infloran as the reference genome) from 5 B. bifidum genomes. The gray box denotes pairwise SNP distance between these 6 genomes. Data: mean ± SD. (C) Growth curves of B. bifidum Infloran, B. breve 20213, and B. longum subsp. infantis 20088, in whole human milk. (D) Growth curves B. bifidum Infloran in human milk oligosaccharides (HMO) Lacto-N-tetraose and 2-fucosyllactose. (E) Heatmap representing B. bifidum genes involved in utilization of human milk oligosaccharides. (F–I) Correlation between B. bifidum abundance and days after ceasing receiving supplementation (0–9 days: n = 63; 10–29 days: n = 97; 30–49 days: n = 46; 50–99 days: n = 39). Boxplots show group median and interquartile range, diamonds indicate the group mean, and individual points highlight individual infant samples. Asterisks represent p values: ∗∗∗p < 0.001. See also Figures S4 and S5 and Tables S2 and S5.
Figure 5
Figure 5
Metabolomic Profiling of Fecal Samples from the Bif/Lacto and Control Groups via 1H NMR Spectroscopy (A) Principal-component analysis (PCA) scores plot comparing the fecal metabolic profiles of the Bif/Lacto and control groups at all time points. (B) Discriminatory metabolites that contribute to the covariate-adjusted projection to latent structures-discriminant analysis (CA-PLS-DA) model comparing the fecal metabolic profiles of the Bif/Lacto and control infants adjusted for sampling age. Top panel: average 1H NMR spectrum from all samples indicating metabolites that are excreted in greater amounts by the Bif/Lacto infants (red) and those excreted in greater amounts by the control infants (blue). Bottom panel: Manhattan plot showing p values calculated for each variable in the multivariate model, corrected for multiple testing using the false discovery rate (allowing 5% false discoveries). Horizontal lines indicate cutoff values for the false discovery rate on the log10 scale. Blue points indicate metabolites significantly higher in the control feces and red points indicate those metabolites significantly higher in the Bif/Lacto feces. (C) Relative acetate concentration. (D) Relative lactate concentration. (E) Relative 2′-fucosyllactose (2-FL) concentration. (F) Relative 3′-fucosyllactose (3-FL) concentration. (G) Relative arabinose concentration. (H) Relative trehalose concentration. (I) Spearman correlation heatmap displaying main fecal metabolites (rows) versus the most abundant bacterial groups (columns). Red denotes positive correlation and blue denotes for negative correlation. For metabolite data (N = 0–9 days (control: n = 17, Bif/Lacto: n = 18); 10–29 days (control: n = 23, Bif/Lacto: n = 21); 30–49 days (control: n = 22, Bif/Lacto: n = 23); 50–99 days (control: n = 13, Bif/Lacto: n = 11)). (J) Group fecal sample pH (N = 0–9 days (control: n = 9, Bif/Lacto: n = 6); 10–29 days (control: n = 10, Bif/Lacto: n = 7); 30–49 days (control: n = 11, Bif/Lacto: n = 10); 50–99 days (control: n = 5, Bif/Lacto: n = 7)). Boxplots show group median and interquartile range, diamonds indicate the group mean, and individual points highlight individual infant samples. Asterisks represent p values: ∗p < 0.05, ∗∗p < 0.01, ∗∗∗p < 0.001. See also Figures S6 and S7 and Table S8.

References

    1. World Health Organization . 2019. Preterm birth.https://www.who.int/news-room/fact-sheets/detail/preterm-birth Accessed September 25, 2019.
    1. Gasparrini A.J., Wang B., Sun X., Kennedy E.A., Hernandez-Leyva A., Ndao I.M., Tarr P.I., Warner B.B., Dantas G. Persistent metagenomic signatures of early-life hospitalization and antibiotic treatment in the infant gut microbiota and resistome. Nat. Microbiol. 2019;4:2285–2297. - PMC - PubMed
    1. Mulder I.E., Schmidt B., Lewis M., Delday M., Stokes C.R., Bailey M., Aminov R.I., Gill B.P., Pluske J.R., Mayer C.D., Kelly D. Restricting microbial exposure in early life negates the immune benefits associated with gut colonization in environments of high microbial diversity. PLoS ONE. 2011;6:e28279. - PMC - PubMed
    1. Walker W.A. The importance of appropriate initial bacterial colonization of the intestine in newborn, child, and adult health. Pediatr. Res. 2017;82:387–395. - PMC - PubMed
    1. Shulhan J., Dicken B., Hartling L., Larsen B.M. Current Knowledge of Necrotizing Enterocolitis in Preterm Infants and the Impact of Different Types of Enteral Nutrition Products. Adv. Nutr. 2017;8:80–91. - PMC - PubMed

Publication types

MeSH terms

Substances

LinkOut - more resources