

The effect of oral and nasal breathing on the deposition of inhaled particles in upper and tracheobronchial airways
- PMID: 32904428
- PMCID: PMC7455204
- DOI: 10.1016/j.jaerosci.2020.105649
The effect of oral and nasal breathing on the deposition of inhaled particles in upper and tracheobronchial airways
Abstract
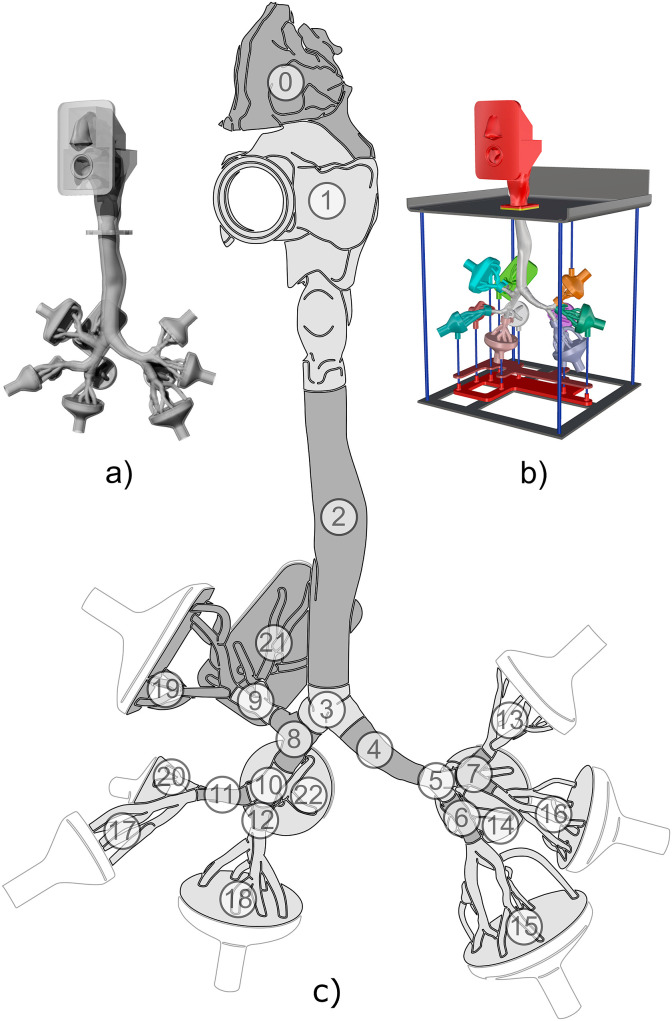
The inhalation route has a substantial influence on the fate of inhaled particles. An outbreak of infectious diseases such as COVID-19, influenza or tuberculosis depends on the site of deposition of the inhaled pathogens. But the knowledge of respiratory deposition is important also for occupational safety or targeted delivery of inhaled pharmaceuticals. Simulations utilizing computational fluid dynamics are becoming available to a wide spectrum of users and they can undoubtedly bring detailed predictions of regional deposition of particles. However, if those simulations are to be trusted, they must be validated by experimental data. This article presents simulations and experiments performed on a geometry of airways which is available to other users and thus those results can be used for intercomparison between different research groups. In particular, three hypotheses were tested. First: Oral breathing and combined breathing are equivalent in terms of particle deposition in TB airways, as the pressure resistance of the nasal cavity is so high that the inhaled aerosol flows mostly through the oral cavity in both cases. Second: The influence of the inhalation route (nasal, oral or combined) on the regional distribution of the deposited particles downstream of the trachea is negligible. Third: Simulations can accurately and credibly predict deposition hotspots. The maximum spatial resolution of predicted deposition achievable by current methods was searched for. The simulations were performed using large-eddy simulation, the flow measurements were done by laser Doppler anemometry and the deposition has been measured by positron emission tomography in a realistic replica of human airways. Limitations and sources of uncertainties of the experimental methods were identified. The results confirmed that the high-pressure resistance of the nasal cavity leads to practically identical velocity profiles, even above the glottis for the mouth, and combined mouth and nose breathing. The distribution of deposited particles downstream of the trachea was not influenced by the inhalation route. The carina of the first bifurcation was not among the main deposition hotspots regardless of the inhalation route or flow rate. On the other hand, the deposition hotspots were identified by both CFD and experiments in the second bifurcation in both lungs, and to a lesser extent also in both the third bifurcations in the left lung.
Keywords: Airways; Computational fluid mechanics; Deposition hotspots; Flow; Laser Doppler anemometry; Lungs; Numerical simulations; Particle deposition; Positron emission tomography.
© 2020 Elsevier Ltd. All rights reserved.
Conflict of interest statement
The authors declare that they have no known competing financial interests or personal relationships that could have appeared to influence the work reported in this paper.
Figures


Similar articles
-
Substance deposition assessment in obstructed pulmonary system through numerical characterization of airflow and inhaled particles attributes.BMC Med Inform Decis Mak. 2017 Dec 20;17(Suppl 3):173. doi: 10.1186/s12911-017-0561-y. BMC Med Inform Decis Mak. 2017. PMID: 29297393 Free PMC article.
-
Numerical investigation of transient transport and deposition of microparticles under unsteady inspiratory flow in human upper airways.Respir Physiol Neurobiol. 2017 Oct;244:56-72. doi: 10.1016/j.resp.2017.06.005. Epub 2017 Jul 1. Respir Physiol Neurobiol. 2017. PMID: 28673875
-
Dry powder inhaler aerosol deposition in a model of tracheobronchial airways: Validating CFD predictions with in vitro data.Int J Pharm. 2020 Sep 25;587:119599. doi: 10.1016/j.ijpharm.2020.119599. Epub 2020 Jul 11. Int J Pharm. 2020. PMID: 32663586
-
Experimental methods for flow and aerosol measurements in human airways and their replicas.Eur J Pharm Sci. 2018 Feb 15;113:95-131. doi: 10.1016/j.ejps.2017.08.021. Epub 2017 Aug 23. Eur J Pharm Sci. 2018. PMID: 28842353 Review.
-
Pediatric in vitro and in silico models of deposition via oral and nasal inhalation.J Aerosol Med Pulm Drug Deliv. 2014 Jun;27(3):149-69. doi: 10.1089/jamp.2013.1075. J Aerosol Med Pulm Drug Deliv. 2014. PMID: 24870701 Review.
Cited by
-
Nanoparticle-Based Inhalation Therapy for Pulmonary Diseases.Curr Drug Metab. 2022;23(11):882-896. doi: 10.2174/1389200223666220803103039. Curr Drug Metab. 2022. PMID: 35927812
-
The virtual physiological human gets nerves! How to account for the action of the nervous system in multiphysics simulations of human organs.J R Soc Interface. 2021 Apr;18(177):20201024. doi: 10.1098/rsif.2020.1024. Epub 2021 Apr 14. J R Soc Interface. 2021. PMID: 33849336 Free PMC article.
-
A novel in-situ method to determine the respiratory tract deposition of carbonaceous particles reveals dangers of public commuting in highly polluted megacity.Part Fibre Toxicol. 2022 Sep 15;19(1):61. doi: 10.1186/s12989-022-00501-x. Part Fibre Toxicol. 2022. PMID: 36109745 Free PMC article.
-
A Holistic Approach for Ethics and Sustainability in the Food Chain: The Gateway to Oral and Systemic Health.Foods. 2024 Apr 17;13(8):1224. doi: 10.3390/foods13081224. Foods. 2024. PMID: 38672896 Free PMC article. Review.
-
Ventilatory Responses to Progressive Treadmill Speeds in Women: A Comparative Analysis of Nasal, Oral, and Oronasal Breathing Conditions.Int J Environ Res Public Health. 2025 May 1;22(5):718. doi: 10.3390/ijerph22050718. Int J Environ Res Public Health. 2025. PMID: 40427834 Free PMC article.
References
-
- Elcner J., Lizal F., Jedelsky J., Jicha M., Chovancova M. Numerical investigation of inspiratory airflow in a realistic model of the human tracheobronchial airways and a comparison with experimental results. Biomechanics and Modeling in Mechanobiology. 2016;15(2):447–469. doi: 10.1007/s10237-015-0701-1. - DOI - PubMed
LinkOut - more resources
Full Text Sources
Miscellaneous