. 2020;66(5):1081-1092.
doi: 10.1007/s00466-020-01899-x. Epub 2020 Aug 29.

Is it safe to lift COVID-19 travel bans? The Newfoundland story

Affiliations

Is it safe to lift COVID-19 travel bans? The Newfoundland story

Kevin Linka et al. Comput Mech. 2020.

Abstract

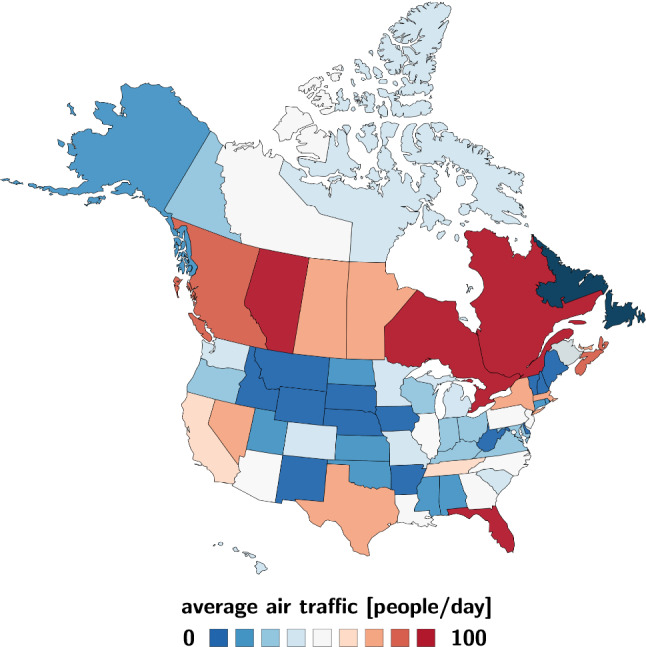
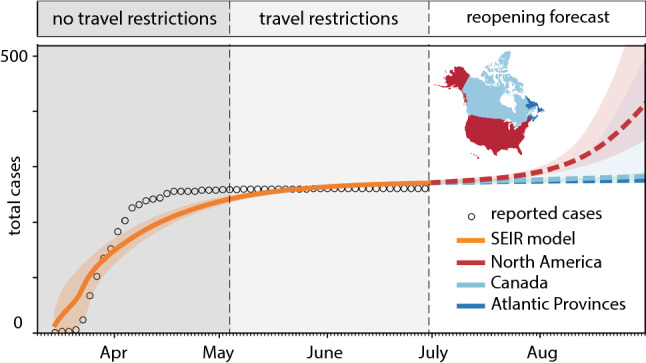
A key strategy to prevent a local outbreak during the COVID-19 pandemic is to restrict incoming travel. Once a region has successfully contained the disease, it becomes critical to decide when and how to reopen the borders. Here we explore the impact of border reopening for the example of Newfoundland and Labrador, a Canadian province that has enjoyed no new cases since late April, 2020. We combine a network epidemiology model with machine learning to infer parameters and predict the COVID-19 dynamics upon partial and total airport reopening, with perfect and imperfect quarantine conditions. Our study suggests that upon full reopening, every other day, a new COVID-19 case would enter the province. Under the current conditions, banning air travel from outside Canada is more efficient in managing the pandemic than fully reopening and quarantining 95% of the incoming population. Our study provides quantitative insights of the efficacy of travel restrictions and can inform political decision making in the controversy of reopening.

Keywords: COVID-19; Epidemiology; Machine learning; Reproduction number; SEIR model.


Conflict of interest statement

Conflict of interestThe authors declare that they have no conflict of interest.

Figures

Fig. 1
Fig. 1
Mobility modeling. Discrete graphs GAP of the Atlantic Provinces (green), GCA of Canada (green and red), and GNA of North America (green, red, and blue) with n=4, n=13, and n=64 nodes and e=n-1 edges that represent the main travel routes to Newfoundland and Labrador. Dark blue edges represent the connections from the Atlantic Provinces, light blue edges from the other Canadian provinces and territories, and red edges from the United States. (Color figure online)
Fig. 2
Fig. 2
Average daily air traffic to and from Newfoundland and Labrador. Number of daily incoming and outgoing air passengers from the Canadian Provinces and Territories and the United States for a 15-month period before the COVID-19 outbreak, from January 1, 2019 to March 31, 2020, as reported by the International Air Transport Association [15]
Fig. 3
Fig. 3
Outbreak dynamics of COVID-19 in the Atlantic Provinces, all other Canadian provinces, and the United States. Effective reproduction number (red), confirmed cases (dots) [2, 34], and model fit (orange) from the beginning of the outbreak until July 1, 2020. Solid lines represent the median values, shaded areas highlight the 95% confidence intervals. (Color figure online)
Fig. 4
Fig. 4
Estimated COVID-19 exposed travelers to Newfoundland and Labrador. Number of daily incoming air passengers from Canada and the United States that have been exposed to COVID-19. The estimate assumes average daily travel from Fig. 2 and the outbreak dynamics from Fig. 3 as of July 1, 2020
Fig. 5
Fig. 5
Estimated COVID-19 infectious travelers to Newfoundland and Labrador. Number of daily incoming air passengers from the Canadian provinces and territories and the United States that are infectious with COVID-19 assuming average daily travel from Fig. 2 and the outbreak dynamics from Fig. 3 as of July 1, 2020
Fig. 6
Fig. 6
Outbreak dynamics of COVID-19 in Newfoundland and Labrador and the effect of quarantine. Daily new cases and total cases with model fit for periods without travel restrictions and with travel restrictions. Reopening forecast for 60-day period with all incoming travelers quarantining to 100% (dark blue), 50% (light blue), and 0% (red). Solid and dashed lines represent the median values, shaded areas highlight the 95% confidence intervals. (Color figure online)
Fig. 7
Fig. 7
Outbreak dynamics of COVID-19 in Newfoundland and Labrador and the effect of restricted travel. Total cases with model fit for periods without travel restrictions and with travel restrictions. Reopening forecast for 60-day period with mobility only within the Atlantic Provinces (dark blue), all of Canadian (light blue), and all of North America (red). Solid and dashed lines represent the median values, shaded areas highlight the 95% confidence intervals. (Color figure online)
Fig. 8
Fig. 8
Effect of quarantine on COVID-19 in Newfoundland and Labrador. Reopening forecast for 150-day period with incoming travelers quarantining from 95 (blue) to 0% (red). Predictions are based on a local SEIR model with incoming air traffic from all of North America using the mean effective reproduction number of Rt=1.35 for all of North America (solid lines) and Rt=1.16 for Canada (dashed lines). The black horizontal line marks 0.1% of the population of Newfoundland and Labrador. (Color figure online)
Fig. 9
Fig. 9
Effect of restricted travel on COVID-19 in Newfoundland and Labrador. Reopening forecast for 150-day period with incoming travelers from Atlantic Provinces, Canada, and all of North America with no quarantine requirements. Predictions are based on a local SEIR model with incoming air traffic from all of North America using the mean effective reproduction numbers of Rt=1.35 for all of North America (solid lines) and Rt=1.16 for Canada (dashed lines). The black horizontal line marks 0.1% of the population of Newfoundland and Labrador

Update of

References

    1. Alber M, Buganza Tepole A, Cannon W, De S, Dura-Bernal S, Garikipati K, Karniadakis G, Lytton WW, Perdikaris P, Petzold L, Kuhl E. Integrating machine learning and multiscale modeling: perspectives, challenges, and opportunities in the biological, biomedical, and behavioral sciences. NPJ Dig Med. 2019;2:115. doi: 10.1038/s41746-019-0193-y. - DOI - PMC - PubMed
    1. Berry I, Soucy JPR, Tuite A, Fisman D. Open access epidemiologic data and an interactive dashboard to monitor the COVID-19 outbreak in Canada. Can Med Assoc J. 2020;192:E420. doi: 10.1503/cmaj.75262. - DOI - PMC - PubMed
    1. Canadian Cancer Statistics Advisory Committee (2019) Canadian cancer statistics 2019. Canadian Cancer Society, Toronto. https://www.cancer.ca/Canadian-Cancer-Statistics-2019-EN. Accessed July 9, 2020
    1. Chinazzi M, Davis JT, Ajelli M, Gioanni C, Vespignani A. The effect of travel restrictions on the spread of the 2019 novel coronavirus (COVID-19) outbreak. Science. 2020 doi: 10.1126/science.aba9757. - DOI - PMC - PubMed
    1. Cobey S. Modeling infectious disease dynamics. Science. 2020 doi: 10.1126/science.aba5659. - DOI - PubMed

LinkOut - more resources