. 2020 Sep 22;1(6):100092.
doi: 10.1016/j.xcrm.2020.100092. Epub 2020 Aug 29.

Robust T Cell Response Toward Spike, Membrane, and Nucleocapsid SARS-CoV-2 Proteins Is Not Associated with Recovery in Critical COVID-19 Patients

Affiliations

Robust T Cell Response Toward Spike, Membrane, and Nucleocapsid SARS-CoV-2 Proteins Is Not Associated with Recovery in Critical COVID-19 Patients

Constantin J Thieme et al. Cell Rep Med. .

Abstract

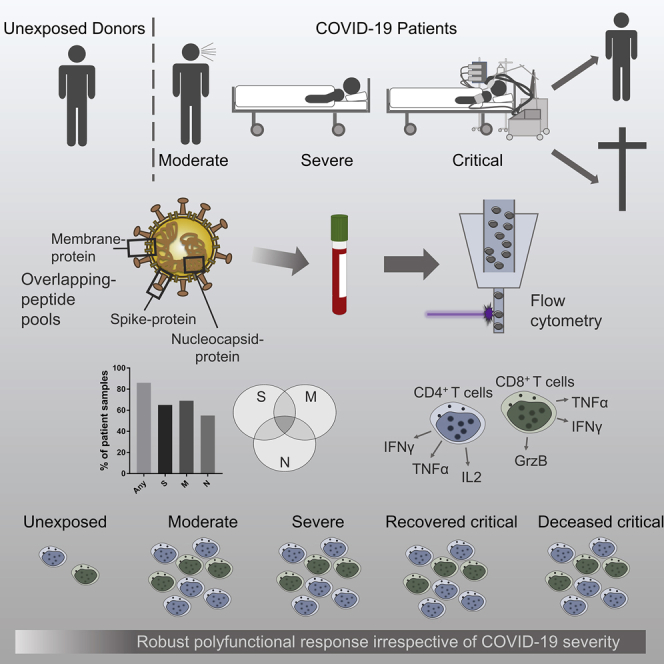
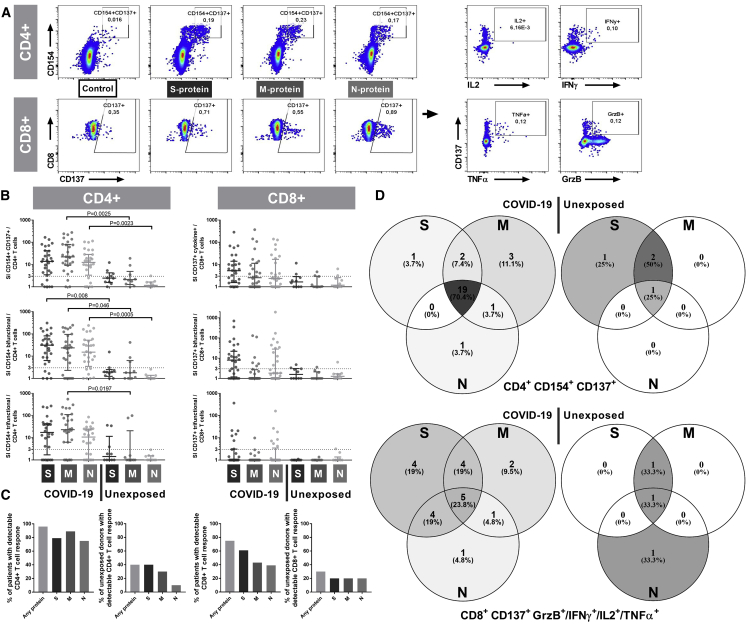
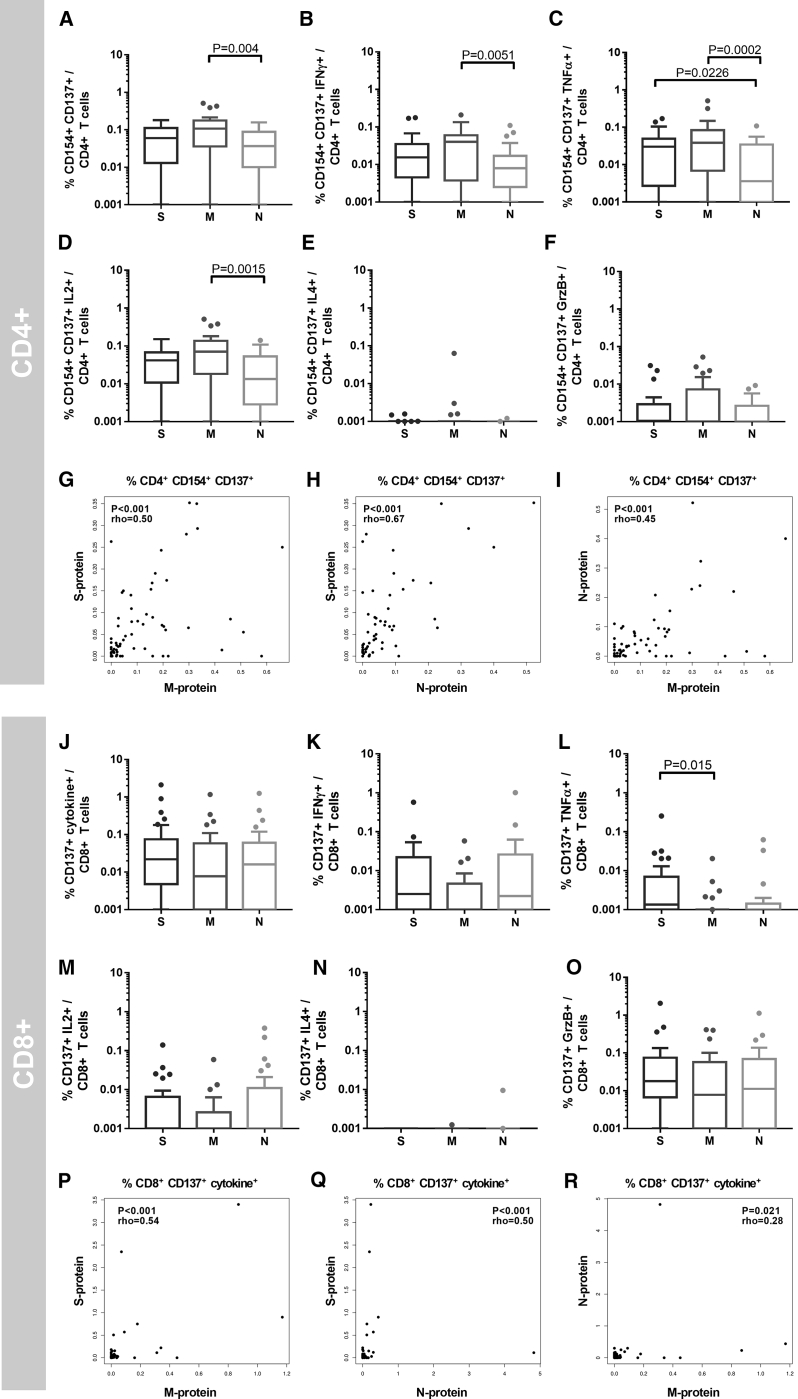
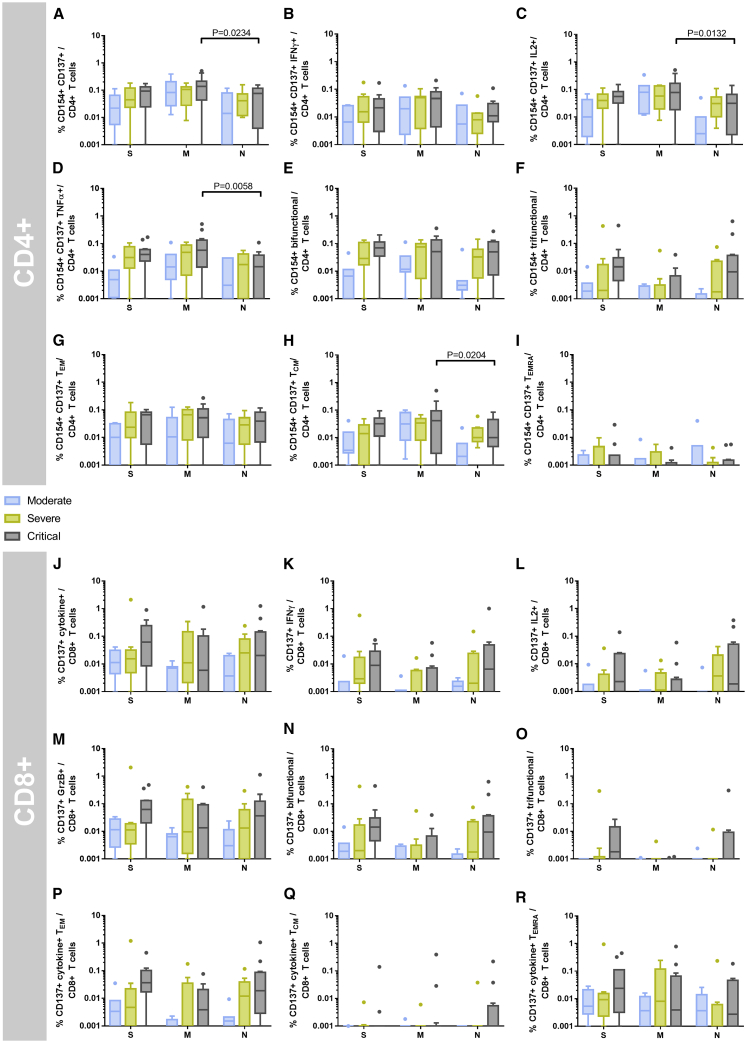
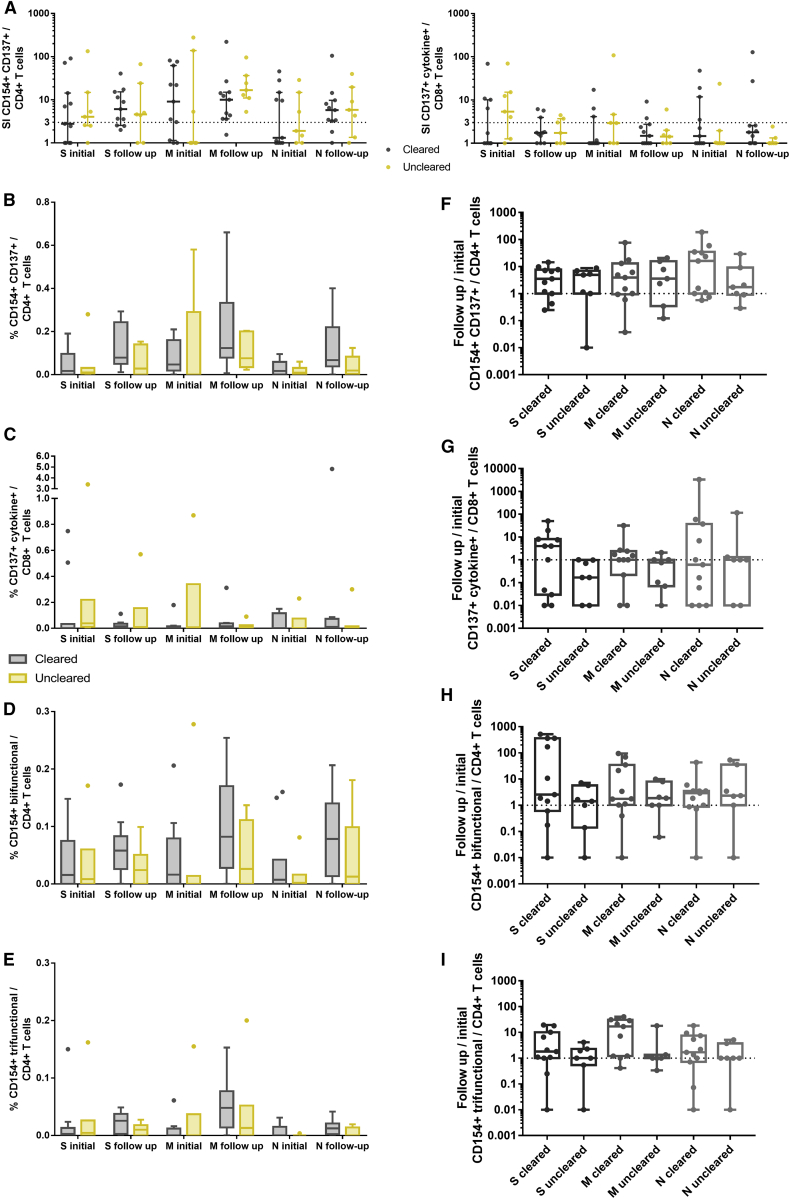
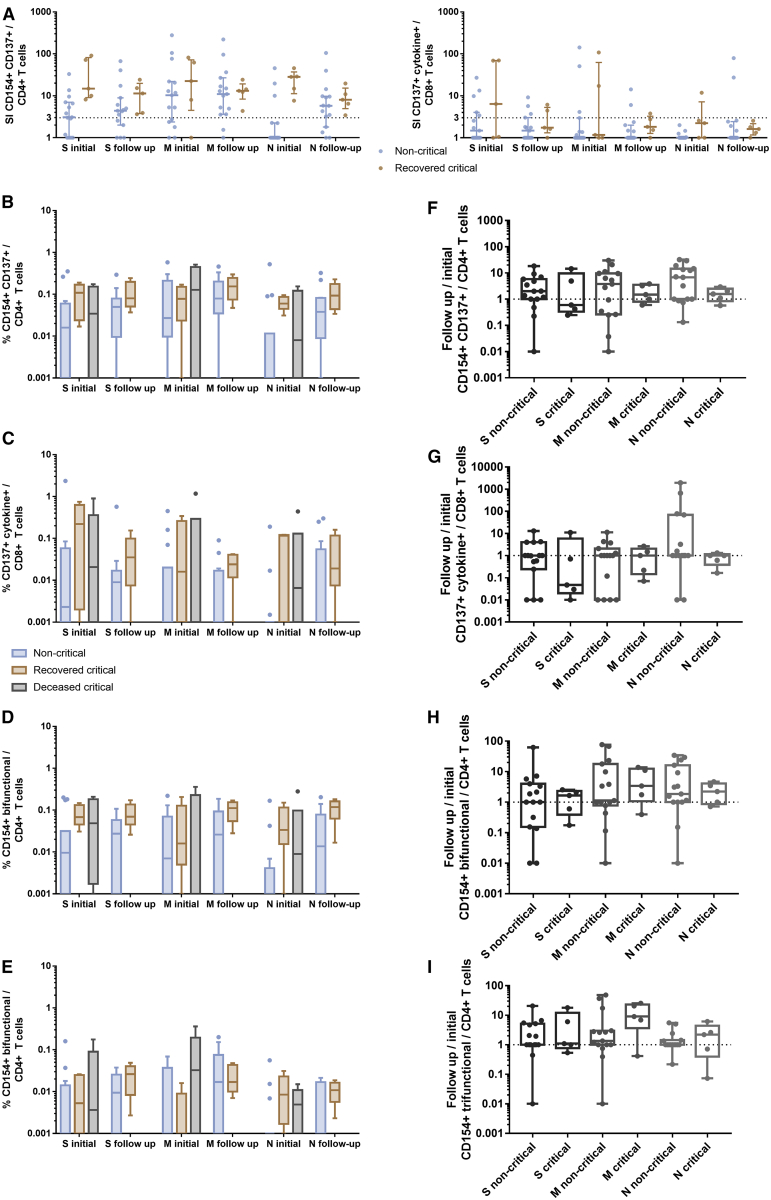
T cell immunity toward SARS-CoV-2 spike (S-), membrane (M-), and nucleocapsid (N-) proteins may define COVID-19 severity. Therefore, we compare the SARS-CoV-2-reactive T cell responses in moderate, severe, and critical COVID-19 patients and unexposed donors. Overlapping peptide pools of all three proteins induce SARS-CoV-2-reactive T cell response with dominance of CD4+ over CD8+ T cells and demonstrate interindividual immunity against the three proteins. M-protein induces the highest frequencies of CD4+ T cells, suggesting its relevance for diagnosis and vaccination. The T cell response of critical COVID-19 patients is robust and comparable or even superior to non-critical patients. Virus clearance and COVID-19 survival are not associated with either SARS-CoV-2 T cell kinetics or magnitude of T cell responses, respectively. Thus, our data do not support the hypothesis of insufficient SARS-CoV-2-reactive immunity in critical COVID-19. Conversely, it indicates that activation of differentiated memory effector T cells could cause hyperreactivity and immunopathogenesis in critical patients.

Keywords: COVID-19; S/M/N protein-reactive T cells; SARS-CoV-2; critical COVID-19; immunity; immunopathology; nucleocapsid; spike.


Conflict of interest statement

The authors declare no competing interests.

Figures

None
Graphical abstract
Figure 1
Figure 1
SARS-CoV-2-Reactive T Cells Are Induced by the S-, M- and N-Proteins with Interindividual Patterns Peripheral blood mononuclear cells (PBMCs) isolated from 65 blood samples collected from 28 COVID-19 patients with moderate, severe, or critical disease and blood samples of 10 unexposed donors collected and cryopreserved before the COVID-19 pandemic were stimulated for 16 h with S-, M-, or N-protein OPPs. Antigen-reactive T cells were determined by flow cytometry and identified according to the gating strategy presented in Figure S2. Maximum values of each COVID-19 patient were compared to unexposed donors. (A) Representative plots of CD4+ T cells and CD8+ T cells after stimulation with S-, M-, and N-protein OPPs. Antigen-reactive CD4+ T cells were identified by CD154 and CD137 expression and antigen-reactive CD8+ T cells by CD137 expression and production of any cytokines out of IL-2, IFN-γ, TNF-α, and/or GrzB (CD137+ cytokine+). (B) Stimulation index (SI) of CD154+ CD137+ CD4+ T cells (SARS-COV-2-specific CD4+ T cells), CD137+ cytokine+ CD8+ T cells (SARS-COV-2-specific CD8+ T cells) and bifunctional and trifunctional CD154+ CD4+ and CD137+ CD8+ T cells. Bi- and trifunctional T cells were calculated by Boolean gating of IL-2, IFN-γ, TNF-α, IL-4, and GrzB production. SI was calculated by dividing the measured T cell subset response by the respective response in the DMSO control. Values >3 were considered detectable in the following analyses. The maximum value of each COVID-19 patient is depicted. Scatterplots show line at median; error bars represent the interquartile ranges. The statistical comparison was done with the Kruskal-Wallis test and the Dunn’s multiple comparisons test. p < 0.05 was considered significant. (C) Frequency of patient samples with detectable (SI > 3) CD4+ (left) and CD8+ (right) T cell responses in at least 1 sample after stimulation with S-, M-, or N-protein (total of 65 samples of 28 COVID-19 patients and 10 samples of 10 unexposed donors). (D) Venn diagrams of 28 COVID-19 patients and 10 unexposed donors with detectable (SI > 3) SARS-Cov-2-reactive CD4+ or CD8+ T cells after stimulation with S-, M-, or N-protein in at least 1 sample. A total of 27 COVID-19 patients and 4 unexposed donors showed CD4+ T cell reactivity and 21 COVID-19 patients and 3 unexposed donors showed CD8+ T cell reactivity toward at least 1 of the tested SARS-CoV-2-S-, M-, and N-proteins. See also Figures S1, S2, and S3 and Table S2.
Figure 2
Figure 2
SARS-CoV-2 Reactive T Cells Display a Higher M-Protein Reactivity in CD4+ T Cells and S- and N-Protein Reactivity in CD8+ T Cells From a total of 28 COVID-19 patients, 65 blood samples were drawn at 1 or at multiple time points after SARS-CoV-2 positive PCR tests. PBMCs were stimulated for 16 h with S-, M-, or N-protein OPPs. The gating strategy is presented in Figure S2. (A–F) Mean frequencies of samples of individual COVID-19 patients (n = 28). (A) CD154+ CD137+ CD4+ T cells (antigen-specific CD4+ T cells), and (B) IFN-γ-, (C) TNF-α-, (D) IL-2-, (E) IL-4-, and (G) GrzB-producing antigen-specific CD4+ T cells. The statistical analysis was performed with the Friedman test for non-parametric data and with Dunn’s multiple comparisons test. p < 0.05 was considered significant. Boxplots show medians and interquartile ranges. Whiskers and outliers were calculated with the Tukey method. (G–I) Correlation of M-, N-, and S-protein OPP-reactive (CD154+ CD137+) CD4+ T cells. The calculation was performed with Spearman’s rank correlation coefficient. (J–O) Mean frequencies per COVID-19 patient (n = 28). (J) CD137+ IL-2, IFN-γ, TNF-α, and/or GrzB (CD137+ cytokine+) CD8+ T cells (antigen-specific CD8+ T cells), and (K) IFN-γ-, (L) TNF-α-, (M) IL-2-, (N) IL-4-, and (O) GrzB-producing CD137+ CD8+ T cells. The statistical analysis was performed with the Friedman test for non-parametric data and with Dunn’s multiple comparisons test. p < 0.05 was considered significant. Boxplots show medians and interquartile ranges. Whiskers and outliers were calculated with the Tukey method. (P–R) Correlation analysis of M-, N-, and S-protein-reactive (CD137+ cytokine+) CD8+ T cells. The calculation was performed with Spearman’s rank correlation coefficient. See also Figures S1 and S2.
Figure 3
Figure 3
Critical COVID-19 Patients Maintain a Strong SARS-CoV-2 S-, M-, and N-Protein-Reactive CD4+ and CD8+ T Cell Response From a total of 28 COVID-19 patients, 65 blood samples were drawn at 1 or at multiple time points after COVID-19 diagnosis. The mean frequency was calculated for each individual COVID-19 patient. COVID-19 severity was assessed at the time of sampling as per the guidelines of the German Robert Koch Institute and the patients grouped according to their worst disease category (n = 7 moderate, n = 9 severe, and n = 12 critical samples). PBMCs were stimulated for 16 h with S-, M-, or N-protein OPPs and analyzed by flow cytometry. The gating strategy to identify SARS-CoV-2 S-, M-, or N-protein-reactive T cells is presented in Figure S2. (A–D) Frequencies of (A) CD154+ CD137+ CD4+ T cells (antigen-specific CD4+ T cells), and (B) IFN-γ-, (C) IL-2-, and (D) TNF-α-producing antigen-specific CD4+ T cells. (E and F) Frequencies of polyfunctional CD154+ CD4+ T cells. (E) Bifunctional and (F) trifunctional CD154+ CD4+ T cells were analyzed by Boolean gating of IL-2, IFN-γ, TNF-α, IL-4, and GrzB production. A detailed composition of bi- and trifunctional cells is presented in Figure S4. (G–I) Frequencies of antigen-specific CD4+ (G) TEM, (H) TCM, and (I) TEMRA cells. (J–M) Frequencies of (J) CD137+ IL-2, IFN-γ, TNF-α and/or GrzB (CD137+ cytokine+) CD8+ T cells (antigen-specific CD8+ T cells), and (K) IFN-γ-, (L) IL-2-, and (M) GrzB-producing CD137+ CD8+ T cells. (N and O) Frequencies of polyfunctional CD137+ CD8+ T cells. (N) Bifunctional and (O) trifunctional CD137+ CD8+ T cells were analyzed by Boolean gating of IL-2, IFN-γ, TNF-α, IL-4, and GrzB production. Composition of bi- and trifunctional cells is presented in Figure S4. (P–R) Frequencies of antigen-specific CD8+ (P) TEM, (Q) TCM, and (R) TEMRA cells. Statistical comparisons were done with 2-way repeated-measures ANOVA and with Tukey’s multiple comparison test. p < 0.05 was considered significant. Boxplots show medians and interquartile ranges. Whiskers and outliers were calculated with the Tukey method. See also Figures S1, S2, and S4– S6 and Table S1.
Figure 4
Figure 4
T Cell Reactivity Does Not Differ between Viral PCR-Positive and -Negative Patients Analysis of T cell responses of patients who cleared SARS-CoV-2 (n = 11) and patients who did not clear SARS-CoV-2 according to RT-PCR and were not discharged from the hospital during the observation period (uncleared, n = 7). In the cleared group, a sample before and after viral clearance was analyzed (initial and follow-up sample, respectively). In the uncleared group, the first (initial) and the last (follow-up) available sample were analyzed. PBMCs were stimulated for 16 h with S-, M-, or N-protein OPPs and analyzed by flow cytometry. The gating strategy to identify SARS-CoV-2 S-, M-, or N-protein-reactive T cells is presented in Figure S2. (A) SI of CD154+ CD137+ CD4+ T cells (antigen-specific CD4+ T cells), and CD137+ IL-2, IFN-γ, TNF-α, and/or GrzB (CD137+ cytokine+) CD8+ T cells (antigen-specific CD8+ T cells). SI was calculated by dividing the measured T cell subset response by the respective response in the DMSO control. Scatterplots show line at median; error bars represent interquartile ranges. The statistical comparison was done with 2-way repeated-measures ANOVA and with Sidak’s multiple comparisons test. p < 0.05 was considered significant. (B–E) Comparison of the frequencies of CD154+ CD137+ CD4+ T cells, CD137+ IL-2, IFN-γ, TNF-α, and/or GrzB (CD137+ cytokine+) CD8+ T cells, and bifunctional and trifunctional CD154+ CD4+ T cells. Bi- and trifunctional CD154+ CD4+ T cells were calculated by Boolean gating of IL-2, IFN-γ, TNF-α, IL-4, and GrzB production. The statistical comparisons were done with 2-way repeated-measures ANOVA and with Sidak’s multiple comparison test. p < 0.05 was considered significant. Boxplots show medians and interquartile ranges. Whiskers and outliers were calculated with the Tukey method. (F–I) Relative changes of the follow-up sample compared to the initial sample. A value of 1 indicates no change as compared to the initial sample, lower values indicate a reduction, and values >1 indicate an increase in the frequency of the subset; base 10 logarithmic scale. The statistical comparison was done with the Kruskal-Wallis test and Dunn’s multiple comparisons test. p < 0.05 was considered significant. Boxplots show medians and minimum and maximum values. See also Figures S1, S2, and S7 and Table S3.
Figure 5
Figure 5
T Cell Reactivity Does Not Differ between Patients with Non-critical Disease, Patients Who Recovered from COVID-19, and Patients Who Died Analysis of T cell responses in samples of patients who recovered from critical COVID-19 (n = 5) during critical disease (initial) and shortly before discharge from the intensive care unit (follow-up), compared to samples of critical COVID-19 patients who died (n = 6) and to samples of non-critical COVID-19 patients (n = 15). PBMCs were stimulated for 16 h with S-, M-, or N-protein OPPs and analyzed by flow cytometry. The gating strategy to identify SARS-CoV-2 S-, M-, or N-protein-reactive T cells is presented in Figure S2. (A) SI of CD154+ CD137+ CD4+ T cells (antigen-specific CD4+ T cells) and CD137+ IL-2, IFN-γ, TNF-α, and/or GrzB (CD137+ cytokine+) CD8+ T cells (antigen-specific CD8+ T cells). The SI was calculated by dividing the measured T cell subset response by the respective response in the DMSO control. Scatterplots show line at median; error bars represent interquartile ranges. The statistical comparison was done with 2-way repeated-measures ANOVA and with Sidak’s multiple comparisons test. p < 0.05 was considered significant. (B–E) Comparison of the frequencies of CD154+ CD137+ CD4+ T cells; CD137+ IL-2, IFN-γ, TNF-α, and/or GrzB (CD137+ cytokine+) CD8+ T cells; and bifunctional and trifunctional CD154+ CD4+ T cells. Bi- and trifunctional CD154+ CD4+ T cells were calculated by Boolean gating of IL-2, IFN-γ, TNF-α, IL-4, and GrzB production. The statistical comparisons between non-critical and recovered critical were done with 2-way repeated-measures ANOVA and with Sidak’s multiple comparison test. p < 0.05 was considered significant. Boxplots show medians and interquartile ranges. Whiskers and outliers were calculated with the Tukey method. (F–I) Relative changes of the follow-up sample compared to the initial sample. A value of 1 indicates no change as compared to the initial sample, lower values indicate a reduction, and values >1 indicate an increase in the frequency of the subset; base 10 logarithmic scale. The statistical comparison was done with the Kruskal-Wallis test and with Dunn’s multiple comparisons test. p < 0.05 was considered significant. Boxplots show medians and minimum and maximum values. See also Figures S1 and S2 and Table S4.

References

    1. Zhao J., Zhao J., Perlman S. T cell responses are required for protection from clinical disease and for virus clearance in severe acute respiratory syndrome coronavirus-infected mice. J. Virol. 2010;84:9318–9325. - PMC - PubMed
    1. Vijay R., Perlman S. Middle East respiratory syndrome and severe acute respiratory syndrome. Curr. Opin. Virol. 2016;16:70–76. - PMC - PubMed
    1. Crouse J., Kalinke U., Oxenius A. Regulation of antiviral T cell responses by type I interferons. Nat. Rev. Immunol. 2015;15:231–242. - PubMed
    1. Blanco-Melo D., Nilsson-Payant B.E., Liu W.-C., Uhl S., Hoagland D., Møller R., Jordan T.X., Oishi K., Panis M., Sachs D. Imbalanced Host Response to SARS-CoV-2 Drives Development of COVID-19. Cell. 2020;181:1036–1045.e9. - PMC - PubMed
    1. Hadjadj J., Yatim N., Barnabei L., Corneau A., Boussier J., Pere H., Charbit B., Bondet V., Chenevier-Gobeaux C., Breillat P. Impaired type I interferon activity and exacerbated inflammatory responses in severe Covid-19 patients. medRxiv. 2020 doi: 10.1101/2020.04.19.20068015. - DOI - PMC - PubMed

Publication types

Substances