

Explainable end-to-end deep learning for diabetic retinopathy detection across multiple datasets
- PMID: 32904519
- PMCID: PMC7456641
- DOI: 10.1117/1.JMI.7.4.044503
Explainable end-to-end deep learning for diabetic retinopathy detection across multiple datasets
Abstract
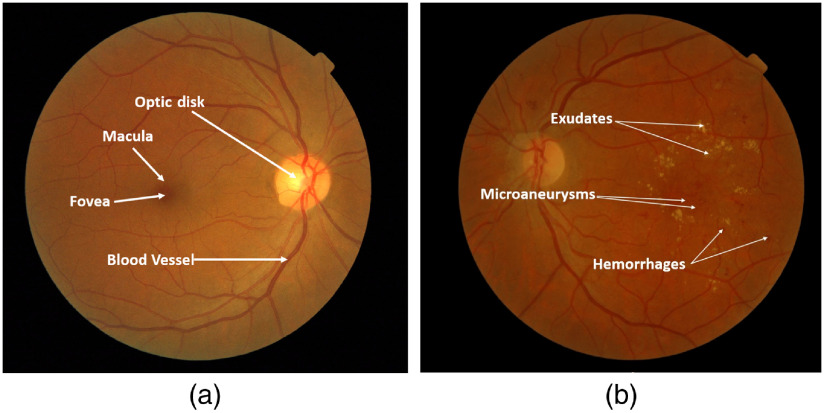
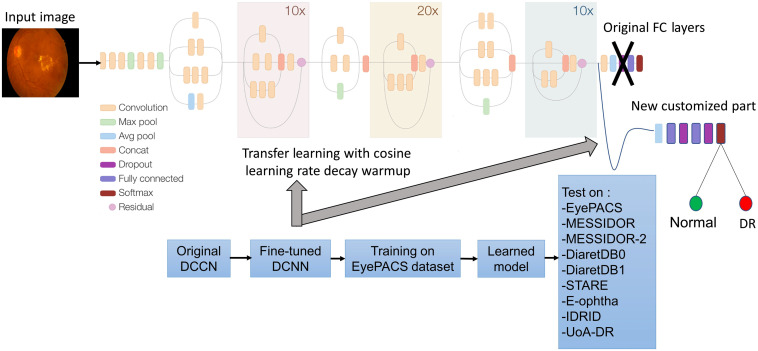
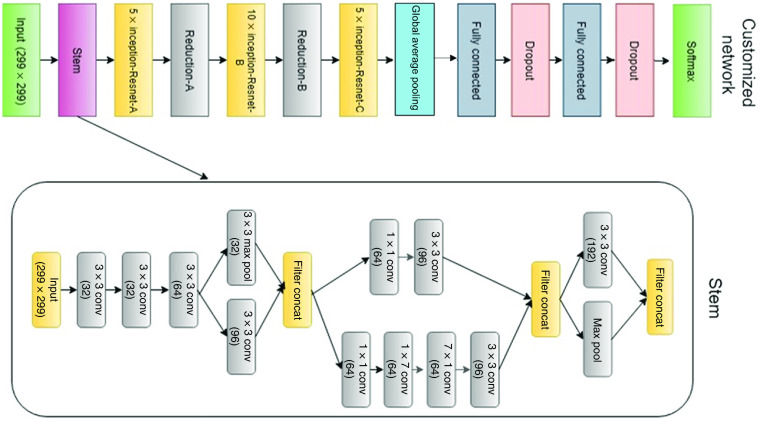
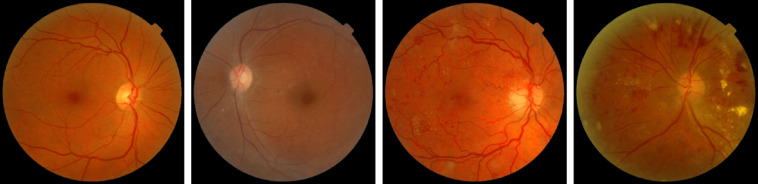
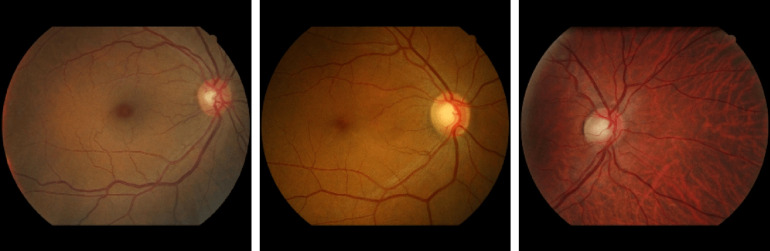
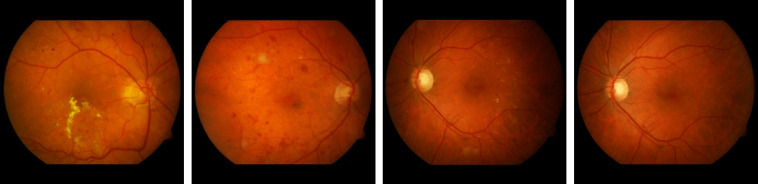
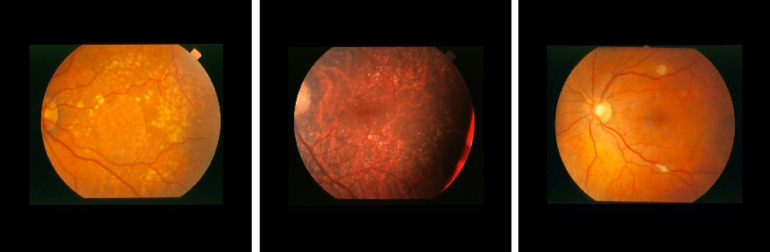
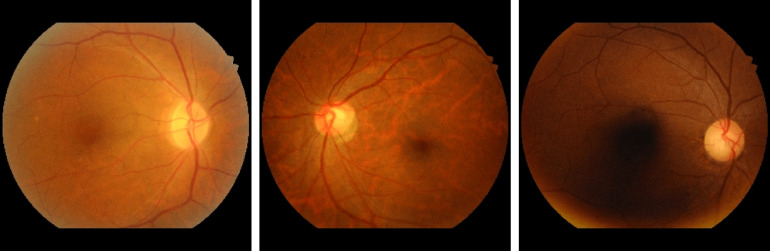
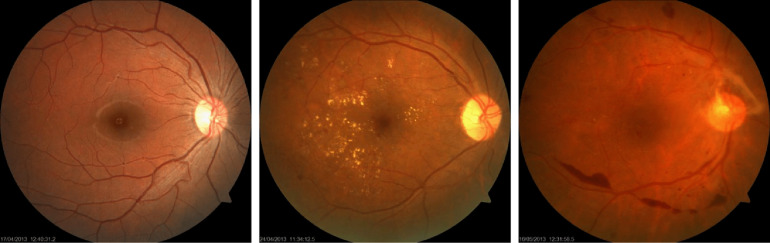
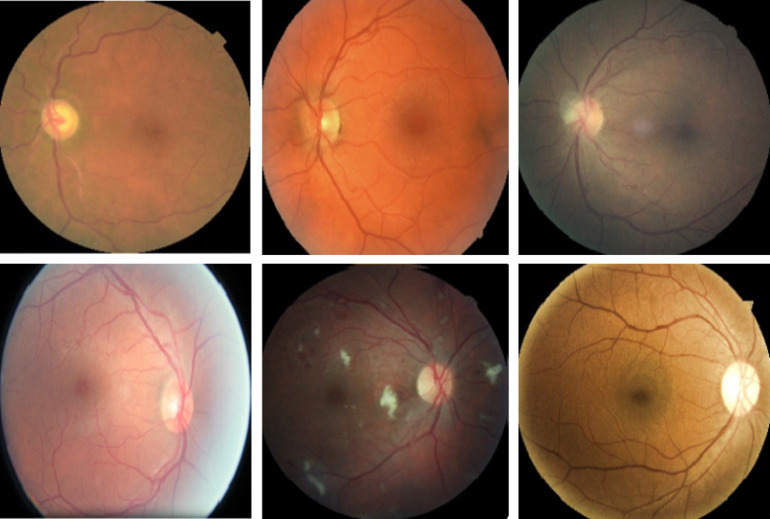
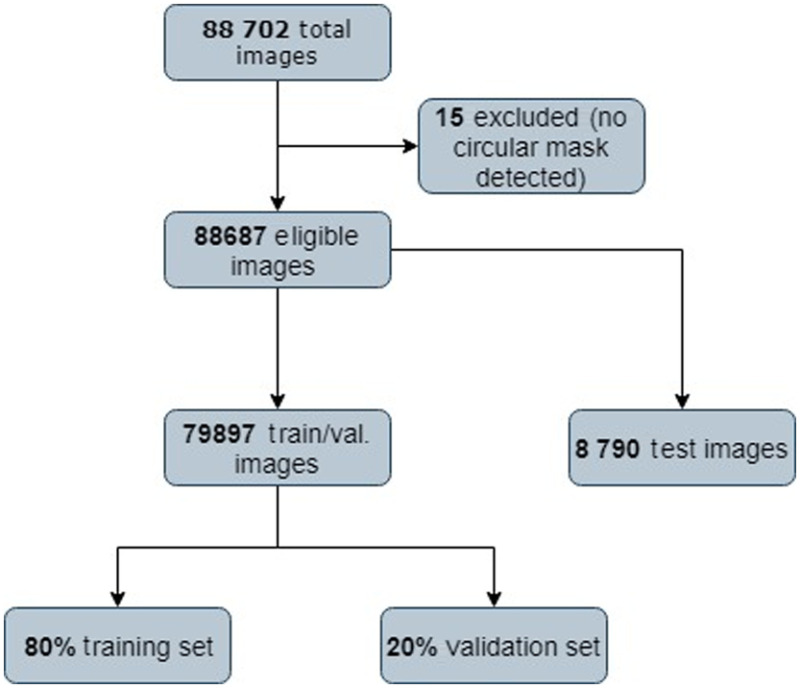
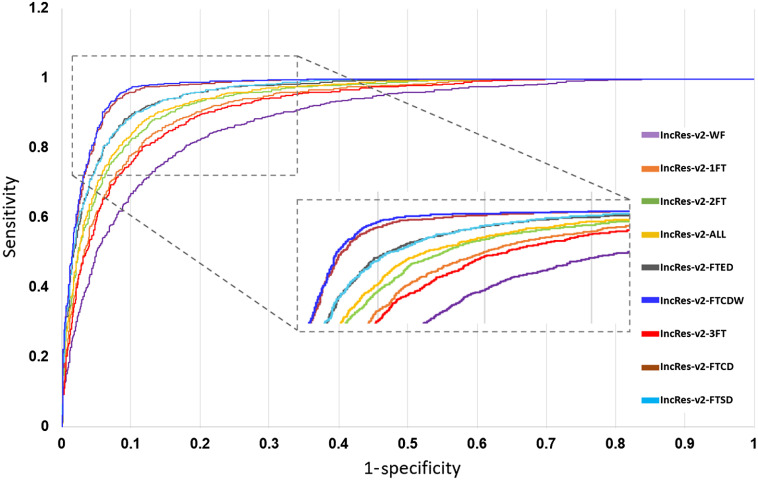
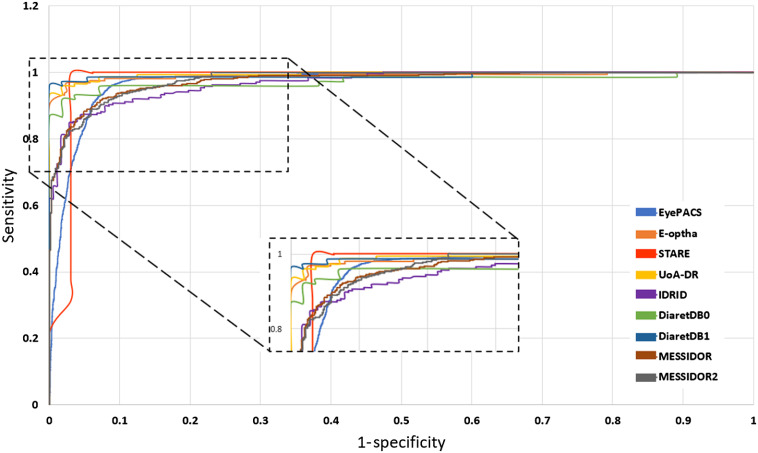
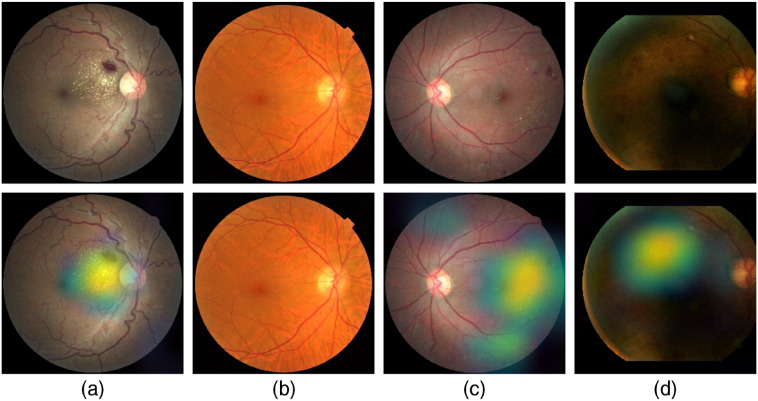
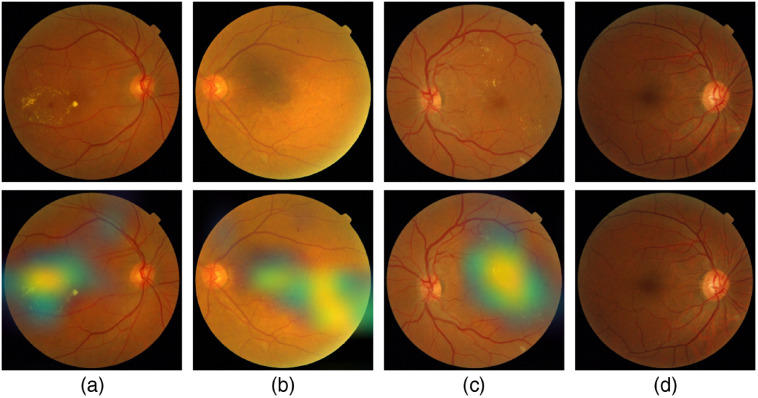
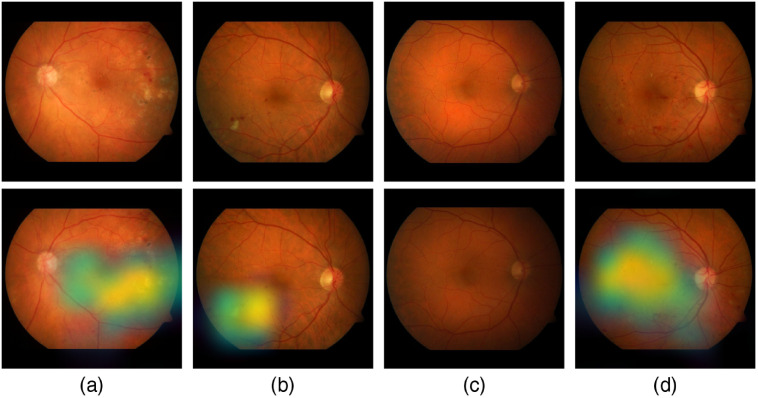
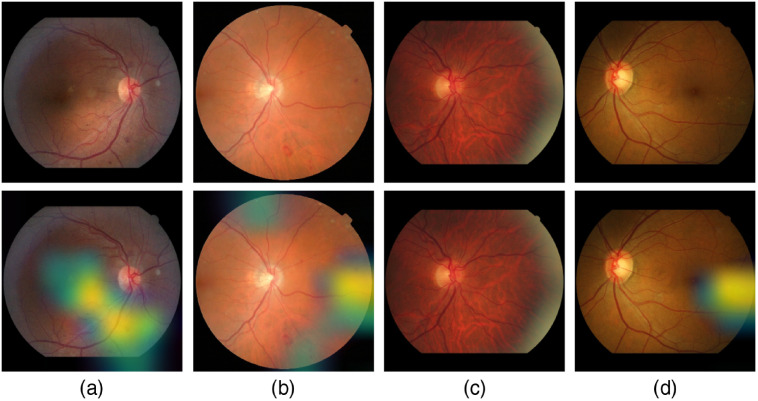
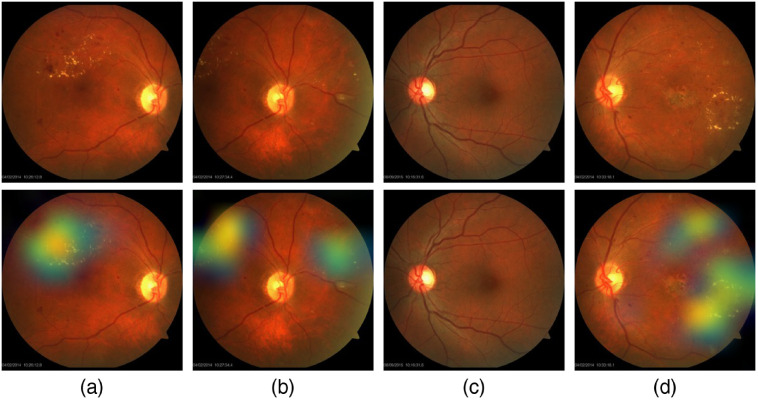
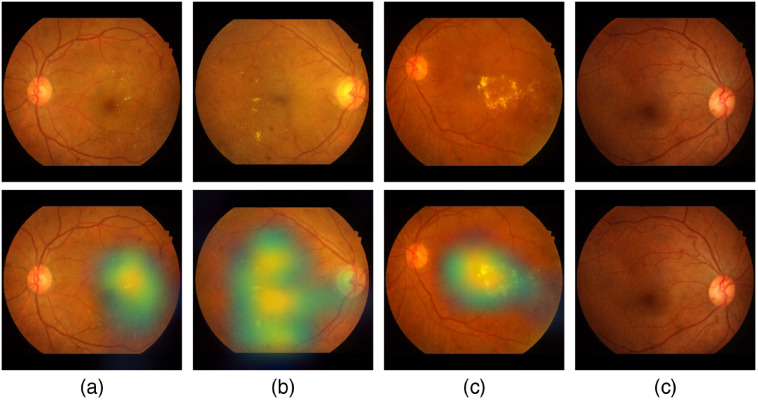
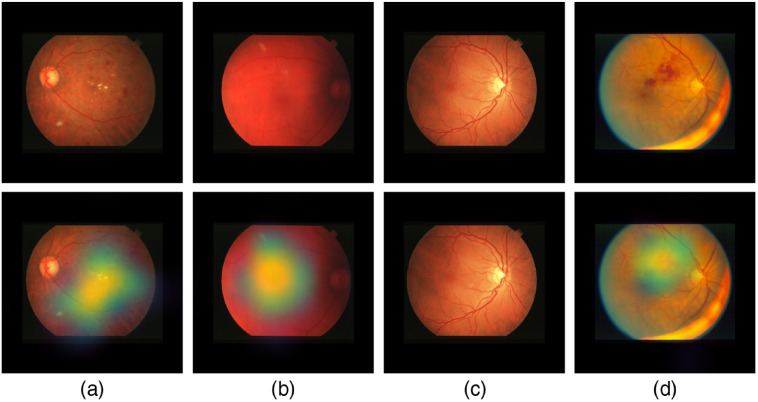
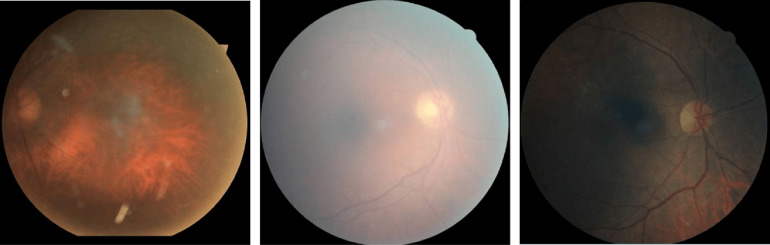
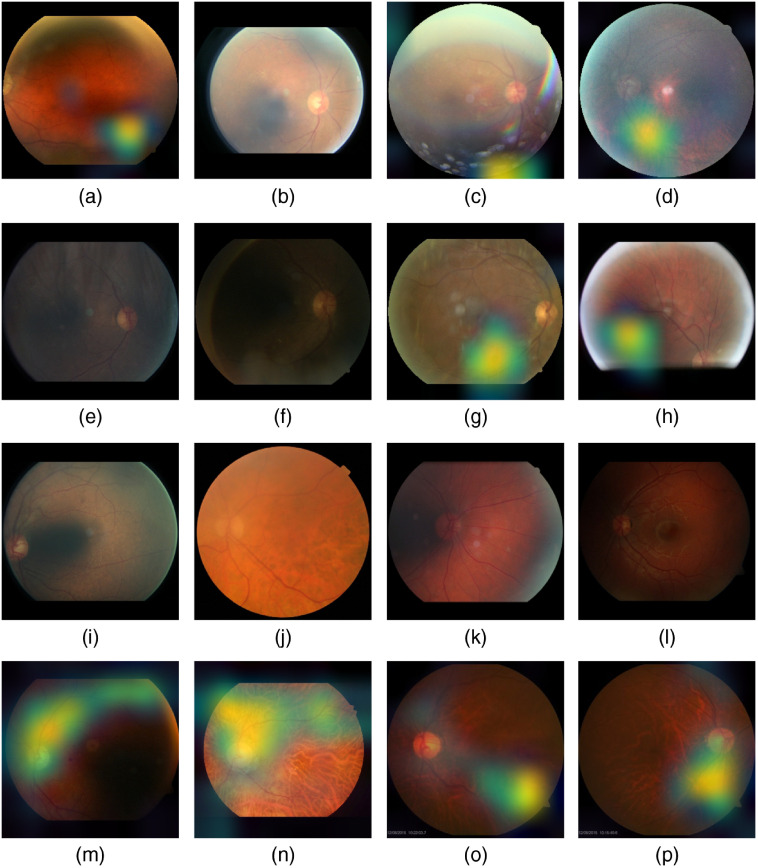
Purpose: Diabetic retinopathy (DR) is characterized by retinal lesions affecting people having diabetes for several years. It is one of the leading causes of visual impairment worldwide. To diagnose this disease, ophthalmologists need to manually analyze retinal fundus images. Computer-aided diagnosis systems can help alleviate this burden by automatically detecting DR on retinal images, thus saving physicians' precious time and reducing costs. The objective of this study is to develop a deep learning algorithm capable of detecting DR on retinal fundus images. Nine public datasets and more than 90,000 images are used to assess the efficiency of the proposed technique. In addition, an explainability algorithm is developed to visually show the DR signs detected by the deep model. Approach: The proposed deep learning algorithm fine-tunes a pretrained deep convolutional neural network for DR detection. The model is trained on a subset of EyePACS dataset using a cosine annealing strategy for decaying the learning rate with warm up, thus improving the training accuracy. Tests are conducted on the nine datasets. An explainability algorithm based on gradient-weighted class activation mapping is developed to visually show the signs selected by the model to classify the retina images as DR. Result: The proposed network leads to higher classification rates with an area under curve (AUC) of 0.986, sensitivity = 0.958, and specificity = 0.971 for EyePACS. For MESSIDOR, MESSIDOR-2, DIARETDB0, DIARETDB1, STARE, IDRID, E-ophtha, and UoA-DR, the AUC is 0.963, 0.979, 0.986, 0.988, 0.964, 0.957, 0.984, and 0.990, respectively. Conclusions: The obtained results achieve state-of-the-art performance and outperform past published works relying on training using only publicly available datasets. The proposed approach can robustly classify fundus images and detect DR. An explainability model was developed and showed that our model was able to efficiently identify different signs of DR and detect this health issue.
Keywords: convolutional neural networks; diabetic retinopathy; exudates and hemorrhage; inception; microaneurysms; residual networks.
© 2020 Society of Photo-Optical Instrumentation Engineers (SPIE).
Figures
Similar articles
-
Combining transfer learning with retinal lesion features for accurate detection of diabetic retinopathy.Front Med (Lausanne). 2022 Nov 8;9:1050436. doi: 10.3389/fmed.2022.1050436. eCollection 2022. Front Med (Lausanne). 2022. PMID: 36425113 Free PMC article.
-
Development and Validation of a Deep Learning Algorithm for Detection of Diabetic Retinopathy in Retinal Fundus Photographs.JAMA. 2016 Dec 13;316(22):2402-2410. doi: 10.1001/jama.2016.17216. JAMA. 2016. PMID: 27898976
-
Explainable Diabetic Retinopathy using EfficientNET.Annu Int Conf IEEE Eng Med Biol Soc. 2020 Jul;2020:1966-1969. doi: 10.1109/EMBC44109.2020.9175664. Annu Int Conf IEEE Eng Med Biol Soc. 2020. PMID: 33018388
-
Artificial Intelligence (AI)-Enhanced Detection of Diabetic Retinopathy From Fundus Images: The Current Landscape and Future Directions.Cureus. 2024 Aug 26;16(8):e67844. doi: 10.7759/cureus.67844. eCollection 2024 Aug. Cureus. 2024. PMID: 39323686 Free PMC article. Review.
-
Reproducibility and Explainability of Deep Learning in Mammography: A Systematic Review of Literature.Indian J Radiol Imaging. 2023 Oct 10;34(3):469-487. doi: 10.1055/s-0043-1775737. eCollection 2024 Jul. Indian J Radiol Imaging. 2023. PMID: 38912238 Free PMC article. Review.
Cited by
-
Explainable Vision Transformers and Radiomics for COVID-19 Detection in Chest X-rays.J Clin Med. 2022 May 26;11(11):3013. doi: 10.3390/jcm11113013. J Clin Med. 2022. PMID: 35683400 Free PMC article.
-
Applications of interpretability in deep learning models for ophthalmology.Curr Opin Ophthalmol. 2021 Sep 1;32(5):452-458. doi: 10.1097/ICU.0000000000000780. Curr Opin Ophthalmol. 2021. PMID: 34231530 Free PMC article. Review.
-
A Proposed Framework for Machine Learning-Aided Triage in Public Specialty Ophthalmology Clinics in Hong Kong.Ophthalmol Ther. 2021 Dec;10(4):703-713. doi: 10.1007/s40123-021-00405-7. Epub 2021 Oct 12. Ophthalmol Ther. 2021. PMID: 34637117 Free PMC article.
-
Deciphering the Feature Representation of Deep Neural Networks for High-Performance AI.IEEE Trans Pattern Anal Mach Intell. 2024 Aug;46(8):5273-5287. doi: 10.1109/TPAMI.2024.3363642. Epub 2024 Jul 2. IEEE Trans Pattern Anal Mach Intell. 2024. PMID: 38373137 Free PMC article.
-
Uncovering Language Disparity of ChatGPT on Retinal Vascular Disease Classification: Cross-Sectional Study.J Med Internet Res. 2024 Jan 22;26:e51926. doi: 10.2196/51926. J Med Internet Res. 2024. PMID: 38252483 Free PMC article.
References
-
- Buch H., Vinding T., Nielsen N. V., “Prevalence and causes of visual impairment according to world health organization and United States criteria in an aged, urban Scandinavian population: the Copenhagen city eye study,” Ophthalmology 108(12), 2347–2357 (2001).OPANEW10.1016/S0161-6420(01)00823-5 - DOI - PubMed
-
- Chetoui M., Akhloufi M. A., Kardouchi M., “Diabetic retinopathy detection using machine learning and texture features,” in IEEE Can. Conf. Electr. Comput. Eng. (CCECE), IEEE, pp. 1–4 (2018).10.1109/CCECE.2018.8447809 - DOI
-
- Ojala T., Pietikäinen M., Harwood D., “A comparative study of texture measures with classification based on feature distributions,” Pattern Recognit. 29, 51–59 (1996).10.1016/0031-3203(95)00067-4 - DOI
-
- Sarfraz M., Hellwich O., “Head pose estimation in face recognition across pose scenarios,” in Int. Conf. Comput. Vision Theory and Appl., VISAPP, Vol. 1, pp. 235–242 (2008).
LinkOut - more resources
Full Text Sources
Miscellaneous
