. 2020 Oct:119:103978.
doi: 10.1016/j.jedc.2020.103978. Epub 2020 Aug 29.

A quantitative easing experiment

Affiliations

A quantitative easing experiment

Adrian Penalver et al. J Econ Dyn Control. 2020 Oct.

Abstract

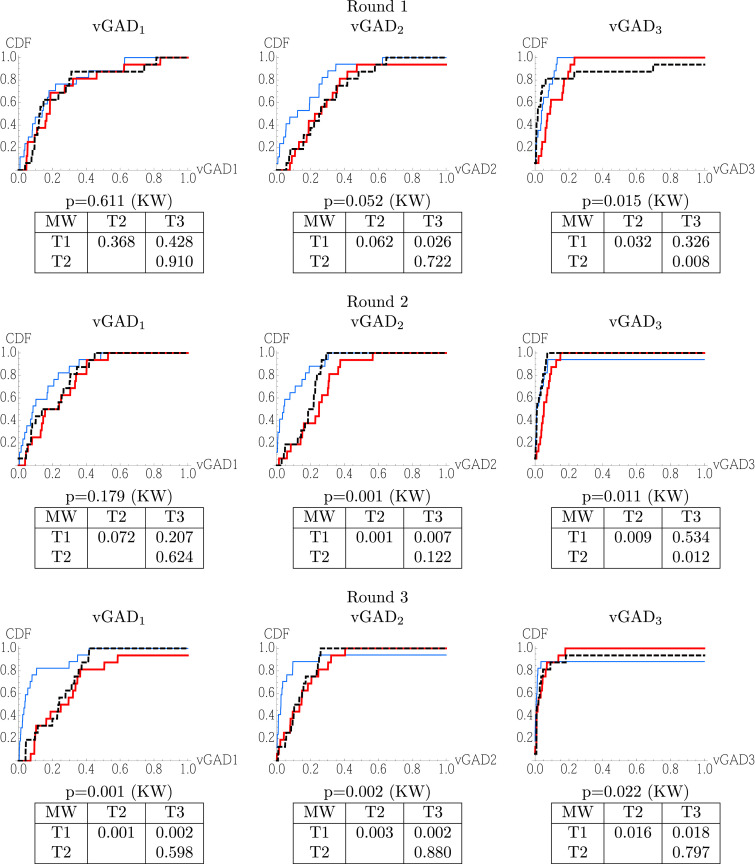
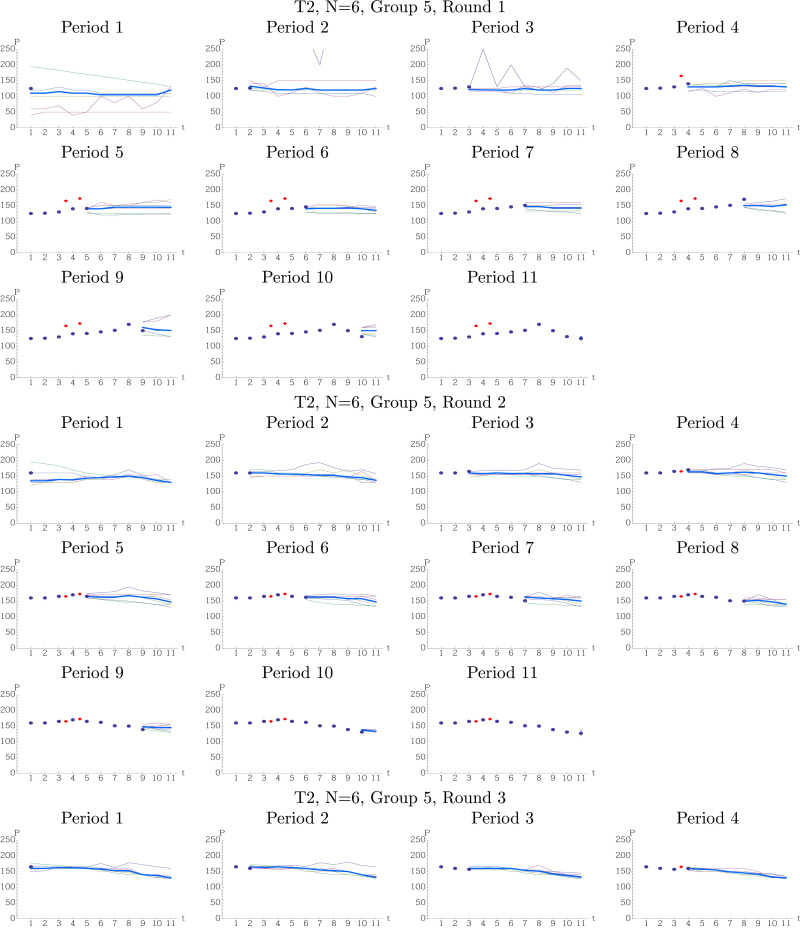
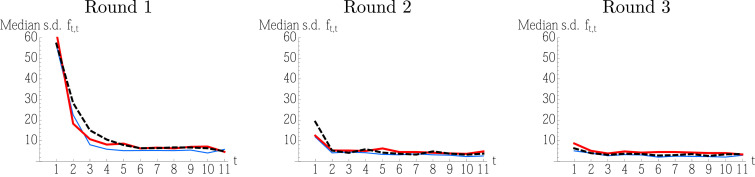
We experimentally investigate the effect of a central bank buying bonds for cash in a quantitative easing (QE) operation. In our experiment, the bonds are perfect substitutes for cash and have a constant fundamental value which is not affected by QE in the rational expectations equilibrium. We find that QE raises bond prices above those in the benchmark treatment without QE. Subjects in the benchmark treatment learned to trade the bonds at their fundamental value but those in treatments with QE became more convinced after repeated exposure to the same treatment that QE boosts bond prices. This suggests the possibility of a behavioural channel for the observed effects of actual QE operations on bond yields.

Keywords: Expectation dynamics; Experimental asset market; Quantitative easing.


Figures

Fig. 1
Fig. 1
Dynamics of median price deviations from the fundamental value in T1: Benchmark (thin blue), T2: Buy&Hold (thick red), and T3: Buy&Sell (dashed black) over three rounds. (For interpretation of the references to colour in this figure legend, the reader is referred to the web version of this article.)
Fig. 2
Fig. 2
ECD of vGAD (top) and vGD (bottom) for three rounds. T1: Benchmark (blue), T2: Buy&Hold (red), and T3: Buy&Sell (dashed black). P-values from the KW test for multiple comparisons as well as from the MW tests for pairwise comparisons are reported. (For interpretation of the references to colour in this figure legend, the reader is referred to the web version of this article.)
Fig. 3
Fig. 3
ECD of vGAD in three subperiods. vGAD1 (periods 1–3). vGAD2 (period 5–7). vGAD3 (period 9–11) for three rounds. T1: Benchmark (blue), T2: Buy&Hold (red), and T3: Buy&Sell (dashed black). P-values from the KW test for multiple comparison as well as MW tests for pairwise comparisons are reported. (For interpretation of the references to colour in this figure legend, the reader is referred to the web version of this article.)
Fig. 4
Fig. 4
Dynamics of forecasts and price observed in benchmark treatment with six traders per market, Group 1. Top: Round 1. Middle: Round 2. Bottom: the first four periods of Round 3. Thin lines: individual traders. Thick line: Medians. Dots: realized market prices. Red diamonds: average price paid by the central bank.
Fig. 5
Fig. 5
Dynamics of the median within-market standard deviation of the short-term forecasts in three rounds. T1: Benchmark (blue), T2: Buy&Hold (red), and T3: Buy&Sell (dashed black). (For interpretation of the references to colour in this figure legend, the reader is referred to the web version of this article.)
Fig. A1
Fig. A1
ECD of vGD in three subperiods. vGD1 (periods 1–3). vGD2 (periods 5–7). vGD3 (periods 9–11) for three rounds. T1: Benchmark (blue), T2: Buy&Hold (red), and T3: Buy&Sell (dashed black). P-values from KW test for multiple comparison, as well as MW tests for pairwise comparisons are reported. (For interpretation of the references to colour in this figure legend, the reader is referred to the web version of this article.)
Fig. B1
Fig. B1
The average (left) and the median (right) initial forecasts deviations from FV for 11 periods in three treatments. T1: Benchmark (thin blue), T2: Buy&Hold (thick red), and T3: Buy&Sell (black dashed). (For interpretation of the references to colour in this figure legend, the reader is referred to the web version of this article.)
Fig. B2
Fig. B2
Empirical CDF of RAFD1 and RFD1. T1: Benchmark (thin blue), T2: Buy&Hold (thick red), and T3: Buy&Sell (black dashed). (For interpretation of the references to colour in this figure legend, the reader is referred to the web version of this article.)

References

    1. Abbink K., Brandts J., Pezanis-Christou P. Auctions for government securities: a laboratory comparison of uniform, discriminatory and spanish designs, Journal of Economic Behavior and Organization. 2006;61:284–303.
    1. Akiyama E., Hanaki N., Ishikawa R. How do experienced traders respond to inflows of inexperienced traders? an experimental analysis. Journal of Economic Dynamics and Control. 2014;45:1–18.
    1. Akiyama E., Hanaki N., Ishikawa R. It is not just confusion! strategic uncertainty in an experimental asset market, Economic Journal. 2017;127:F563–F580.
    1. Arrata W., Nguyen B. Working papers 623. Banque de France; 2017. Price impact of bond supply shocks: Evidence from the eurosystem’s asset purchase program,
    1. Asparouhova E., Bossaerts P., Roy N., Zame W. ‘Lucas’ in the laboratory. Journal of Finance. 2016;71:2727–2779.

Further reading

    1. Bosch-Rosa C., Meissner T., Bosch-Domènech A. Cognitive bubbles. Experimental Economics. 2018;21:132–153.
    1. Breaban A., Noussair C.N. Trader characteristics and fundamental value trajectories in an asset market experiment, J Behav Exp Finance. 2015;8:1–17.
    1. Janssen D., Füllbrunn S., Weitzel U. Individual speculative behavior and overpricing in experimental asset markets. Experimental Economics. 2019;22:653–675.

LinkOut - more resources