

Performance bonuses in the public sector: Winner-take-all prizes versus proportional payments to reduce child malnutrition in India
- PMID: 32904677
- PMCID: PMC7457730
- DOI: 10.1016/j.jdeveco.2018.10.003
Performance bonuses in the public sector: Winner-take-all prizes versus proportional payments to reduce child malnutrition in India
Abstract
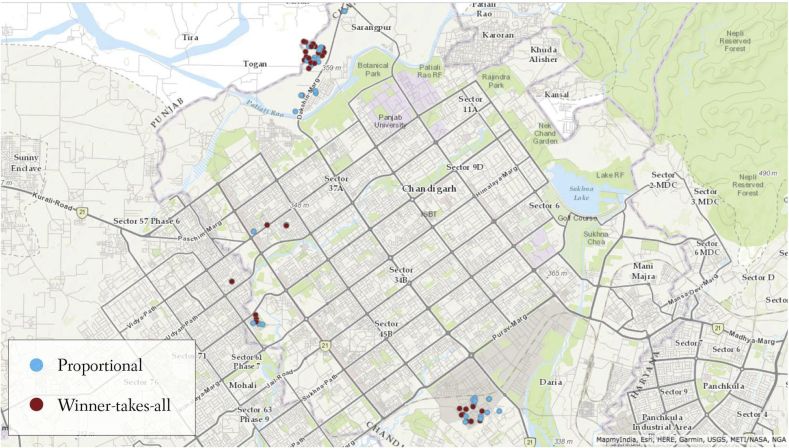
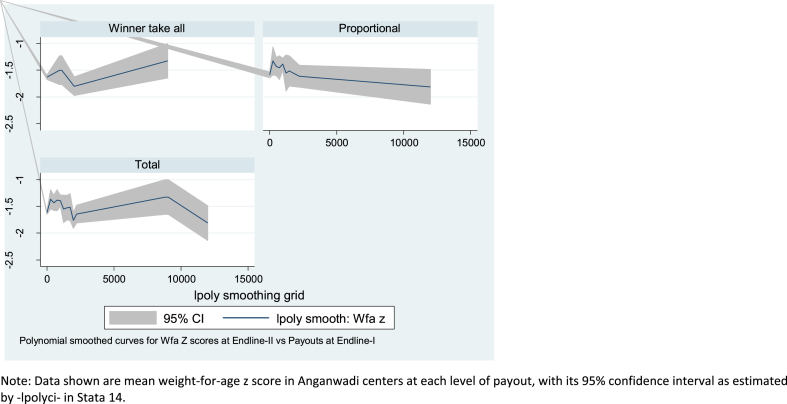
We conduct a randomized trial to compare incentives for improved child outcomes among salaried caregivers in Chandigarh, India. A contest whose prize is divided among workers in proportion to measured gains yielded more improvement than a winner-take-all program. In our population of about 2000 children served by 85 workers, using proportional rewards led to weight-for-age malnutrition rates that were 4.3 percentage points lower at 3 months (when rewards were paid) and 5.9 points lower at 6 months (after the contest had ended), with mean weight-for-age z scores that were 0.071 higher at 3 months, and 0.095 higher at 6 months. Proportional bonuses led to larger and more sustained gains because of better performance by lower-ranked workers, whose efforts were not rewarded by a winner-take-all prize. Results are consistent with previous laboratory trials and athletic events, demonstrating the value of proportional rewards to improve development outcomes.
Keywords: Child development; Contest design; Malnutrition; Performance pay; Underweight.
© 2018 The Authors.
Figures

References
-
- Amare Y. JSI Research and Training Institute; Addis Ababa, Ethiopia: 2009. Non-financial Incentives for Voluntary Community Health Workers: a Qualitative Study.
-
- Amodio F., Martinez-Carrasco M.A. Input allocation, workforce management and productivity spillovers: evidence from personnel data. Rev. Econ. Stud. 2018;85:1937–1970.
-
- Ashraf N., Bandiera O., Jack B.K. No margin, no mission? A field experiment on incentives for public service delivery. J. Publ. Econ. 2014;120:1–17.
-
- Bandiera O., Barankay I., Rasul I. Social preferences and the response to incentives: evidence from personnel data. Q. J. Econ. 2005;120(3):917–962.
LinkOut - more resources
Full Text Sources