. 2020;1(1):tgaa019.
doi: 10.1093/texcom/tgaa019. Epub 2020 May 28.

Hippocampal Resting-State Functional Connectivity Patterns are More Closely Associated with Severity of Subjective Memory Decline than Whole Hippocampal and Subfield Volumes

Affiliations

Hippocampal Resting-State Functional Connectivity Patterns are More Closely Associated with Severity of Subjective Memory Decline than Whole Hippocampal and Subfield Volumes

Lauren Zajac et al. Cereb Cortex Commun. 2020.

Abstract

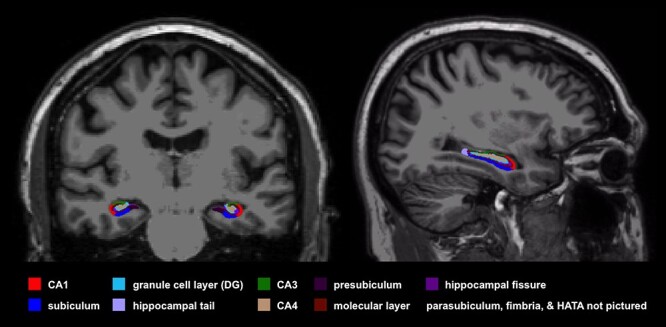
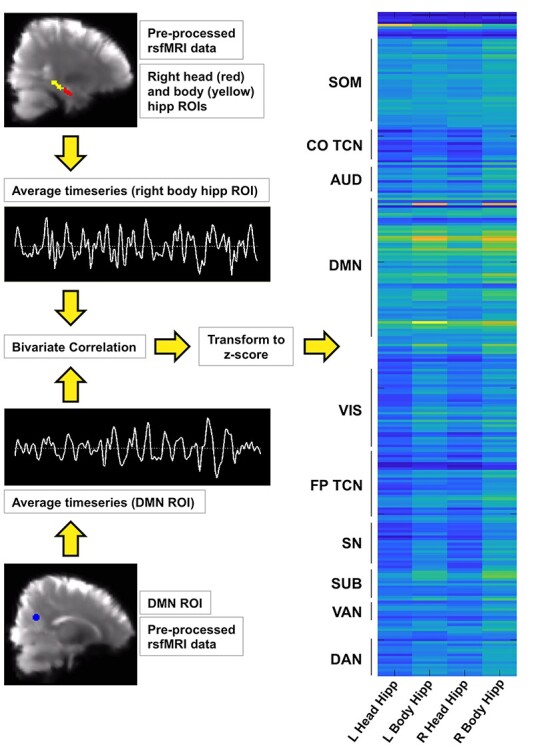
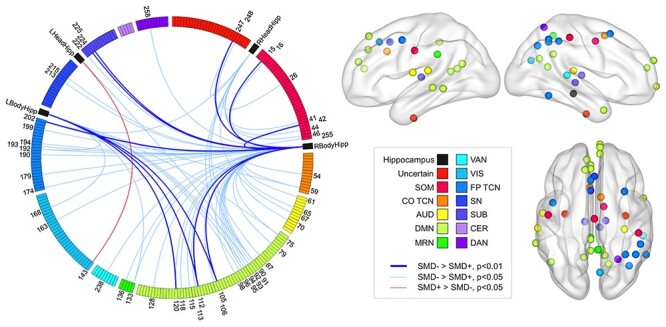
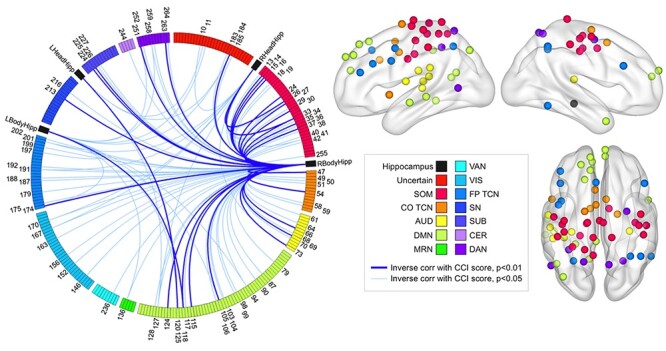
The goal of this study was to examine whether hippocampal volume or resting-state functional connectivity (rsFC) patterns are associated with subjective memory decline (SMD) in cognitively normal aged adults. Magnetic resonance imaging data from 53 participants (mean age: 71.9 years) of the Boston University Alzheimer's Disease Center registry were used in this cross-sectional study. Separate analyses treating SMD as a binary and continuous variable were performed. Subfield volumes were generated using FreeSurfer v6.0, and rsFC strength between the head and body of the hippocampus and the rest of the brain was calculated. Decreased left whole hippocampal volume and weaker rsFC strength between the right body of the hippocampus and the default mode network (DMN) were found in SMD+. Cognitive Change Index score was not correlated with volumetric measures but was inversely correlated with rsFC strength between the right body of the hippocampus and 6 brain networks, including the DMN, task control, and attentional networks. These findings suggest that hippocampal rsFC patterns reflect the current state of SMD in cognitively normal adults and may reflect subtle memory changes that standard neuropsychological tests are unable to capture.

Keywords: aging; brain connectomics; cognition; hippocampus; humans; magnetic resonance imaging.


Figures

Figure 1
Figure 1
A representative hippocampal subfield segmentation from one participant is shown. Subfield segmentations were performed in FreeSurfer v6.0, which divides the hippocampus into 12 subfields in each hemisphere. Most of the subfields are shown in this image, with the parasubiculum, fimbria, and hippocampal-amygdala transition area (HATA) not pictured. All subfields volumes were adjusted for eTIV and age.
Figure 2
Figure 2
A schematic representing hippocampal rsFC strength calculations is shown. Top left: representative RHeadHipp (red) and body of the hippocampus (yellow) ROIs are shown overlaid on preprocessed rsfMRI data in MNI 2 mm space. The hippocampal mask generated in FreeSurfer v6.0 was divided into head, body, and tail to create the head and body ROIs. Bottom left: a Power ROI that belongs to the DMN is shown overlaid on preprocessed rsfMRI data in MNI 2 mm space. Each Power ROI was a 10 mm-diameter binary sphere, and there were 264 Power ROIs in total. For each participant, the average band-pass filtered blood oxygenation level-dependent timeseries from the right and left head and body of the hippocampus and each Power ROI was extracted. Examples are shown in this image. Bivariate correlation was run between each hippocampal ROI timeseries and each Power ROI timeseries, transformed to z-scores and assembled into a 4 × 264 rsFC matrix (right). A representative rsFC matrix from one participant is shown, in which yellow represents strong rsFC and dark blue represents weak rsFC. The Power ROIs are largely grouped by brain network, and these are shown to the left of the matrix.
Figure 3
Figure 3
Differential hippocampal rsFC in SMD+ versus SMD−. The 69 hippocampal rsFC variables showing differential connectivity in SMD+ relative to SMD− displayed (left) on a Circos graph (Krzywinski et al. 2009) and a subset of these variables represented (right) on cortical surfaces created in Brain Net Viewer v1.6 (Xia et al. 2013). The colors displayed on the legend represent specific brain networks. The colors of the regions displayed on the circular boundary on the Circos graphs and the spheres on the cortical surfaces correspond to these brain networks. The circular boundary on the Circos graph displays the 264 Power ROIs grouped by the networks shown in the legend. The black regions on the Circos graph represent the left and right head and body of the hippocampus. The red and blue lines on the Circos graph represent connections between hippocampal ROIs and Power ROIs that were significantly stronger in SMD+ and SMD−, respectively. The numbers on the Circos graph correspond to specific Power ROIs whose connectivity strength with any of the hippocampal ROIs differed between groups. The number of connections between the right body of the hippocampus and other brain regions weaker in SMD+ relative to the number of weaker connections between the other hippocampal regions and the rest of the brain combined was greater than chance. Only the nodes showing weaker rsFC strength with the right body of the hippocampus in SMD+ are displayed on the cortical surfaces on the right. The number of weaker connections between the right body of the hippocampus and regions in the DMN (pale green nodes, right) was significantly greater than chance and survived correction for multiple comparisons. LBodyHipp, left body of the hippocampus; LHeadHipp, left head of the hippocampus.
Figure 4
Figure 4
Hippocampal rsFC strength is inversely associated with SMD severity. The 115 connections between hippocampal and Power ROIs showing an inverse relationship with CCI score are displayed on the Circos graph. No positive relationships were found. The number of connections between the right body of the hippocampus and other brain regions showing an inverse relationship with SMD relative to the number of connections between the other hippocampal regions and the rest of the brain showing an inverse relationship with SMD severity combined was greater than chance. The number of connections between the right body of the hippocampus and regions in the SOM, AUD, COTCN, FPTCN, DAN, and DMN inversely associated with SMD severity was significantly greater than chance and survived correction for multiple comparisons. The nodes representing the brain regions within these 6 networks whose connection strength with the right body of the hippocampus showed an inverse relationship with SMD severity are displayed on the right on cortical surfaces created in Brain Net Viewer v1.6 (Xia et al. 2013).

References

    1. Aisen PS., Petersen RC, Donohue M, Weiner MW, & Alzheimer’s Disease Neuroimaging Initiative. (2015). Alzheimer’s disease neuroimaging initiative 2 clinical core: Progress and plans. Alzheimer’s & Dementia. 11(7): 734–739. - PMC - PubMed
    1. Amariglio RE, Mormino EC, Pietras AC, Marshall GA, Vannini P, Johnson KA, Sperling RA, Rentz DM. 2015. Subjective cognitive concerns, amyloid-beta, and neurodegeneration in clinically normal elderly. Neurology. 85:56–62. - PMC - PubMed
    1. Andrews-Hanna JR, Reidler JS, Sepulcre J, Poulin R, Buckner RL. 2010. Functional-anatomic fractionation of the brain's default network. Neuron. 65:550–562. - PMC - PubMed
    1. Andrews-Hanna JR, Snyder AZ, Vincent JL, Lustig C, Head D, Raichle ME, Buckner RL. 2007. Disruption of large-scale brain systems in advanced aging. Neuron. 56:924–935. - PMC - PubMed
    1. Barnes LL, Schneider JA, Boyle PA, Bienias JL, Bennett DA. 2006. Memory complaints are related to Alzheimer disease pathology in older persons. Neurology. 67:1581–1585. - PMC - PubMed

LinkOut - more resources