. 2020 Jan;16(1):101-108.
doi: 10.1038/s41567-019-0680-8. Epub 2019 Oct 21.

Cell swelling, softening and invasion in a three-dimensional breast cancer model

Affiliations

Cell swelling, softening and invasion in a three-dimensional breast cancer model

Yu Long Han et al. Nat Phys. 2020 Jan.

Abstract

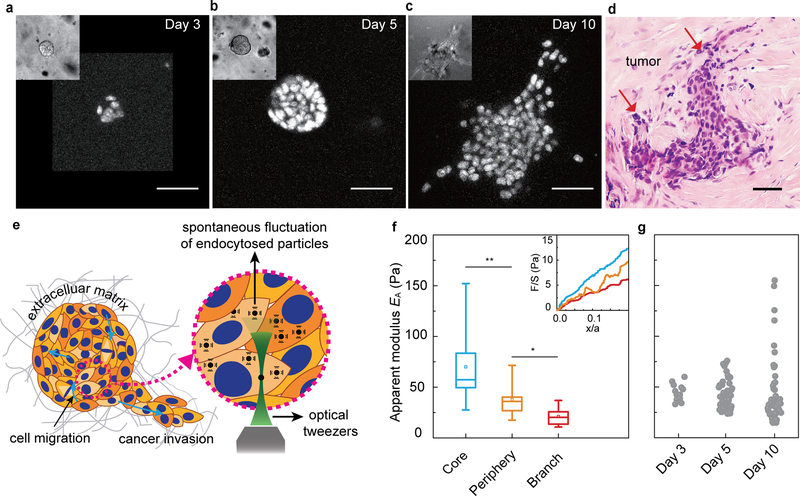
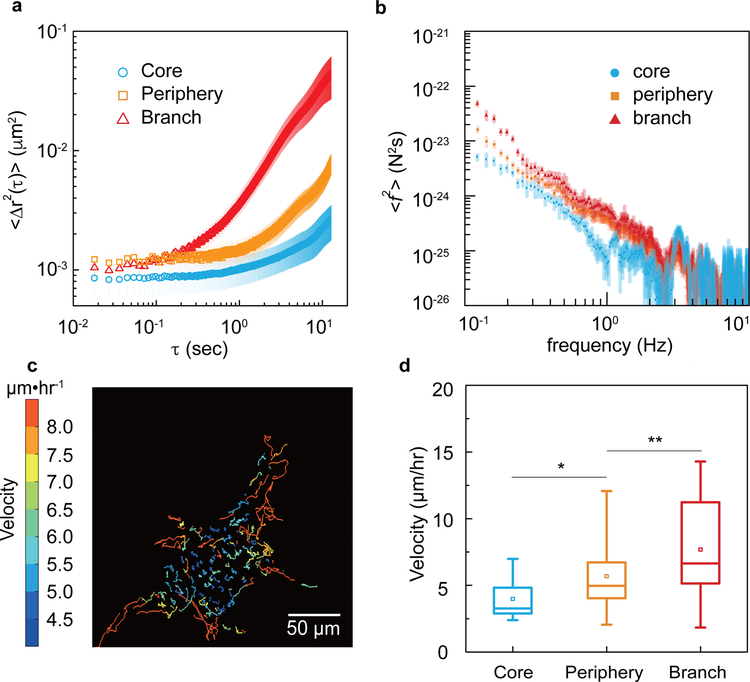
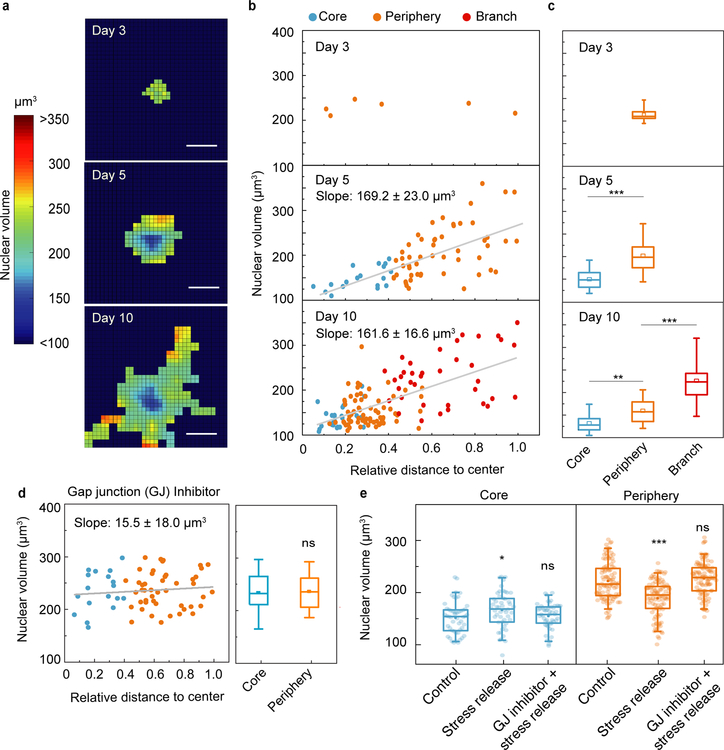
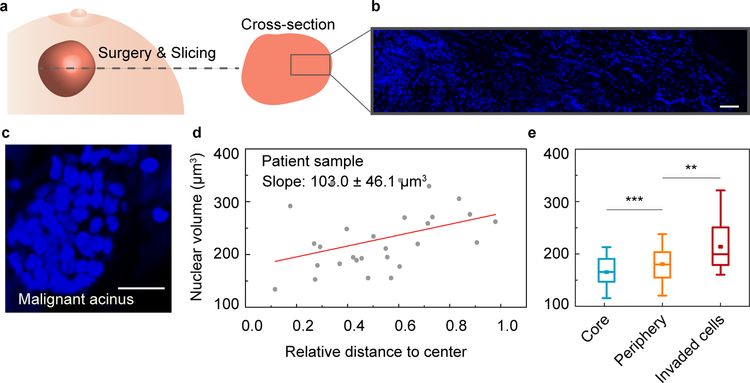
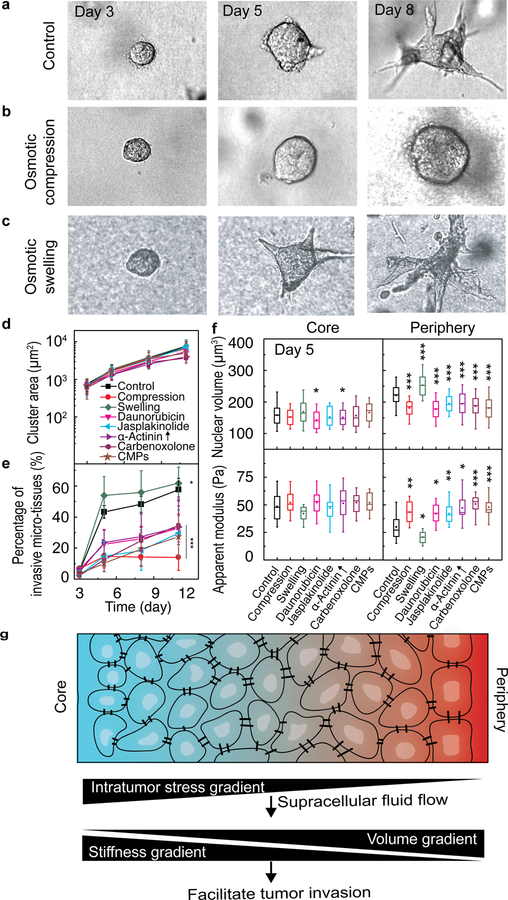
Sculpting of structure and function of three-dimensional multicellular tissues depend critically on the spatial and temporal coordination of cellular physical properties, yet the organizational principles that govern these events, and their disruption in disease, remain poorly understood. Using a multicellular mammary cancer organoid model, here we map in three dimensions the spatial and temporal evolution of positions, motions, and physical characteristics of individual cells. Compared with cells in the organoid core, cells at the organoid periphery and the invasive front are found to be systematically softer, larger and more dynamic. These mechanical changes are shown to arise from supracellular fluid flow through gap junctions, suppression of which delays transition to an invasive phenotype. Together, these findings highlight the role of spatiotemporal coordination of cellular physical properties in tissue organization and disease progression.


Conflict of interest statement

Conflict of Interest statement: The authors declare no conflict of interests.

Figures

Figure 1.
Figure 1.. Evolution of heterogeneity and subpopulations of cell stiffness in the growing cancer organoid.
a-c, Cross-section images of epithelial cancer organoid developed from GFP-NLS labeled MCF-10A cells at different stages, early stage (day 3, (a)), middle stage (day 5, (b)) and later stage (day 10, (c)). d, Haemotoxylin and Eosin (H&E) stains from grade-2 ER+ invasive-ductal-carcinoma human-breast-cancer tissue samples. Tumor glands are indicated using red arrows. e, Schematic illustration of the cytoplasmic mechanics and dynamics measurements in a growing cancer organoid using optical tweezers. f, The apparent modulus, EA, of individual cells in core (blue), periphery (orange) and branch (red) regions of the cancer organoid, quantified from slopes of the normalized force-displacement curves (inset of f). g, Mechanical heterogeneity of individual cells within the cancer organoid at different stages. Measurements are done in more than 3 independent cancer organoids for f and g. *P<0.05; **P < 0.01; ***P<0.001. Scale bars in a-d indicate 50 μm.
Figure 2.
Figure 2.. Different cell subpopulations in a cancer organoid show distinct dynamic behaviors.
a, Two dimensional time- and ensemble-averaged MSD, <Δr2(τ)>, of 0.5-μm-diameter particles are plotted against lag time on a log-log scale, in the cytoplasm of cells in core (blue circles), periphery (orange squares) and branch (red triangles) regions of the cancer organoid. The data is averaged from 15 independent measurements and the error bars stand for standard deviation. b, Cytoplasmic force spectrum calculated from spontaneous fluctuations of tracer particles and the active microrheology measurements, through <f2(ω)>=|K(ω)|2<r2(ω)> inside cells at different locations of the cancer organoid. Data are shown as mean ± standard deviation. (n>10). c, Cell migratory trajectories over 4 hours reveal a highly dynamic scenario of cell migration within the central 20-μm cross-section of the cancer organoid. The color stands for the average migratory speed of each cell. d, The migratory speed of cells in each subpopulations are plotted. *P<0.05; **P < 0.01; ***P<0.001.
Figure 3.
Figure 3.. Temporal and spatial evolution of cell volume during the growth of cancer organoids.
a, Nuclear volume heat map shows the evolution of cell nuclear volume distribution in the developing cancer organoid. b, Nuclear volume of every individual cell in the cancer organoid is plotted against relative distance to the organoid center at different stages, showing a strong correlation between nuclear volume and spatial position, especially at middle and later stages. c, Nuclear volume of cells in different geometrical regimes of the cancer organoids (n>3). d, Nuclear volume of individual cells in GJ-inhibited cancer organoids. e, Stress release changes the distribution of individual nuclear volumes in the core and periphery if GJ are intact. Scale bars in a represent 50 μm. *P<0.05; **P < 0.01; ***P<0.001.
Figure 4.
Figure 4.. Characterization of cell volume heterogeneity in patient samples.
a, Schematic of a tumor biopsy from breast cancer patient. b, Large-scale fluorescent image showing cell nuclei from core to edge area of the biopsy. c, Invasive acinar structures within the biopsy. d, Individual cell nuclear volume is plotted against its relative distance to the center of the invasive acinar structure. e, Nuclear volume of cells in different geometrical regimes of the invasive acinar structures (n=3). Scale bars in b and c represent 50 and 20 μm, respectively. *P<0.05; **P < 0.01; ***P<0.001.
Figure 5.
Figure 5.. Stiffening the soft cell subpopulation inhibits the invasion of the tumor cells.
a-c, Bright-field images show the time-dependent morphological changes of the developing cancer organoids under different culture conditions, including complete culture medium (a), osmotic compression (b) and osmotic swelling (c). d, Quantification of the projected areas of cancer organoids shows the growth rate under different culture conditions are comparable. CMPs: connexin mimetic peptides. e, Percentage of the invasive cancer organoids over time under different culture conditions. Stars indicates the statistically significant difference between each groups and the control on day 11 f, Cell nuclear volume and cell stiffness in the core and periphery of the organoids under different conditions in d. g, Working hypothesis that the intratumor stress gradient drives supracellular fluid flow and thus results in cell volume and stiffness gradients, which together facilitate tumor cell invasion. *P<0.05; **P < 0.01; ***P<0.001. Scale bars in a, b and c represent 50 μm. Error bars in d and e indicate standard deviation. Measurements are done in 3 independent experiments.

References

    1. Rigato A, Miyagi A, Scheuring S & Rico F High-frequency microrheology reveals cytoskeleton dynamics in living cells. Nat. Phys 13, 771–775 (2017). - PMC - PubMed
    1. Fenz SF et al. Membrane fluctuations mediate lateral interaction between cadherin bonds. Nat. Phys 13, 906 (2017).
    1. Tanimoto H, Sallé J, Dodin L & Minc N Physical forces determining the persistency and centring precision of microtubule asters. Nat. Phys 14, 848–854 (2018). - PMC - PubMed
    1. Nam S & Chaudhuri O Mitotic cells generate protrusive extracellular forces to divide in three-dimensional microenvironments. Nat. Phys 14, 621–628 (2018).
    1. Serra-Picamal X et al. Mechanical waves during tissue expansion. Nat. Phys 8, 628–634 (2012).