. 2020 Aug 1;10(8):2480-2494.
eCollection 2020.

Stabilization of oncogenic transcripts by the IGF2BP3/ELAVL1 complex promotes tumorigenicity in colorectal cancer

Affiliations

Stabilization of oncogenic transcripts by the IGF2BP3/ELAVL1 complex promotes tumorigenicity in colorectal cancer

Kexin Li et al. Am J Cancer Res. .

Abstract

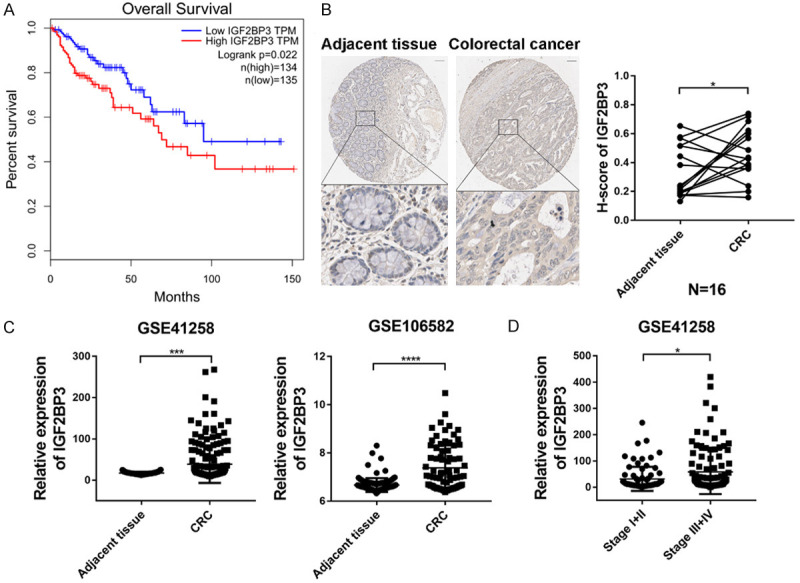
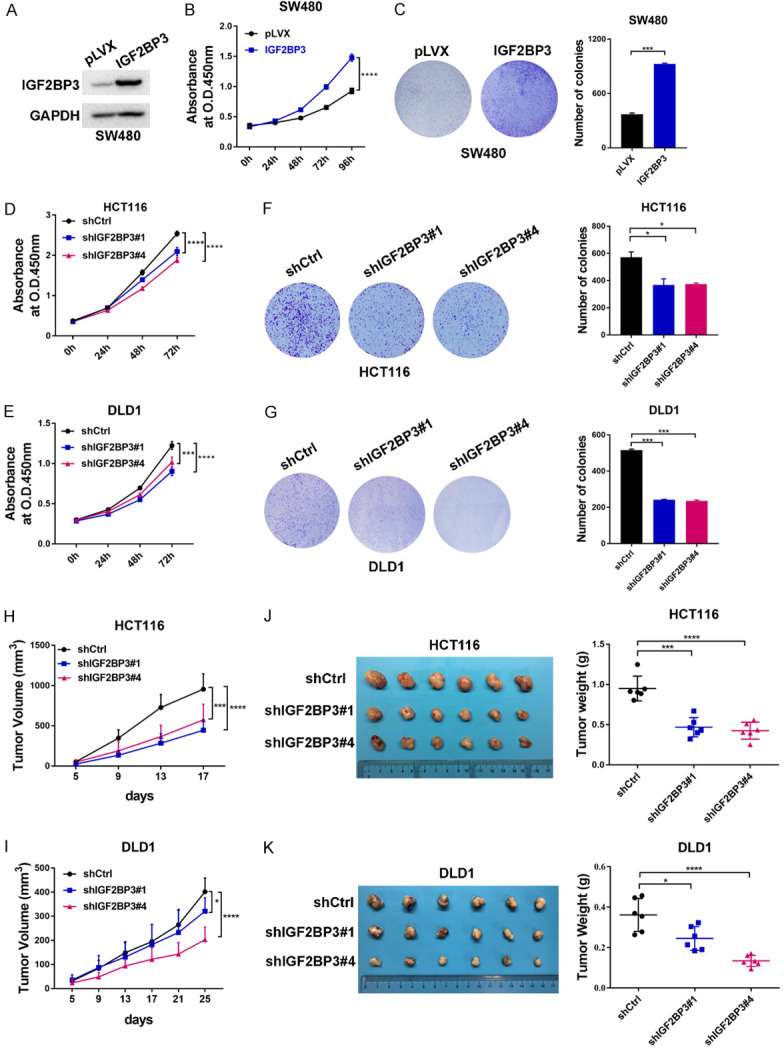
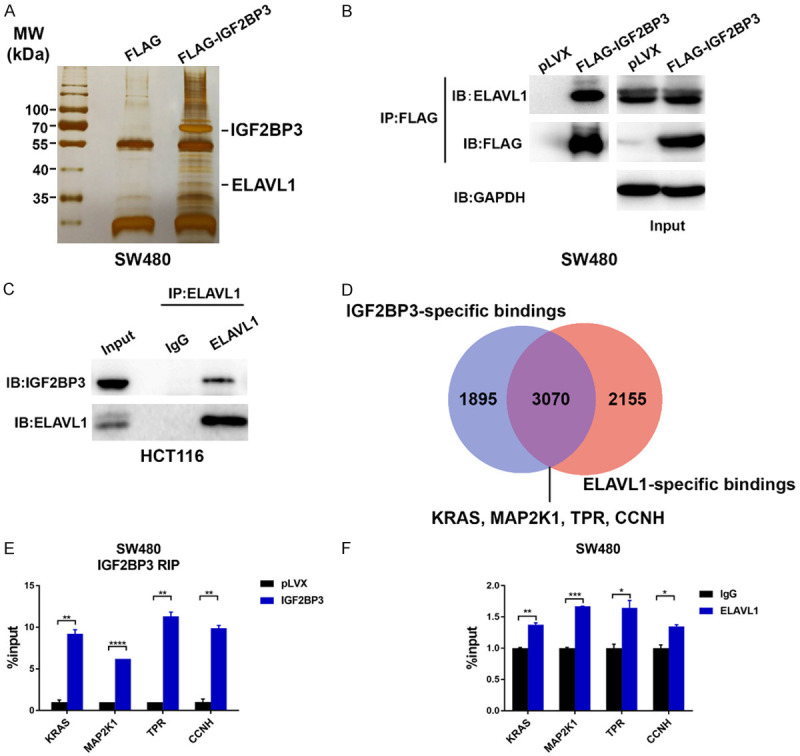
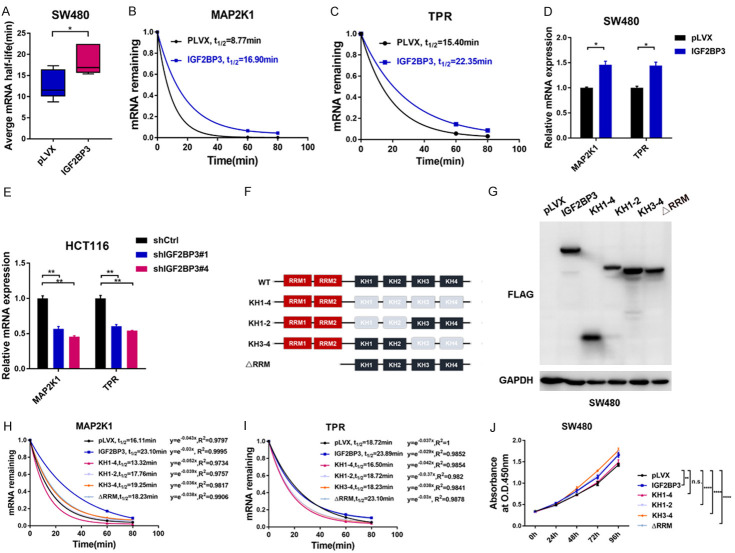
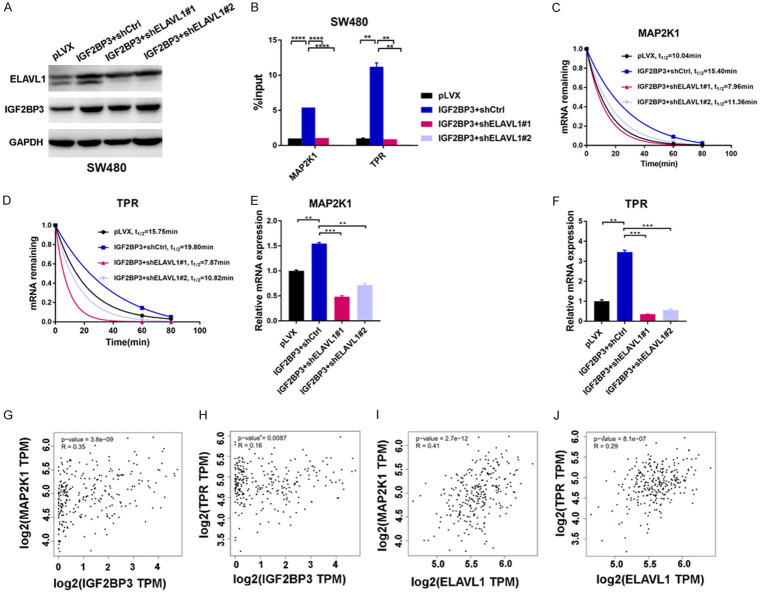
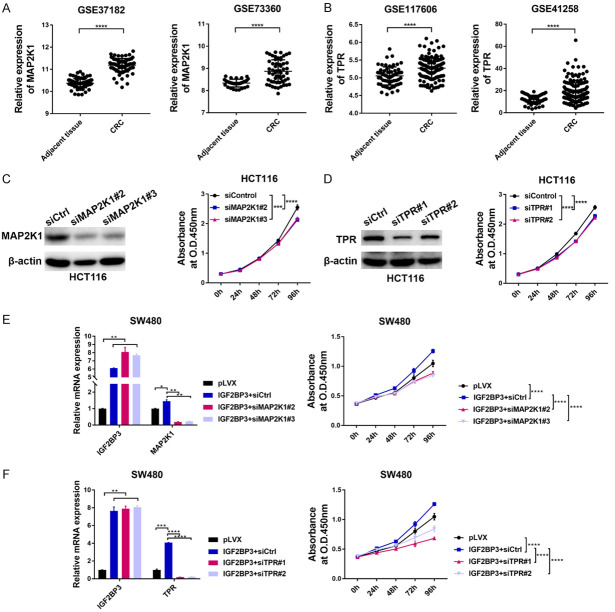
The expression of RNA-binding proteins (RBPs) is dysregulated in colorectal cancer (CRC) and in other types of cancer. Among the RBPs, the insulin-like growth factor-2 messenger RNA binding protein (IGF2BP1-3) family is involved in the development of the colon and the progression of CRC. However, the regulation of mRNA fate by IGF2BP3 in CRC remains less well understood. Here, we show that IGF2BP3 interacts with ELAVL1 to coregulate a cohort of genes involved in the cell cycle and cell proliferation. Mechanistically, recognition of these mRNAs by the IGF2BP3/ELAVL1 complex leads to prolonged half-lives of the mRNA molecules and increased expression of the target genes, thereby driving CRC cell proliferation. Interestingly, knockdown of either IGF2BP3 or ELAVL1 impairs the IGF2BP3/ELAVL1 complex-enhanced mRNA stability, suggesting a functional interdependency between IGF2BP3 and ELAVL1 in CRC. Our findings reveal the molecular mechanism by which IGF2BP3 regulates mRNA stability and identify the cooperativity of the IGF2BP3/ELAVL1 complex as a novel therapeutic target in CRC.

Keywords: Colorectal cancer; ELAVL1; IGF2BP3; RBP; mRNA stability.


Conflict of interest statement

None.

Figures

Figure 1
Figure 1
Analysis of clinical significance of IGF2BP3 in CRC. (A) Kaplan-Meier analysis of CRC patient survival with the GEPIA database [18] in strata defined according to high or low expression of IGF2BP3. (B) Representative images of IHC staining for IGF2BP3 in colorectal normal tissues and colorectal cancer tissues. Scale bar, 100 µm (left panel). The IHC score of IGF2BP3 was markedly higher in the CRC tissues than in the adjacent normal tissues (N=16) (right panel). (C) The mRNA level of IGF2BP3 was analyzed in two independent CRC patient cohorts, GSE41258 (left panel) and GSE106582 (right panel), showing that the IGF2BP3 mRNA levels were increased in the CRC tissues compared to the paired adjacent tissues. (D) The mRNA level of IGF2BP3 was analyzed in CRC patients (GSE41258) with higher or lower stage. *P<0.05, ***P<0.001, ****P<0.0001.
Figure 2
Figure 2
Oncogenic roles of IGF2BP3 in CRC. (A) Establishment of IGF2BP3-overexpressing SW480 cells. The expression of IGF2BP3 was analyzed with western blotting analysis. (B) Cell proliferation assays were performed in the IGF2BP3-overexpressing SW480 cells and control cells. (C) A total of 10,000 IGF2BP3-overexpressing SW480 cells and control cells were seeded into 6-well plates, and the colony formation ability of each group was assessed. Representative images are shown in (C) (left panel). The results were quantitatively analyzed (right panel). (D, E) Cell proliferation assays were performed in the stable IGF2BP3-deficient HCT116 (D) and DLD1 (E) cells and control cells. (F, G) A total of 2,000 stable IGF2BP3- deficient HCT116 (F) and DLD1 (G) cells and control cells were seeded into 6-well plates, and the colony formation ability of each group was assessed. Representative images are shown in (F and G) (left panel). The results were quantitatively analyzed (right panel). (H-K) Stable IGF2BP3-depleted HCT116 (H) or DLD1 (I) cells and control cells were subcutaneously injected into male BALB/c nude mice. The tumor growth was measured (H, I). Representative images are shown (J, K left panel), and the tumor weights from each group were statistically analyzed (J, K right panel). *P<0.05, ***P<0.001, ****P<0.0001.
Figure 3
Figure 3
Identification of IGF2BP3-interacted proteins and target mRNAs. (A) Cellular extracts from the SW480 cells stably expressing FLAG (control) or FLAG-IGF2BP3 were immunoprecipitated with an anti-FLAG M2 affinity gel and eluted with 2x loading buffer. The protein eluates were resolved by 10% SDS-PAGE gel electrophoresis and silver-stained. The indicated protein bands were retrieved for mass spectrometry analysis. (B) Whole-cell lysates from the FLAG-IGF2BP3-overexpressing SW480 cells and control cells were prepared, and co-IP was performed with an anti-FLAG M2 affinity gel. The immunoprecipitates were then blotted using antibodies against the indicated proteins. (C) Whole-cell lysates from HCT116 cells were prepared, and co-IP was performed with an antibody against ELAVL1. The immunoprecipitates were then analyzed by using antibodies against the indicated proteins. (D) Analysis of the potential overlapping mRNA targets of IGF2BP3 and ELAVL1 according to the Starbase database (http://starbase.sysu.edu.cn). (E) RIP analysis was performed to validate the binding of IGF2BP3 to the regulatory regions of the KRAS, MAP2K1, TPR, and CCNH mRNA transcripts in the IGF2BP3-overexpressing SW480 cells and control cells. (F) RIP analysis was performed to validate the binding of ELAVL1 to the regulatory regions of the KRAS, MAP2K1, TPR, and CCNH mRNA transcripts in SW480 cells. **P<0.01, ****P<0.0001.
Figure 4
Figure 4
Analysis of IGF2BP3-mediated mRNA stability. (A) Analysis of the average mRNA half-lives of KRAS, MAP2K1, TPR and CCNH in the SW480 cells stably overexpressing IGF2BP3 and the control cells. (B, C) Both the IGF2BP3-overexpressing SW480 cells and control cells were treated with actinomycin D for 60 and 80 min respectively. Total RNA was extracted, the relative expression of MAP2K1 (B) and TPR (C) was calculated, and the mRNA half-lives of these genes were analyzed. (D) RT-qPCR analysis was performed to analyze the mRNA expression of MAP2K1 and TPR in the SW480 cells stably overexpressing IGF2BP3 and the control cells. (E) RT-qPCR analysis was performed to analyze the mRNA expression of MAP2K1 and TPR in the IGF2BP3-deficient HCT116 cells and control cells. (F) Schematic graph depicts the RNA-binding domains of IGF2BP3 and indicated deletions mutants constructed for the following study. (G) Western blot analysis showed the molecular weights of indicated IGF2BP3 deletion mutants. (H, I) The indicated IGF2BP3 deletion mutants and IGF2BP3 (WT) were stably overexpressed in SW480 cells. Cells were treated with actinomycin D for 60 and 80 min respectively. Total RNA was extracted, the relative expression of MAP2K1 (H) and TPR (I) was calculated, and the mRNA half-lives of these genes were analyzed. (J) The indicated IGF2BP3 deletion mutants and IGF2BP3 (WT) were stably overexpressed in SW480 cells and a CCK-8 assay was performed to measure the cell proliferation in the indicated groups. *P<0.05, **P<0.01, ****P<0.0001.
Figure 5
Figure 5
ELAVL1 facilitates IGF2BP3-regulated mRNA stability. (A) Establishment of IGF2BP3-overexpressing SW480 cells with stable ELAVL1 depletion. The expression of ELAVL1 and IGF2BP3 was analyzed by western blotting. (B) RIP analysis was performed to analyze the binding of IGF2BP3 to the regulatory regions of the MAP2K1 and TPR mRNAs in the SW480 cells overexpressing IGF2BP3 and these cells with the additional stable depletion of ELAVL1. (C, D) Analysis of the mRNA half-lives of MAP2K1 (C) and TPR (D) in the SW480 cells overexpressing IGF2BP3 and these cells with the additional stable depletion of ELAVL1. (E, F) The mRNA expression of MAP2K1 (E) and TPR (F) in the IGF2BP3-overexpressing SW480 cells and these cells with the additional stable depletion of ELAVL1 was analyzed with RT-qPCR assay. (G-J) Analysis of the clinical correlations between IGF2BP3/ELAVL1 and MAP2K1/TPR expression with the GEPIA database [18]. **P<0.01, ***P<0.001, ****P<0.0001.
Figure 6
Figure 6
Functional characterizations of two IGF2BP3-regulated targets in CRC. (A, B) The mRNA levels of MAP2K1 (A) and TPR (B) were analyzed in two independent CRC patient cohorts. (C) HCT116 cells were transfected with siRNA targeting MAP2K1 and a nontargeting siRNA control, and the knockdown efficiency of MAP2K1 was confirmed by western blotting analysis (left panel). The effect of MAP2K1 silencing on the proliferation of HCT116 cells was analyzed with a CCK-8 assay (right panel). (D) HCT116 cells were transfected with siRNA targeting TPR and a nontargeting siRNA control, and the knockdown efficiency of TPR was confirmed by western blotting analysis (left panel). The effect of TPR silencing on the proliferation of HCT116 cells was analyzed with a CCK-8 assay (right panel). (E, F) The SW480 cells overexpressing IGF2BP3 were further transfected with siRNA targeting MAP2K1 (E) and TPR (F). The expression of IGF2BP3, MAP2K1 and TPR was analyzed with RT-qPCR analysis (E, F left panel). The proliferation of the indicated cells was examined with a CCK-8 assay (E, F right panel). *P<0.05, **P<0.01, ***P<0.001, ****P<0.0001.

Similar articles

Cited by

References

    1. Bray F, Ferlay J, Soerjomataram I, Siegel RL, Torre LA, Jemal A. Global cancer statistics 2018: GLOBOCAN estimates of incidence and mortality worldwide for 36 cancers in 185 countries. CA Cancer J Clin. 2018;68:394–424. - PubMed
    1. Dekker E, Tanis PJ, Vleugels JLA, Kasi PM, Wallace MB. Colorectal cancer. Lancet (London, England) 2019;394:1467–1480. - PubMed
    1. Keum N, Giovannucci E. Global burden of colorectal cancer: emerging trends, risk factors and prevention strategies. Nat Rev Gastroenterol Hepatol. 2019;16:713–732. - PubMed
    1. van der Stok EP, Spaander MCW, Grünhagen DJ, Verhoef C, Kuipers EJ. Surveillance after curative treatment for colorectal cancer. Nat Rev Clin Oncol. 2017;14:297–315. - PubMed
    1. Grazioso TP, Brandt M, Djouder N. Diet, microbiota, and colorectal cancer. iScience. 2019;21:168–187. - PMC - PubMed

LinkOut - more resources